


Abstract
The Anopheles quadrimaculatus s.l. (Say) complex consists of at least five species distinguished by distribution, genetic incompatibility, and allele frequencies. However, the distributions of the members have only been described by collection locations. Building on this information and environmental data, preliminary predictions of their distribution were produced using a genetic algorithm and point occurrence data. Based on resulting predicted border areas and undersampled regions, we obtained and analyzed additional geo-referenced specimens and compared their distribution with our preliminary predictions. We found good agreement between the preliminary predictions and the subsequent collections, regardless of the fact that additional specimens were deliberately sought from areas most likely to reveal inconsistencies. Final predicted distributions describe widespread distribution of A.quadrimaculatus throughout the eastern United States. A. maverlius and A. smaragdinus have similar predicted ranges limited to the southeastern United States. The predicted ranges of the sister taxa A. diluvialis and A. inundatus were similar to one another along the southeastern coast even though they seem to be allopatric. The historical role of A. quadrimaculatus s.l. in transmission of malaria was also examined. We conclude that A. quadrimaculatus s.s. was the only species of the complex capable of vectoring malaria in the United States throughout the area in which malaria occurred. However, any or all the members of the complex may have been regionally important, particularly in areas of most intense transmission.
Anopheles quadrimaculatus Say s.l. was considered to be a single species until biological evidence necessitated subdivision into a species complex in the late 1900s. A combination of genetic crossing, isozyme, and cytological information convincingly showed that there are at least five species in the group: A. quadrimaculatus s.s. Say, A. smaragdinus Reinert, A. diluvialis Reinert, A. inundatus Reinert, and A. maverlius Reinert. This information has been reviewed, extensively referenced, and supplemented by Reinert et al. (1997), and a bibliography for the complex has been compiled (Reinert 1997). Insofar as these collections were complete, each species seemed to have a unique distribution, with A. quadrimaculatus s.s. being most widely distributed in the eastern United States and southeastern Canada (Seawright et al. 1991).
While previous reports identified the counties from which each species was known to occur, no predictions of species' distributions were attempted. Before the detection of the complex, collections in the midwest and northeastern United States consisted largely of individuals identified only as A. quadrimaculatus s.l., and therefore, little member-specific distribution information was available for these regions. Collections in which species were identified after the subdivision consisted of material mostly from the southeastern United States, leaving large areas of the eastern United States unrepresented.
To predict the distribution of these species, we chose a computational approach that has proven useful for predicting species distributions, likelihood of establishment, and alterations of ranges caused by climate change: the implementation of a genetic algorithm known as the Genetic Algorithm for Rule-set Prediction (GARP) (Stockwell and Peters 1999). This approach uses environmental and species point-occurrence data to create rules that predict distribution. These rules are automatically permuted and refined until sets of models are created that optimize the omission of occurrences against overprediction. This computational approach can develop complex reticulated multidimensional niches based on information such as topological, climatic, plant and animal distribution, and land-use data. Because many insects with wide distributions have members that are not easily distinguished and/or may occur in remote areas that are not easily sampled, the method's ability to create predictive maps based on few specimens is especially relevant for entomological applications (Stockwell and Peterson 2002).
Using published point occurrence information, we created preliminary distribution maps of the members of the complex based on environmental data. Thereafter, we obtained unpublished information and analyzed new specimens to determine the quality of these distribution maps. Finally, we predicted the distributions of the members of the complex based on all available point-occurrence data and related this to the history of malaria transmission in the United States.
Materials and Methods
Computer Analysis.
Models were created using the desktop GARP software (Stockwell and Peters 1999) as modified for use on a PC (Scachetti-Pereira 2003). This software automatically creates combinations of logical, range, and logistic rules based on species point-occurrence data and sets of environmental data to produce spatially predictive test models. Initially, test models are compared with a training data set (usually consisting of one-half the sample data), and the rule values and combinations are modified for subsequent iterations. The number of iterations can be preset, or the program can be instructed to stop iterations when subsequent rules show little change relative to the set already developed (converge). The result is a rule statement set that predicts presence or absence for each pixel in the area under consideration. The best of these rule sets are selected to create a final predictive model. For the final predictions, we created 2,000 rule sets for each species using convergence limits of 0.01 and limiting the number of iterations per prediction to 1,000. The best subsets procedure (Anderson et al. 2003) was used to select the models with the highest predictive values. These were summed in ArcView GIS (ESRI, Redlands, CA) to produce final maps. Environmental data layers consisted of ASCII raster grids at a resolution of 0.1°. Preliminary analysis of layers demonstrated that those with the greatest effects on the distribution (data not shown) were daily temperature range, precipitation, mean minimum temperature, mean maximum temperature, mean temperature, vapor pressure (obtained from the Intergovernmental Panel on Climate Change for the years 1961–1990), aspect, elevation, and slope (obtained from Arc Atlas, ESRI, Redlands, CA). These were used for all subsequent analysis. A. quadrimaculatus s.l. point occurrence data for preliminary analysis was obtained from Reinert et al. (1997) or directly from their sources. Decimal longitude and latitude of specimen collection sites were determined using Microsoft Encarta (Microsoft, Redmond, WA) and the United States Geological Survey, Geographic Names Information System (USGS 2003). This dataset consisted of 404 unique point occurrences and is available from the authors on request.
Specimen Identification by Polymerase Chain Reaction.
Specimens of A. quadrimaculatus s.l. collected during 2001–2002 were obtained from numerous individuals and public health departments throughout the eastern United States. These consisted of pooled mosquitoes homogenized in BA-1 medium that were obtained during the course of WNV surveillance and dried or frozen individuals. Samples were geo-referenced at least to the centroid of the county of collection. Mosquitoes were prepared without DNA purification for polymerase chain reaction (PCR) as described by Rafferty et al. (2002). Some species-identification PCR was performed using the primers and conditions specified by Cornel et al. (1996). This method distinguishes species based on diagnostic DNA fragments resulting from PCR amplification of the ribosomal DNA ITS2 region. Because this method uses primers that have different annealing temperatures, each is used at a different concentration. So that a single primer concentration and higher annealing temperature could be used, we designed and used a new set of primers of 18–23 bp with annealing temperatures of ≈60°C (Table 1). These were chosen to yield more distinct fragment sizes, and all of the latter were used at a concentration of 1 pM. Primer AQD recommended by Cornel et al. for A. maverlius was the same in both sets. Reactions contained 1× Promega TaqDNA polymerase buffer (Madison, WI), 3.2 mM MgCl2, 0.20 or 0.25 mM dNTPs, and 0.04 U/μl Promega TaqDNA polymerase. Thermal cycling conditions were as follows for the Cornel et al. primer set: 95°C for 2 min followed by 30 cycles of 95, 50, and 72°C (30 s each temperature), followed by 72°C for 1 min. The new primer set reaction conditions differed only by annealing at 57°C rather than 50°C. Fragment sizes were determined in comparison with molecular weight markers on 1.5% agarose gels in tris-borate-EDTA buffer. Positive controls consisted of A. quadri-maculatus s.s. ROSEYE (product MRA-122; Malaria Reference and Research Reagent Resource Center, Manassas, VA) mosquitoes. Negative controls usually consisted of a sample having no added template DNA, A. freeborni F1 (MRA-130) colony mosquitoes, and A. gambiae G3 (MRA-112) mosquitoes.
Primers designed for identification of A. quadrimaculatus s.l. member species
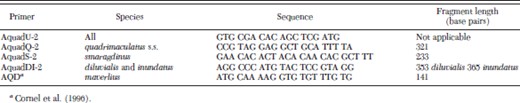
Primers designed for identification of A. quadrimaculatus s.l. member species
Results and Discussion
PCR Identification of Complex Members.
Differences between the results of the PCR primers of Cornel et al. (1996) and those developed for this study are largely technical because the results with either set were comparable (Fig. 1). The new set does reduce cycling times because of the higher annealing temperature and would therefore be expected to provide higher specificity. Furthermore, the new primers are used at equimolar concentrations and are more convenient for reaction preparation.
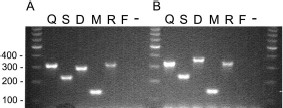
Visualization of PCR fragments produced using two primer sets for species identification. DNA products were amplified from one of two primer sets and stained with ethidium bromide and visualized under UV light in a 1.6% agarose gel. (A) Products using the Cornel et al. (1996) primer set and (B) using the primer set reported here (Table 1). A. quadrimaculatus s.l. DNA templates used for each lane are designated as follows: Q, quadrimaculatus; S, smaragdinus; D, diluvialis; M, maverlius; R, ROSE; F, A. freeborni; −, no DNA template added.
Statistical Test of the Model Excluding Specimens from Existing Data.
As a preliminary extrinsic test to determine whether the modeling system could accurately predict the distribution of these species, we asked if the data from one area was sufficient to predict species distribution significantly in another area. States were examined for those that contained all complex members on which predictions outside of those states could be extrapolated. Only Florida satisfied this criterion, but we excluded A. diluvialis because it had not been identified elsewhere. For the four remaining species, the predictions at the highest level of model agreement were significant (Table 2). The A. quadrimaculatus predictions had the lowest significance because of its generally wide distribution, which could be predicted solely by chance. These results are similar to predictions we performed using the same method for the A. gambiae complex in Africa for which a larger number of specimens and wider distribution data were available (Levine et al. 2004) and confirm that GARP can predict species distributions using even limited data sets.
Extrinsic test of model performance
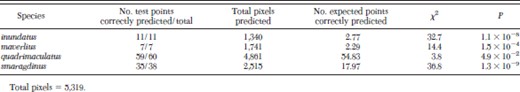
Extrinsic test of model performance
Predicted Distributions of Complex Members.
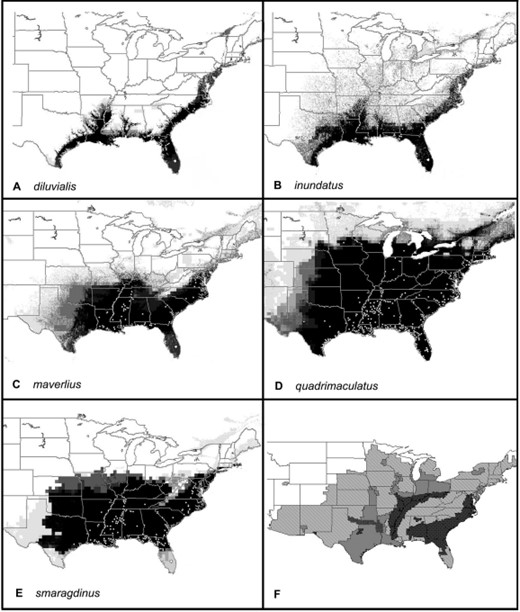
We created preliminary distribution maps of the five members of the complex using all original occurrence data (Fig. 2) with one exception: preliminary analysis of A. quadrimaculatus s.s. showed that inclusion of all data in the analysis skewed the distribution toward the greatest concentration of samples in the southeast (data not shown). Therefore, for preliminary analysis of this species, data were stratified by random selection of ≤10 points from each state.
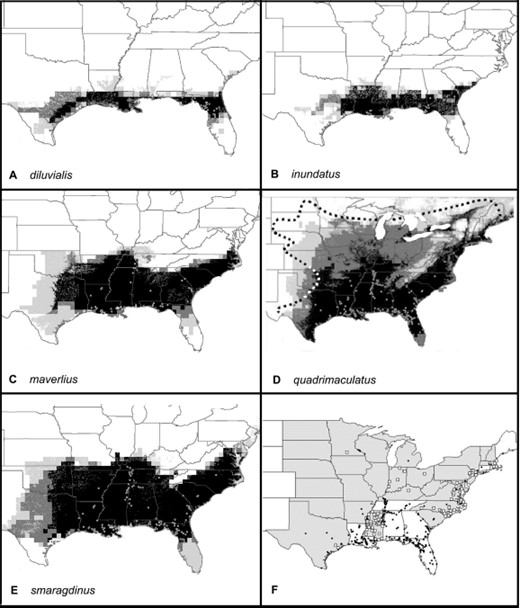
Predicted distribution of members of the A. quadrimaculatus complex based on preliminary data. Darker shades of gray represent increasing numbers of models that agree and no occurrence is predicted in white areas. (A) A. diluvialis, (B) A. inundatus, (C) A. maverlius, and (D) A. quadrimaculatus contain an outline of the species complex distribution according to Darsie and Ward(1981). (E) A. smaragdinus and (F) states from which additional samples were actively solicited. In A–F, sample information available on which preliminary models are based are represented by solid dots, and open squares represent new data. States from which additional samples were actively solicited are hatched.
Based on these preliminary predictions, we solicited and analyzed additional specimens from states we considered to be boundary and undersampled regions (Fig. 2F). We expected that analysis of specimens from these areas would stringently test the existing predictions and would also provide specimens from distinct habitats of the range of A. quadrimaculatus s.l. We particularly focused on midwestern and Atlantic seaboard states, and additional unpublished data were discovered during this process, especially for Mississippi.
After identification of these new geo-referenced specimens that we received during 2001 and 2002, final potential distributions of the members of the A. quadrimaculatus complex were made using all available data and the same environmental data layers as were used to create the preliminary predictions (Fig. 3, A-E; collection data available from the authors on request). Comparison of our predicted distribution for A. quadrimaculatus s.s. with the generalized map of Darsie and Ward (1981) for A. quadrimaculatus s.l. shows good agreement, and while we provide more fine-scale detail, we discovered no specimens outside of their estimated range.
Predicted distribution of members of the A. quadrimaculatus complex based on all data. Darker shades of gray represent increasing numbers of best subset models that agree, and no occurrence is predicted in white areas. (A) A. diluvialis, (B) A inundatus, (C) A. maverlius, (D) A. quadrimaculatus, (E) A. smaragdinus, and (F) our representation of the extent of malaria in the eastern United States around 1850; darker shades of gray represent higher intensity of transmission (Faust 1949). Circles indicate locations of all samples used for final models.
We also provide novel distribution data and range predictions for the remaining four complex members. These predictions reflect conservation of their ecological niches that correspond to their evolutionary divergence (Peterson et al. 1999). Concordance between relatedness and niche similarity is evident by examination of the similarity of their rDNA (Cornel et al. 1996) and predicted distributions. Specifically, the ranges of the sister species A. smaragdinus--A. maverlius largely coincide in the southeastern United States, and those of A. diluvialis--A. inundatus are limited to the southeastern coastal plain.
The latter two species were considered identical until detailed analysis revealed minor differences in isozyme alleles (Narang et al. 1990), and full species status was later assigned. This division is corroborated by the minor sequence differences observed in rDNA ITS2 sequences (Cornel et al. 1996). Although we predict that their potential ranges are similar, the distribution of these most closely related members of the complex is in fact strikingly allopatric. This suggests that mating and not environmental barriers effectively prevent sympatry throughout the full extent of their range. The discrepancy in the potential and realized niches is especially curious in light of the fact that the Apalachicola River in north Florida seems to form a sharp boundary between the two members regardless of the apparently identical environment on either side.
The greatest differences between our preliminary predictions and final maps resulted from discoveries of A. diluvialis and A. smaragdinus north of their previously known range. Only one specimen of A. smaragdinus from both Virginia and Texas was in the original dataset, and we discovered additional populations in North Carolina and Massachusetts. Also, a previously undetected population of A. diluvialis was found in coastal North Carolina and Massachusetts—again an unsampled region in the northernmost part of its predicted range. Therefore, the exceptions to our preliminary predictions are similar to the poor performance of the A. quadriamculatus s.s. predictions before data stratification. We conclude that GARP model predictions are more robust when few samples are analyzed but which represent the breadth of the species ecological niche rather than large numbers from environmentally similar locations. Previously, point occurrence numbers as small as 30 have been shown sufficient for good predictions of bird distributions (Stockwell and Peterson 2002); however, we have not tested this hypothesis for mosquitoes.
Implications for Transmission of Malaria.
Because malaria transmission is now rare in the United States, we referred to historical transmission data to determine whether our predicted distribution of any member(s) of the complex coincided spatially with transmission. Our predicted distribution of A. quadrimaculatus agrees remarkably with the 1850 distribution of malaria transmission (Faust 1949) (Fig. 3F). Of particular interest are the fringes of the extent of malaria that coincide almost exactly with our prediction of the limit of A. quadrimaculatus distribution in Michigan, Wisconsin, South Dakota, and Nebraska. Assuming that the vector capacity of A. quadrimaculatus s.s. is similar throughout its range, we conclude that it alone was sufficiently widespread to account for the distribution of malaria in the United States and Canada. However, the highly intractable areas from which malaria was eradicated most recently—the Gulf and Atlantic coastal plains—contained at least three, if not all five, members of the complex. Other areas of less intense transmission in the Mississippi, Ohio, and Tennessee River valleys contained three species: A. quadrimaculatus s.s., A. smaragdinus, and A. maverlius.
In summary, the spatial analysis we have performed using the GARP approach provides useful information regarding the potential distribution of the members of the A. quadrimaculatus s.l. complex mosquitoes. While no method can predict where mosquitoes will in fact be found, we used these predictions to create testable hypotheses to guide control and collection efforts. These and similar rule sets could also be used to determine invasion risk from these or other species. Furthermore, distribution maps produced by this method may eventually provide a means to describe the distribution of species that are superior to the smoothed forms based on limited data, but which are necessarily typical of current maps.
The capability of GARP to produce predictive maps using small amounts of point occurrence data and publicly available environmental data shows its value for assessing the establishment and spread of vector species globally under numerous scenarios: accidental introduction, climate change, and bio-terrorism. Given the possible threat of reemerging tropical diseases, detection of sibling species complexes, and the ever-increasing movement of humans and their parasites worldwide, distribution maps of potential deadly vectors, such as the ones shown herein, will become valuable tools for public health and disease control.
Acknowledgements
We gratefully acknowledge numerous samples and generous cooperation from many state agencies and individual donors. We thank D. Burkett and M. Potter (CDC); M. Sinsko (Indiana State Department of Health); C. Mahl (Kentucky Department for Public Health, Mosquito Surveillance Program); S. Hennigan (Massachusetts Department of Health); C. Lesser, J. Dorothy, and M. Cantwell (Maryland Department of Agriculture Mosquito Control Section); L. Robert (U.S. Uniform Health Services); J. Mallet and R. Fritzius (USDA Cooperative States Research Service, Riceland Mosquito Management Program for the Mississippi data); S. Fuller (Virology Laboratory of the Minnesota Department of Health) and D. Neitzel (Epidemiology Department of the Minnesota Department of Health); N. Newton, B. Harrison, R. Hickman, and the North Carolina Department of Environment and Natural Resources/PHPM section; A. Farajollahi and W. Crans (Department of Entomology, Rutgers University, NJ); J.-H. Lee (New York State Department of Health, Sullivan Co.); R. L. Berry, S. W. Chordas III, R. E. Gary, and R. A. Restifo (Vector-borne Disease Program of the Ohio Department of Health); C. Carlson (South Dakota Department of Health); G. F. Teltow (Chief, Texas Department of Health, Medical Entomology Laboratory); and K. Fisher, J. Halpus, and D. Gaines (Virginia Department of Health). R. S. Levine was supported by the CDC/APHL Emerging Infectious Diseases Training Fellowship Program.
References Cited
