


Abstract
In this study, we analyze and compare the genetic structure of edible dormice representing five populations, inhabiting forest complexes in southwestern Poland that differ in their degree of fragmentation and isolation. Total genomic DNA was isolated from hairs with bulbs of 145 individuals captured between 2018 and 2020. All dormice sampled were genotyped at 14 microsatellite loci. Population genetic analyses showed that genetic variability in the studied dormice, assessed based on observed and expected heterozygosity as well as allelic richness, was on average very low (0.39, 0.43, and 2.83, respectively). In the populations studied, genetic structure was detected indicating two or five distinct genetic clusters, the existence of which can be attributed to either historical factors or modern human activity. Genetic differentiation between dormice living in the studied localities, determined by FST, ranged from 0.07 to 0.40 (all FST coefficients were significant at P < 0.05). A significant positive correlation was detected between genetic differentiation and geographic distance (r = 0.645, P < 0.017), indicating that genetic differentiation increases with distance, but no correlation between genetic differentiation and habitat barriers (r = 0.359, P < 0.132). The results of this research are compared to those of other European populations of edible dormice, and implications for the future of this endangered species are discussed.
The earth is experiencing a biodiversity crisis. Up to 1 million plant and animal species are threatened with extinction as a consequence of human activities that have led to habitat loss, degradation, and fragmentation—all having adverse effects on the survival of species (Barnosky et al. 2012). The extent of the negative effects caused by habitat fragmentation, however, may depend on a number of factors such as the taxonomic group of organisms involved, the type of habitat in both the fragment and the surrounding matrix, life-history characteristics of species threatened by the negative effects of fragmentation, and the period that has elapsed since fragmentation. Meta-analyses have shown that plant species generally respond more strongly to fragmentation than animal species, and that the greatest negative effects of fragmentation have occurred in tropical and temperate forest fragments surrounded by a nonforest matrix (Schlaepfer et al. 2018).
Small mammals are a group of vertebrates in which the response of populations to habitat fragmentation has been widely studied (e.g., Mortellity et al. 2010; Malekian et al. 2015; Statham et al. 2022). Vertebrate taxa that have limited ability of movement are particularly vulnerable to the negative effects of habitat fragmentation. They include arboreal mammals, for which trees provide food, shelter, and a place to raise young (Taylor et al. 2011). Some arboreal species are very reluctant to move on the ground, and if they do decide to use this mode of locomotion, it will only be for short distances. This results in small, isolated populations that are at increased risk of extinction as forest fragmentation increases because of genetic and demographic constraints (Frankham et al. 2002; Frankham 2005). In general, loss of genetic variation can have detrimental effects on population fitness and viability (Leimu et al. 2006). In the short term, increased homozygosity can result in the expression of deleterious recessive alleles, which can reduce individual fitness through inbreeding depression (Reed and Frankham 2003; Charlesworth and Willis 2009). In the long term, reduced genetic diversity can affect the adaptive potential of populations to changing environmental conditions (Jump et al. 2009; Manel and Holderegger 2013).
Among the arboreal mammals particularly vulnerable to habitat fragmentation are rodents of the family Gliridae (dormice). One species in this family, the Edible Dormouse Glis glis, moves almost exclusively among the treetops during its active period (from late spring to mid-autumn) and is extremely reluctant to move on the ground. This species hibernates over the winter (from October to May), usually for 7–8 months (length of hibernation depends on location and climate; Kryštufek 2010). In Poland, the edible dormouse is threatened with extinction and therefore protected. As an arboreal species with severely restricted dispersal outside the treetops, it is particularly vulnerable to the effects of deforestation. In addition, its reproduction depends on access to food of suitable quality (cutting down old, fruit-bearing trees, especially beech, severely limits its preferred food and consequently reproduction). From the observation that G. glis avoids crossing roads and open ground, it has been deduced that fields and meadows act as barriers to their movements (Müller 1988; Hönel 1991; Bieber 1995). Studies on the behavior of this nocturnal rodent have shown that the only exception to such movements occurs prior to hibernation, when they descend from trees in order to hibernate in underground chambers, utilizing features such as rotten tree stump roots and old rabbit warrens (Thompson 1953; Brooks et al. 2012).
Knowing the genetic structure of populations inhabiting fragments of former contiguous habitats can assist with predicting the future sustainability of species with greater precision or help to decide which conservation measures should be taken. The aim of this study was to determine and compare the genetic structures of populations of G. glis inhabiting small, isolated forest fragments and of others inhabiting large, dense forest complexes. We hypothesize that human-induced fragmentation of habitats populated by this species leads to many small, isolated populations with significantly reduced genetic diversity.
Materials and Methods
Study area.
Dormice were sampled from five different locations in the Niemcza-Strzelin Hills in southwestern Poland (Table 1; Fig. 1). The study area, a mosaic of small woods and agricultural land, is situated in a landscape that is very intensively farmed for sugar beet, wheat, rapeseed, and maize. Two populations, from the Lipowe Hills (LH) and the Muszkowice Forest (MF), inhabit small forest complexes isolated from each other and from other forests. The other three—at Krzywina (K), Nowolesie (N), and Cyril’s Spring (Źródła Cyryla [ZC])—lie in the extensive, contiguous Strzelin Hills forest complex (Fig. 1) within a relatively narrow belt, about 10 km wide and about 22 km long, aligned from north to south. The characteristics of the habitats (forest species composition), surface areas (hectares), and distances between the localities (km) are shown in Table 2, while Fig. 2 shows the minimum distances between the forest complexes from which samples originated.
Coordinates, size of the areas, sample size, and occurring tree species of the different sampling sites: n = number of specimens; S = sycamore; A = ash; B = beech; O = oak; L = larch; P = pine; LH = Lipowe Hills; MF = Muszkowice Forest; K = Krzywina; N = Nowolesie; ZC = Źródła Cyryla.
| Location | Coordinates | Area (ha) | n | Habitat |
|---|---|---|---|---|
| LH | 50°43ʹ, 16°57ʹ | 292 | 27 | S, A, B, O |
| MF | 50°38ʹ, 16°57ʹ | 859 | 27 | B |
| Ka | 50°43ʹ, 17°07ʹ | 19 | B, L, O, P | |
| Na | 50°42ʹ, 17°04ʹ | 3,836 | 37 | B + O |
| ZCa | 50°37ʹ, 17°02ʹ | 35 | B | |
| Total | 145 |
aK, N, and ZC are located within the same forest.
Straight-line distances between locations (in km). LH = Lipowe Hills; MF = Muszkowice Forest; K = Krzywina; N = Nowolesie; ZC = Źródła Cyryla.
| Location | LH | MF | K | N | ZC |
|---|---|---|---|---|---|
| LH | x | 9.88 | 12.12 | 8.69 | 13.16 |
| MF | x | 15.15 | 10.39 | 6.47 | |
| K | x | 5.08 | 12.32 | ||
| N | x | 8.10 | |||
| ZC | x |
| Location | LH | MF | K | N | ZC |
|---|---|---|---|---|---|
| LH | x | 9.88 | 12.12 | 8.69 | 13.16 |
| MF | x | 15.15 | 10.39 | 6.47 | |
| K | x | 5.08 | 12.32 | ||
| N | x | 8.10 | |||
| ZC | x |
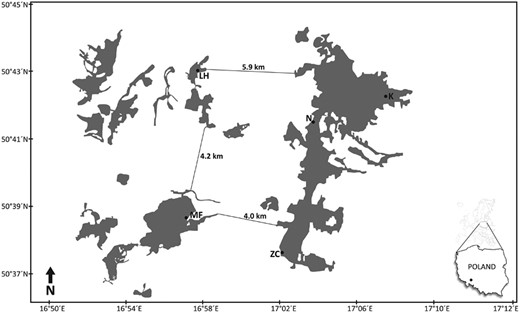
Study area (Niemcza-Strzelin Hills, southwestern Poland) of Glis glis populations. LH = Lipowe Hills; MF = Muszkowice Forest; K = Krzywina; N = Nowolesie; ZC = Źródła Cyryla.
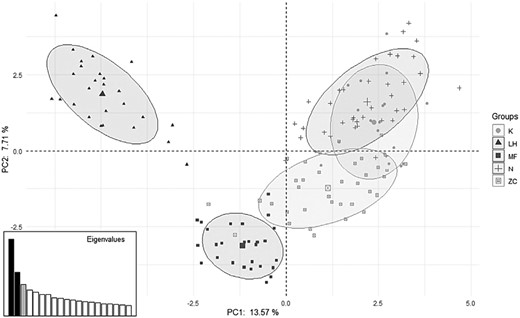
Results of principal component analysis (PCA). Axes represent loadings onto components 1 and 2. Sampling sites K, N, and ZC are located within the same forest. LH = Lipowe Hills; MF = Muszkowice Forest; K = Krzywina; N = Nowolesie; ZC = Źródła Cyryla.
Sample collection.
In order to obtain research material, around 100 dormouse boxes, deployed in their preferred habitats, were regularly inspected between 2018 and 2020. A few hairs with bulbs were collected for genetic studies from all individuals captured (the relevant permits from the Regional Directorate of Environmental Protection in Wrocław were nos. WPN.6401.363.2016.IL and WPN.6401.40.2020.MH.1). The hairs of each individual were kept in a separate sample bag and transported to the laboratory. To avoid resampling, hairs were sampled only once from juveniles born at a given study site. In all, material was obtained from 145 dormice (Table 1). All research followed ASM guidelines (Sikes et al. 2016).
Molecular methods.
Total genomic DNA was isolated from the hairs with bulbs using a Sherlock AX Kit (A&A Biotechnology, Gdańsk, Poland). All dormice sampled were genotyped at 14 microsatellite loci (2pilch, 3pilch, 4pilch, 5pilch, 7pilch, 20pilch, 24pilch, 26pilch, 30pilch, 36pilch, Gg3, Gg7, Gg9, Gg13) using previously published primers (Dabert et al. 2009, 2013; Hürner et al. 2009). Most microsatellite markers were grouped into four multiplex sets: Mix1 (Gg3+Gg9+Gg13); Mix2 (7pilch + 26pilch); Mix3 (24pilch + 30pilch + 36pilch); and Mix4 (2pilch + 3pilch + 5pilch). The forward primer of each locus was 5ʹ-end labeled with a fluorescent dye (FAM, JOE, HEX, NED). Three microsatellites (4pilch, 20pilch, and Gg7) were amplified separately.
The microsatellites used in this study were amplified using the Qiagen Multiplex PCR Kit. Reactions were subjected to the following program: 95°C for 5 min, followed by 30 cycles of 95°C for 30 s, annealing temperature (see Dabert et al. 2009, 2013; Hürner et al. 2009) for 90 s and 72°C for 30 s, and final extension at 65°C for 45 min (Herdegen et al. 2015). The fragment analysis was performed using an ABI PRISM 3100 Genetic Analyzer (Applied Biosystems). The amplified alleles were scored using GeneMapper 4 (Applied Biosystems, Waltham, MA).
Statistical analysis.
Population genetic analyses were performed using the R project (R Development Core Team 2021). First, basic parameters of genetic variability were determined for all microsatellite loci used in the study. The number of alleles (A) was estimated using the “pegas” package (Paradis 2010). Observed (HO) and expected (HE) heterozygosity and inbreeding coefficients (FIS) for each locus were estimated using the “hierfstat” package (Goudet and Jombart 2022). The same genetic parameters were then determined separately for each of the five populations, and allelic richness (AR) and number of private alleles (Pa) were determined using the “PopGenReport” package (Adamack and Gruber 2014). Hardy–Weinberg equilibrium (HWE) tests for each locus in each population sample were performed using the “pegas” package. Null allele frequencies were estimated using the Chakraborty (Chakraborty et al. 1994) and Brookfield (1996) algorithms implemented in the “PopGenReport” package. Only loci with null allele frequencies below 8% and those for which the 95% confidence interval for null allele frequencies included 0 were used in the analysis. At remaining loci, one allele was removed from the homozygotes (Oddou-Muratorio et al. 2008).
To identify genetic differences between populations of dormice, microsatellite data were analyzed using principal component analysis (PCA) of the first two principal components using the “ade4” (Dray and Dufour 2007) and “factoextra” (Kassambara and Mundt 2020) packages.
To examine the genetic structure of the populations and estimate the most likely number of genetically distinct groups, genetic cluster analyses were performed using discriminant analysis of principal components (DAPC) implemented in the “adegenet” package (Jombart 2008). Two other approaches were also used to cross-check the results of DAPC: (1) analysis of molecular variance (AMOVA), based on the F-statistic implemented in the “poppr” package (Kamvar et al. 2014, 2015); and (2) a Bayesian approach implemented in the “Structure” package v. 2.3.4 (Pritchard et al. 2000). Correlated allele frequencies were applied with the admixture model, varying K from 2 to 5. Twenty replicates for each K of 500,000 burn-ins and 750,000 replicates. To analyze the Structure results, the Delta K method (Evanno et al. 2005) was used in combination with a standard K prediction based on a plot of the mean ln probability of K (L(K)). Both plots (Delta K and L(K)) were estimated using Structure Harvester (Earl and Von Holdt 2012).
A hierarchical AMOVA was conducted to determine whether there were any differences in genetic variability among the populations living in small isolated versus contiguous forest types, and to assess whether habitat fragmentation could have contributed to genetic differentiation. In addition, all populations were compared pairwise based on values of FST and Jost’s D. These statistics were estimated using the “mmod” (Winter 2012) and “hierfstat” packages.
The relationships between genetic diversity and geographic distances—and genetic diversity and habitat barriers—were examined using a simple Mantel test (Mantel 1967; R Development Core Team 2021) of the significance of the correlation between two matrices. The genetic diversity matrix consisted of pair-by-pair genetic distances. The barrier matrix contained 1 if the samples were separated by a habitat barrier (nonforested area) and 0 if they were not. The geographic distance matrix provided the distance (based on geographic coordinates) between sites.
Results
Genetic variation in individual loci.
The basic parameters of genetic variability estimated for the loci studied are shown in Table 3. The number of alleles per microsatellite locus ranged from 2 to 6 (average 4.28). The most variable loci were Gg7 and 26pilch, while the least variable was 3pilch. The observed heterozygosity (HO) per locus ranged from 0.03 to 0.60 and averaged 0.39 at all loci. The expected heterozygosity (HE) ranged from 0.03 to 0.62 with an average of 0.43.
Basic parameters of genetic variability estimated for studied Glis glis: A = number of alleles; Ho = observed heterozygosity; HE = expected heterozygosity; FIS = inbreeding coefficient, per locus and over all microsatellite loci; HWE = Hardy–Weinberg equilibrium.
| Locus | A | Ho | HE | FIS | HWE P-value |
|---|---|---|---|---|---|
| Gg3 | 4 | 0.35 | 0.33 | −0.048 | 0.804 |
| Gg7 | 6 | 0.52 | 0.62 | 0.159 | 0.000 |
| Gg9 | 3 | 0.28 | 0.33 | 0.145 | 0.016 |
| Gg13 | 5 | 0.60 | 0.62 | 0.038 | 0.001 |
| 2pilch | 3 | 0.21 | 0.19 | −0.106 | 0.289 |
| 3pilch | 2 | 0.03 | 0.026 | −0.053 | 0.000 |
| 4pilch | 5 | 0.40 | 0.42 | 0.043 | 0.007 |
| 5pilch | 4 | 0.44 | 0.56 | 0.217 | 0.000 |
| 7pilch | 5 | 0.46 | 0.53 | 0.132 | 0.000 |
| 20pilch | 4 | 0.34 | 0.35 | 0.020 | 0.000 |
| 24pilch | 5 | 0.52 | 0.51 | −0.019 | 0.000 |
| 26pilch | 6 | 0.49 | 0.59 | 0.160 | 0.000 |
| 30pilch | 5 | 0.46 | 0.44 | −0.051 | 0.011 |
| 36pilch | 3 | 0.39 | 0.38 | −0.035 | 0.001 |
| Total | 60 (av. 4.28) | 0.39 | 0.42 | 0.067 | — |
Tests for genotype frequency deviation from the HWE and genotypic linkage disequilibria did not indicate any significance for Gg3 and 2pilch, but the other loci deviated significantly from HWE (Table 3).
Genetic variation between populations and population genetic structure.
Genetic variability of populations from the different localities was assessed using the parameters shown in Table 4. The average allelic richness (AR) in the different localities varied from 2.30 to 3.28. The average observed heterozygosity (HO) ranged from 0.27 to 0.51, and the expected heterozygosity (HE) from 0.30 to 0.53. The value of FIS in each population was low, from 0.03 to 0.12, but highest in the LH and only for this population did its value differ significantly from zero. Very few private alleles were found in the five populations (max. 3 in the LH, and only 10 in all the localities).
Genetic diversity in Glis glis populations based on microsatellite loci: n = number of individuals; A = number of alleles; AR = allelic richness; observed (HO) and expected (HE) heterozygosity; FIS = inbreeding coefficient; Pa = number of private alleles; LH = Lipowe Hills; MF = Muszkowice Forest; K = Krzywina; N = Nowolesie; ZC = Źródła Cyryla.
| Location | n | A | AR | Ho | HE | FIS | Pa | |
|---|---|---|---|---|---|---|---|---|
| 1. | LH | 27 | 38 | 2.53 | 0.27a | 0.31 | 0.12* | 3 |
| 2. | MF | 27 | 36 | 2.30 | 0.27ab | 0.30 | 0.09 | 1 |
| 3. | K | 19 | 43 | 3.01 | 0.48ab | 0.53 | 0.09 | 1 |
| 4. | N | 37 | 51 | 3.28 | 0.51b | 0.53 | 0.03 | 2 |
| 5. | ZC | 35 | 48 | 3.04 | 0.43ab | 0.45 | 0.04 | 3 |
| Total | — | 145 | — | 2.83 | 0.39 | 0.42 | — | — |
*Significant at P < 0.05.
AR, HO, HE, and FIS that is significantly different (P < 0.05) between populations are marked with different letters.
PCA of the microsatellite data showed that LH and MF were quite separate from the other three populations. A two-dimensional PCA plot showed that the first principal component accounted for 13.57% of total genetic variation, while the second principal component was responsible for 7.71% of the variation (Fig. 2).
Genetic structure analyses performed using DAPC unambiguously identified five genetic clusters as the most likely number of genetically distinct populations, corresponding to the five populations inhabiting each locality (Fig. 3). The most likely number of genetic clusters for DAPC was determined using the Bayesian Information Criterion (BIC), comparing different K-means clustering solutions, resulting in the most probable number of clusters being K = 5 (Fig. 4).
Plot showing the most likely number of genetically distinct groups for the Glis glis populations obtained using discriminant analysis of principal components (DAPC). LH = Lipowe Hills; MF = Muszkowice Forest; K = Krzywina; N = Nowolesie; ZC = Źródła Cyryla.
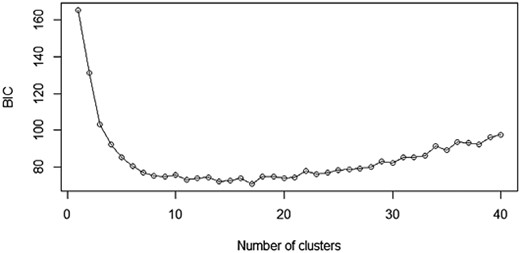
Bayesian Information Criterion (BIC) estimates to infer the number of genetic clusters (K) in the studied populations of Glis glis.
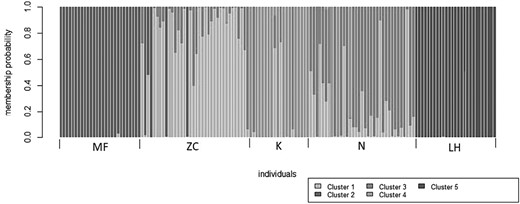
Analysis of genetic structure using the STRUCTURE program to determine the number of independent genetic groups (clusters) showed the presence of two clearly distinct genetic clusters (the highest value of ∆K shows K = 2 to be the optimal genetic structure of the populations; Figs. 5 and 6). The first cluster groups dormice from the MF and LH populations, that is, those from the isolated, small forest complexes located in the west of the study area (Fig. 1). The second cluster includes individuals living in the extensive forest complex of the Strzelin Hills (N, K, and ZC; Fig. 6).

Results of genetic structure analysis of studied dormice populations using STRUCTURE program (analyses were performed for K = 2, 3, 4, and 5). LH = Lipowe Hills; MF = Muszkowice Forest; K = Krzywina; N = Nowolesie; ZC = Źródła Cyryla.
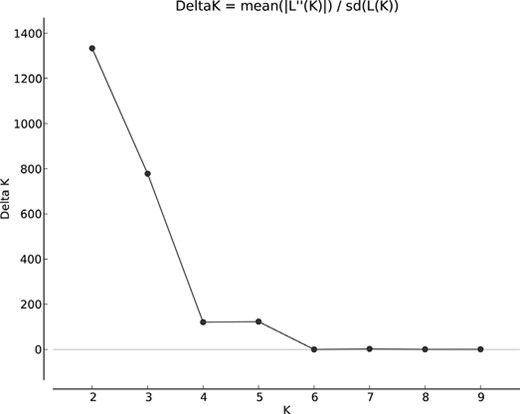
The Delta K plot showing the highest pick at K = 2 (the most probable number of genetic clusters).
AMOVA (Table 5) showed that about 76% of the genetic variance was due to variability between individuals, while 23% of the genetic variance was due to differences between populations (P ≤ 0.001). Less than 1% of the genetic variation was caused by genetic differences between individuals within populations.
Analysis of molecular variance (AMOVA) of autosomal microsatellites.
| Source of variation | d.f. | Sum sq | Mean sq | % variation | P-value |
|---|---|---|---|---|---|
| Between populations | 4 | 251.87 | 62.97 | 23.03 | 0.001 |
| Between individuals within populations | 140 | 491.07 | 3.51 | 0.87 | 0.329 |
| Between individuals | 145 | 497.20 | 3.43 | 76.09 | 0.001 |
Genetic differentiation among dormice living in the studied localities, as determined by FST, was generally high—from 0.07 to 0.40—and all FST and Jost’s D coefficients were statistically significant (P < 0.05; Table 6). Genetic differentiation was lowest between individuals from the large, dense forest complexes—that is, 0.07 between Krzywina (K) and Nowolesie (N), and 0.10 between Nowolesie (N) and Cyril’s Spring (ZC) (0.07). In contrast, dormice from the two small populations isolated from the main forest complex (LH and MF) showed very pronounced genetic differentiation both among themselves and when compared pairwise with all the other populations (FST > 0.25; Table 6).
Pairwise FST (above diagonal) and Jost’s D values (below diagonal) for Glis glis populations studied. LH = Lipowe Hills; MF = Muszkowice Forest; K = Krzywina; N = Nowolesie; ZC = Źródła Cyryla.
| Locality | LH | MF | K | N | ZC |
|---|---|---|---|---|---|
| LH | x | 0.40* | 0.40* | 0.36* | 0.36* |
| MF | 0.29* | x | 0.26* | 0.26* | 0.19* |
| K | 0.46* | 0.24* | x | 0.07* | 0.14* |
| N | 0.41* | 0.26* | 0.08* | x | 0.10* |
| ZC | 0.35* | 0.14* | 0.15* | 0.11* | x |
| Locality | LH | MF | K | N | ZC |
|---|---|---|---|---|---|
| LH | x | 0.40* | 0.40* | 0.36* | 0.36* |
| MF | 0.29* | x | 0.26* | 0.26* | 0.19* |
| K | 0.46* | 0.24* | x | 0.07* | 0.14* |
| N | 0.41* | 0.26* | 0.08* | x | 0.10* |
| ZC | 0.35* | 0.14* | 0.15* | 0.11* | x |
*P < 0.05.
A Mantel permutation test performed to assess the pairwise correlation between geographic distances and genetic differentiation observed in all localities showed a high significant positive correlation between genetic differentiation and geographic distance (r = 0.645, P = 0.017), indicating that genetic differentiation increases with distance. No correlation was found between genetic differentiation and habitat barriers (r = 0.359, P = 0.132).
Discussion
Habitat fragmentation and loss are the main causes of biodiversity loss (Haddad et al. 2015; Perrin et al. 2021). Considering biodiversity at the genetic level, it is believed that a reduction in the area of habitats and their increased isolation will reinforce genetic drift and impede gene flow, ultimately leading to a decrease in genetic diversity within populations and an increase in their differentiation (Keyghobadi 2007). The progressive deforestation of our planet means that this phenomenon affects arboreal species—including mammals—many of which are already endangered. Deforestation causes the formation of small, isolated forest complexes, whose inhabitants with limited mobility lose the opportunity to exchange genes with other members of their species. Therefore, monitoring the genetic structure of such isolated populations and protecting their genetic diversity are fundamental to their conservation.
Small arboreal mammals moving through the tree canopy are particularly vulnerable to habitat fragmentation. For example, research on the effects of the landscape matrix on the connectivity of Sugar Glider (Petaurus breviceps) populations has provided evidence of reduced dispersal and connectivity across fragmented habitat patches (Malekian et al. 2015). Another tree-dependent mammal—the Australian Squirrel Glider (Petaurus norfolcensis)—which rarely ventures onto the ground, is also vulnerable to loss of tree cover, with populations clustered in areas exposed to fragmentation for long periods exhibiting more pronounced genetic restructuring. Conversely, populations located in regions where there still is, or until recently was, extensive tree cover show gene flow over large spatial scales (Taylor et al. 2011).
We analyzed and compared the genetic structure of dormice representing five populations, inhabiting forest complexes in southwestern Poland that differ in their degree of fragmentation and isolation. Two populations inhabited two small forest complexes, isolated both from each other and from the extensive forest complex in which the other three populations lived (Fig. 1). The study showed that genetic variability, assessed on the basis of observed (HO) and expected (HE) heterozygosity, was very low (average HO = 0.39 and HE = 0.43; Table 4). The average allelic richness was likewise very low (AR = 2.83). Our previous study of dormice in the Polish Sudety Mountains (southwestern Poland) also showed low genetic variability (average HO = 0.41 and HE = 0.43; average AR = 2.39; Moska et al. 2018).
Low genetic diversity has been observed in many European populations of edible dormice in Germany, Spain, Belgium, and Poland (Dabert et al. 2009; Hürner et al. 2009; Segelbacher et al. 2010; Fietz et al. 2014; Herdegen et al. 2015; Moska et al. 2016). Depending on the country in which the study was conducted, the average HO and HE ranged from 0.25 to 0.45, and 0.29 to 0.53, while the average number of alleles per locus varied from 1.9 to 5.2. Researchers have suggested that a reason for this variation is habitat deforestation and fragmentation of its habitat, hindering or preventing contact between neighboring populations, thus restricting gene flow and reducing genetic variability. Furthermore, as speculated by Fietz et al. (2014), the low genetic variability of G. glis in Central Europe could be a result of several bottlenecks during the glacial periods and the migration of only a small group of individuals that had colonized the region after the last glaciation. Whatever the reason, low genetic variability can prevent adaptive responses to environmental change, threatening the long-term viability of this species.
Comparison of the basic parameters of genetic variability in these populations showed clearly that their values were lower in dormice inhabiting small forest complexes, isolated by cultivated areas (MF and LH; Fig. 1, Table 4). These results indicate that the higher level of homozygosity in these populations is due to reduced gene exchange with other populations. In addition, although the estimated inbreeding coefficient (FIS) is low in each of the populations, our analyses show that FIS reaches its highest statistically significant value in the LH population that inhabits the smallest and most isolated forest complex (Fig. 1, Tables 1 and 4). Mating between related individuals must therefore be taking place in this population.
The results of FST-estimated genetic differentiation between pairs of populations correspond to the geographic distribution of individual populations, that is, individuals from small isolated populations (MF and LH) are clearly genetically different from each other and from dormice from a large contiguous forest complex, indicating limited gene flow between populations. In contrast, those dormice whose populations live in the extensive Strzelin Hills forest complex (K, N, ZC) differ from each other to a much lesser degree suggesting a greater degree of gene flow between them (Fig. 1). The genetic similarity and “mixing” of individuals from populations within the large contiguous forest complex and the genetic distinctiveness of the two isolated populations are supported by the results of PCA and DAPC (Figs. 2 and 3).
The impact of habitat fragmentation on the genetic structure of the edible dormouse has been studied in recent years by Herdegen et al. (2015) and Fietz et al. (2014). Herdegen et al. (2015), who conducted a study in Poland, found that populations from the most fragmented northwestern part of the country were characterized by extremely limited gene flow and low genetic diversity compared to less fragmented populations from southern Poland. Of the three regions studied, AR was lowest in the region of northwestern Poland (1.41) versus 2.84 in southeastern and 2.25 southwestern Poland, which had the smallest habitat patches and the lowest connectivity. The reported pairwise FST values were approximately five times higher in northwestern Poland than in the other regions (0.53 vs. 0.10 and 0.07), that is, despite their geographical proximity, populations from northwestern Poland showed higher genetic differentiation caused by fragmentation of their habitats. Faced with the finding of no signatures of recent genetic bottlenecks in these populations, the authors concluded that the scenario of a slow, long-term process of loss of genetic diversity due to habitat fragmentation is becoming a real threat to the species.
A microsatellite-based study by German researchers (Fietz et al. 2014), in four different forest fragments and one large continuous forest, also showed that dormice inhabiting the forest fragments were isolated from each other and their genetic structure was less stable than in the large continuous forest—genetic variability in all populations studied was low (average HO = 0.41 and HE = 0.42). As interpreted by the authors, ecological factors such as demographic or environmental stochastic events, have resulted in loss of allelic diversity and inbreeding, increasing risk of extinction.
Somewhat surprising are our results obtained using the STRUCTURE program. This analysis was conducted for different values of K (from K = 1 to K = 5). The highest values of ∆K indicate the existence of two distinct dormouse populations—one consists of individuals from both isolated small forest complexes, the other containing individuals inhabiting the large contiguous forest complex (Fig. 5). This finding is not consistent with the results of PCA and DAPC, however. That these dormice represent only two different genetic groups—(MF + LH) and (K, N, ZC)—may be explained by the fact that both small forest complexes (MF and LH) probably were once part of a larger forest complex, but separate from the K, N, and ZC populations. Therefore, the scenario cannot be ruled out that, in the distant past (before the arrival of humans in the area about 900 years ago), there was a very large forest complex in the study area, which gradually fragmented as a result of human activity, especially in areas suitable for human use. Historical sources make reference to intensive forest clearances in the region. Given the proximity of the navigable River Oder, fertile soils, and extensive forests, the rapid human colonization of this region began as long ago as the mid-12th century (Adamska et al. 2017). Forests in the Strzelin Hills (i.e., those still forming a fairly compact forest complex, 10 km wide and about 22 km long) grow in an area that is unsuitable for cultivation because the hills, though not high (relative height 180–220 m), have steep slopes.
Anthropogenic changes in forest distribution, and their effect on the genetic structure of edible dormice, across a large part of their Palearctic distribution demonstrate a strong and complex geographical structure formed after postglacial recolonization, suggesting that fragmentation occurred in several steps, gradually splitting the ancestral population into peripheral isolated populations (Michaux et al. 2019). The authors suggested that this structure supports the hypothesis that the differentiation was recent, starting around 9,000 years ago.
An interesting conclusion to be drawn from these analyses is that the low genetic diversity of dormice cannot be said to be accompanied by elevated inbreeding coefficients. The relatively low values of FIS in dormice from these populations may have resulted from a multiple mating system (polyandry) in G. glis (Weber et al. 2018; Moska et al. 2021), which may be a protective mechanism against inbreeding.
Results of the Mantel test indicate that the observed genetic structure of dormice is mediated by the distance between the populations to a significant extent. The aforementioned locomotory limitations of dormice in forest-free areas appear to explain the results. A study conducted in Thuringia (Germany), which explored the ability of these rodents to move between 10 forest complexes separated by distances from 20 to 1,000 m, found that they were only capable of moving between forests from 20 to 270 m apart, and that those living in isolated forest complexes surrounded by farmland stretching for many kilometers were incapable of moving between patches (Worschech 2012). The forest complexes we analyzed were from 4 to 5.9 km apart, and indications are that dormice are unable to cover such distances on the ground. Hence, we can almost certainly anticipate a continuous decline in the heterozygosity of such populations as a result of inbreeding, and a further deterioration in the genetic condition of the individuals forming them. According to Fietz et al. (2014), genetic isolation can be a precursor to genetic erosion and inbreeding depression, which can limit or even prevent the long-term viability of dormice inhabiting forest fragments. Tucker et al. (2018) point out that, in conservation terms, it is crucial to sustain landscape connectivity by maintaining corridors connecting areas of natural habitat enabling mammals to move across the landscape. Knowledge of functional connectivity, that is, gene flow patterns, between populations is essential for managing endangered species (Statham et al. 2022). Maintaining wooded connectivity between the fragmented habitats of endangered species is, as the present example of the edible dormouse shows, a key aspect of their conservation. Land-use planning and policies have to find a balance between the needs of humans and those of wildlife (Tucker et al. 2018).
In conclusion, it is important to remember that not all species are as susceptible to the negative impacts of habitat fragmentation as the Edible Dormouse. Thus, before making recommendations for species conservation management within a fragmented landscape, one must consider the characteristics of individual species such that those predicted to be most susceptible can be prioritized (Weins 1997; O’Grady et al. 2004; Viveiros de Castro and Fernandez 2004; Meyer et al. 2009).
Acknowledgments
We thank the employees of the Henryków Forestry District for their help with the fieldwork.
Conflict of Interest
The authors declare that they have no conflict of interest.
Funding
The article publication cost was financed by the Wroclaw University of Environmental and Life Sciences.
Author Contributions
MM conducted fieldwork, data collection, methodology, laboratory analyses, writing, and original draft preparation; AM performed statistical analyses, and visualization; HW contributed to methodology, writing, original draft preparation, review, and editing; BN assisted with fieldwork.
Data Availability
In our study, we used data that are not archived in publicly available repositories (they are available from the study authors).
