


Abstract
Obesity is a global pandemic associated with several comorbidities, such as cardiovascular diseases and type 2 diabetes. It is also a predisposing factor for infectious diseases, increasing mortality rates. Moreover, diet-induced obesity can cause metabolic fluctuations that affect macrophage differentiation in various organs. In this sense, we investigated how bone marrow-derived macrophages and tissue-resident macrophages in the skin, which have been differentiated in a host with metabolic syndrome and with previous inflammatory burden, respond to Leishmania major infection. Our findings suggest that bone marrow-derived macrophages from obese C57BL/6 mice, even when cultivated in vitro with inflammatory stimuli, are more susceptible to L. major. These macrophages produce less tumor necrosing factor (TNF) and nitric oxide (NO) and show higher arginase activity. Furthermore, obese mice infected with an intermediate dose of L. major in the skin had more severe lesions when analyzed for ulceration, diameter, thickness, and parasite burden. The increase in lesion severity in obese mice was associated with a higher frequency of tissue-resident macrophages, which are less efficient in killing parasites. We also used CCR2−/− mice, which predominantly have tissue-resident macrophages, and found that lesion resolution was delayed in association with CCR2 deficiency. Additionally, obesity potentiated tissue damage, resulting in higher frequency of tissue-resident macrophages. Our results demonstrate that obesity can alter macrophage responses to infection, leading to increased susceptibility to L. major and more severe cutaneous leishmaniasis. These findings may have important implications for managing obesity-related infections and the development of new therapies for cutaneous leishmaniasis.
Key Concepts
Obesity alters macrophage differentiation, increasing CD206 expression.
Macrophages from obese mice exhibit a mixed inflammatory profile and produce less NO and arginase upon L. major infection.
Obese C57BL/6 mice are more susceptible to L. major, likely due to increased expansion of resident macrophages expressing CD206.
Open Questions
How does the chronic inflammatory profile characteristic of obesity impair macrophage function?
Does chronic obesity impact trained immunity in myeloid and lymphoid cells?
What is the source of the resident macrophages in obese mice?
1. Introduction
Obesity has become a global pandemic, associated with a myriad of comorbidities such as cardiopathies, type 2 diabetes, and cancer.1 Moreover, it serves as a predisposing factor for numerous infectious diseases, thereby heightening the overall mortality risk.2 The disruption of homeostasis commonly observed in obesity leads to alterations in adipose tissue (AT), characterized by significant monocyte migration to the organ and further differentiation into macrophages that, in this context, often assume an inflammatory profile.3,4 During obesity, an increase in the proportion of inflammatory macrophages relative to tissue-resident macrophages (TRMs) in healthy tissues contributes to the systemic state of low-grade inflammation.5
Obesity is frequently recognized as a risk factor for various infections,6 exacerbating their severity and heightened host susceptibility to diseases such as SarsCov2,7 Chagas disease,8 H1N1,9 schistosomiases,10 and leishmaniasis.11,12 Despite this well-established association, the specific cellular mechanisms underlying this phenomenon remain to be elucidated.
Macrophages are highly susceptible to metabolic alterations induced by obesity. Recent research has highlighted the remarkable adaptability of various macrophage subpopulations in AT to metabolic shifts.13,14 Obesity-induced changes, including hyperglycemia, hyperlipidemia, and increasing free fatty acids (FFA), can significantly alter the signature of macrophages, impairing vital functions such as endocytosis and collagen deposition.15,16 While alterations in the AT environment are well-documented, the impact of chronic metabolic fluctuations on the differentiation of monocyte-derived macrophages and TRMs in other tissues remains poorly understood. Unlike monocyte-derived macrophages, TRMs exhibit a more pronounced homeostatic profile and display variable origins depending on the specific organ.17 These cells are characterized by their heterogeneity and fulfill tissue-specific roles, in addition to general functions such as tissue repair, capturing blood molecules, and phagocytosis of apoptotic bodies.18 For instance, in the skin, resident perivascular macrophages expressing the mannose receptor (CD206) are involved in maintaining homeostasis by detecting and responding to pathogens. TRMs are among the initial immune cells to encounter invading microorganisms such as Leishmania major.19 They serve as an interface with the external environment. However, the response to pathogens in a host with preexisting inflammation and metabolic syndrome remains unclear.
In murine infection with the parasite L. major, macrophage responses are extensively studied. For effective parasite clearance, macrophages need to be activated under robust inflammatory conditions, leading to the production of nitric oxide (NO) and TNF, which are crucial for parasite elimination. In vitro activation of macrophages with lipopolysaccharide (LPS) and interferon gamma (IFN-γ) (M1) followed by infection with L. major results in efficient parasite control. Conversely, cells activated with IL-4 (M2) were permissive for intracellular parasite growth.20 Within the spectrum of resolution/susceptibility, studies using bone marrow-derived macrophages (BMDMs) suggest that stimuli associated, with obesity, such as high glycaemia, could induce an intermediary profile of inflammation, distinct from the classic M1/M2 polarization, where macrophages produce low levels of TNF, at the same time produce IL-10 and express mannose receptor CD206.21,22 Also, their phagocytic capacity is deficiently in cases of sustained high glucose exposure.16,23 Nevertheless, the behavior of these macrophages in conditions of heightened inflammation remains poorly understood. Thus, we aimed to investigate the response of macrophages differentiated under conditions of obesity to L. major infection, both in vivo and in vitro.
In a previous study, we established that L. major infection in obese C57BL/6 mice led to compromised resistance, heightened parasite burden, and exacerbated tissue damage compared to control mice. Here, our objective was to elucidate the underlying mechanisms behind the increased susceptibility of obese mice to infection and the role of macrophages in this context. The findings presented in this study shed light on the relationship between obesity and impaired immune response, thus predisposing individuals to infection. Furthermore, our results emphasize the pivotal role of TRMs in the progression of L. major infection in obese C57BL/6 mice, underscoring the necessity for further investigation into their role in disease pathogenesis to identify potential targets for immunotherapy.
2. Materials and methods
2.1 Mice and diet
Male C57BL/6 mice, 4 to 6 weeks old, with an average initial weight of 20 g were housed in an animal care facility at the Universidade Federal de Minas Gerais (UFMG) and provided ad libitum access to water and food. The study was conducted following the ethical standards and approved by the Ethics in Animal Use Committee (CEUA) of UFMG under submission protocol number 338/2012. C57BL/6-CCR2-/RFP mice were generously provided by Dr Gustavo Menezes and were subsequently paired with their respective wild-type controls. To induce obesity, mice were fed a hypercaloric diet rich in lipids (butter) and simple carbohydrates (refined sugar) (high-sugar butter, HSB),24 while control mice received an isocaloric diet (AIN93-G)25 throughout the experimental period.
2.2 Measurement of body weight and metabolic parameters
The mice underwent weekly monitoring of body weight and glycemia. Following 12 weeks on the hypercaloric diet (HSB), fasting blood glucose levels were assessed using a capillary glucometer (Accu-Chek Active; Roche, Basel, Switzerland). For the glucose tolerance test (GTT), animals underwent a 12-h fasting period. After a 12-h fasting period, mice were administered 2 g of glucose per kilogram of body weight. Blood samples were obtained from the tail vein, and glucose concentrations were measured in milligrams per deciliter using a glucometer and strips (Accu-Chek Active) at 15-, 30-, 60-, and 90-min intervals thereafter.
To determine the adiposity index, the mice were weighed at the time of euthanasia. The epididymal, inguinal, and mesenteric AT were dissected and removed. The weight of each tissue was measured individually, and the adiposity index was calculated using the following formula: adiposity index = (weight of AT*100) / body weight.
2.3 L. major cultivation, metacyclic promastigotes isolation, infection, and lesion measurements
L. major (WHO MHOM/IL/80/Friedlin) parasites were cultured in Grace's culture medium (GIBCOBRL—Life Technologies, Grand Island, NY, MO, USA) with a pH of 6.2, supplemented with 20% fetal bovine serum (GIBCO), 20 μg/ml of gentamicin sulfate (Schering-Plough—Rio de Janeiro, RJ, Brazil), and 2 mM of L-glutamine (GIBCO), and kept at 25 °C. Additionally, parasites expressing red fluorescent protein (RFP) (L. major-RFP) were cultured in complete medium 199 (GIBCO) supplemented with 0.01% geneticin (GIBCO), which was kindly provided by Dr David Sacks (NIAID, NIH, Bethesda, USA). Metacyclic promastigotes were isolated from stationary phase cultures (5-d cultures in our conditions) as previously described.26
Mice were infected with 2 × 10⁵ metacyclic L. major promastigotes in 10 µl of phosphate-buffered saline (PBS) injected into the ear dermis, 12 weeks after initiation of the dietary regimen. At this stage, obesity and metabolic syndrome were well established (Fig. 2B). Mice were euthanized 2 d, 2, 4, and 8 weeks after infection. Noninfected control animals received an equivalent volume (10 μl) of PBS, injected into the left ear. Lesions were measured weekly using a digital micrometer (Starret, São Paulo, Brazil) with lesion sizes calculated by subtracting the thickness of the noninfected ear from the values obtained for the infected ear. Lesion diameters were also measured.
2.4 BMDM generation, in vitro treatment, and infection
Isolated femurs and tibia were flushed with PBS, and precursor cells were cultured in complete Roswell Park Memorial Institute (RPMI) medium supplemented with 30% L929 cell–conditioned medium, as previously described.27 After 7 days of culture, mature BMDMs were stimulated as follows: M1:100 ng/ml IFN-γ (BD Pharmingen, San Diego, CA, USA) and 50 ng/ml LPS (InvivoGen, Toulouse, France); M2:20 ng/ml IL-4 (Peprotech, Rocky Hill, NJ, USA); MMe: glucose (30 mM), palmitate (0.4 mM), and insulin (10 nM) (Peprotech).21 Cell cultures were prepared by plating 2 × 10⁵ BMDMs/well in a 24-well plate (Thermo Fisher Scientific, Waltham, MA, USA) on a coverslip in complete RPMI and infecting with metacyclic promastigotes at different multiplicities of infection (MOIs).
After 4 h of infection, BMDMs were washed with 37 °C PBS to remove free parasites and further incubated in complete RPMI. Subsequently, the cells were fixed and stained to count the internalized parasites, which served as phagocytosis controls. For the remaining time points (24 and 72 h), fresh complete RPMI medium was added with or without the stimuli (M1, M2, and MMe), as described previously. The coverslips were stained using the fast Panoptic hematological staining system (Laborclin, Pinhais, PR, Brazil), and the infection index was determined by counting at least 300 cells per sample to quantify the number of infected macrophages and amastigotes. The results were expressed as an infection index, calculated by multiplying the percentage of infected cells by the number of amastigotes and then dividing by the total number of cells.
Additionally, after 24 h of incubation, the supernatant was collected for the nitric oxide assay and TNF-alpha measurement by ELISA. After 48 h, we conducted an arginase activity assay, and the supernatant was collected for IL-10 measurement by ELISA. For TNF and IL-10 concentration measurement, the Elisa technique was performed according to the manufacturer's instructions (R&D Systems, MTA00B—TNF; DY417-05-IL10 Minneapolis, MN, USA).
2.5 Reactive oxygen species detection
To assess reactive oxygen species (ROS) production by macrophages, luminometric assays were conducted. Macrophages were obtained as previously described and suspended in RPMI medium without phenol red. One million cells were seeded into each well of an opaque 96-well plate (NUNC, Rochester, NY, USA). Subsequently, 0.05 mM luminol (5-amino-2,3-dihydro-1,4-phthalazinedione; Sigma-Aldrich), 50 U/ml IFN-γ (BD), 100 ng/ml LPS (InvivoGen), and L. major metacyclic promastigotes in a 10:1 ratio (parasites: macrophages) were added to each well. Zymosan particles, at a concentration of 107 particles/in 50 µL, were used as a positive control for ROS production. Readings were taken for 90 min at 2-minute intervals. ROS production was quantified in relative light units, representing the area under the curve generated during the reaction between ROS and luminol.28
2.6 Arginase activity
Arginase activity in BMDMs was assessed 48 h after infection, using a previously described protocol29 with slight modifications.30 Results were quantified as micromoles of urea produced per minute. A standard curve was generated by serial dilution of urea, with the limit of detection set at 270 µL. Absorbance was measured at 540 nm using a spectrophotometer (Microplate Spectrophotometer System, model SPECTRAmax 340; Molecular Devices, Sunnyvale, CA, USA).
2.7 Nitric oxide assay
To quantify nitric oxide, culture supernatants of the macrophages were collected 24 h after in vitro infection. The amount of nitric oxide production was assessed by measuring nitrite concentration in the culture supernatant using the Griess reaction.31 Briefly, 50μl of the supernatant was added to a 96-well plate, along with sodium nitrite standard (250 μM) serially diluted (1:2) in subsequent wells. Subsequently, 100 μl of Griess reagent was added to all wells, and the plate was kept in the dark for 10 min. Optical density was measured using a spectrophotometer.
2.8 Quantification of parasites in the ear
After euthanasia, infected ears were aseptically collected and placed in sterile tubes. Tissue homogenization was performed in PBS, as described previously.32 The parasite burden was assessed by serial dilution of 1:10 in 96-well flat-bottom plates containing M199. The number of viable parasites was determined from the highest dilution at which parasite growth was observed after 10 d of incubation at 26 °C. Results were expressed as the mean values of the negative logarithm of the titer.
2.9 Cell isolation of ear, spleen, AT, and liver
Ear tissues were prepared as previously described.33 Briefly, the ears were extracted, excess hair was removed, and the ears were immersed in 70% ethanol for 3 min. Subsequently, the ears were divided into 2 portions (ventral and dorsal) and placed in individual wells of a 24-well-plate. The first incubation was carried out with RPMI solution containing 62.5 μg/ml of Liberase TL (Roche, Indianapolis, IN, USA) to facilitate the dissociation of collagen-rich tissue. The ears were then incubated in a CO2 incubator for 1 h and 30 min at 37 °C with constant agitation. Following incubation, the reaction was halted using RPMI medium supplemented with 5% fetal bovine serum and 0.05% deoxyribonuclease I (Sigma-Aldrich). The tissue and liquid were transferred to a 6-well plate, and the ears were further homogenized using a 50 μm cell filter (Sigma-Aldrich); the homogenate was maintained on ice. Cells were collected in 15 ml conical tubes and centrifuged for 10 min at 1,200 g in a refrigerated centrifuge at 4 °C. The pelleted cells were resuspended in a RPMI medium.
The spleens were processed as previously described.34 Briefly, the spleens were harvested and minced in RPMI. Cell suspensions were homogenized and centrifuged at 500 g for 10 min at 4 °C. Splenic red blood cells were lysed with water, and the osmolarity was adjusted with 10-fold concentrated PBS. The cells were centrifuged again and resuspended in the RPMI medium.
For the extraction of cells from AT, the procedure followed previously described modifications.35 The AT was chopped into small pieces, and 2 ml of the collagenase solution containing RPMI, 2 mg/ml of collagenase type II (Sigma-Aldrich), and 150 μg/ml of deoxyribonuclease I (Sigma-Aldrich). The minced tissue was subjected to vigorous agitation at 37 °C for one hour. The homogenate was then aspirated using a syringe and expelled through a needle (22G), to remove the adipocytes. Subsequently, the homogenate was filtered through a 100 μm cell filter and placed in 50 ml conical tubes. Any remaining material on the filter was washed with RPMI medium containing 5% fetal bovine serum (FBS). The tubes with the solutions were centrifuged at 500 g for 10 min at 4 °C. The fat layer remained in the supernatant, whereas leukocytes remained in the pellet. The supernatants were gently aspirated and discarded. Finally, the pellet was collected, the homogenate was transferred to 15 ml conical tubes, and the total volume was adjusted with RPMI plus 5% FBS to 2 ml. Tubes were centrifuged for 10 min at 1,200 g at 4 °C. The cells that remained sedimented were resuspended in RPMI medium.
The livers were processed as previously described.36 After perfusion, the liver was harvested and fragmented into small pieces. These fragments underwent enzymatic digestion with collagenase VII (1 mg/ml, Sigma-Aldrich) in RPMI for 60 min in constant agitation at 37 °C. Subsequently, liver homogenates were filtered using a 70 µm cell strainer to remove undigested tissue. A series of differential centrifugation steps followed, including centrifugation at 400 g 5 min, 60 g 3 min, and 400 g 5 min. Finally, the red blood cells were lysed with 1 × red blood cell lysis buffer (BD Biosciences). The cells that remained sedimented were resuspended in RPMI medium.
For all organs, the viable cells were quantified by counting in a Neubauer chamber with 0.4% trypan blue.
2.10 Flow cytometry, antibodies, and fluorescent conjugates
After centrifugation and resuspension in RPMI medium, cells from the respective organs were washed with PBS containing 0.5% bovine serum albumin (BSA) (PBS-wash) and then incubated with Fc-block (antiCD16/32; BD Biosciences) on ice for 30 min. Following another round of washing and centrifugation, the cells were stained with 20 µl of various combinations of surface antibodies. For intracellular labeling of KI67 and Arginase 1, a commercial fixation/permeabilization kit (e-Bioscience) was utilized, and the samples were incubated for 30 min with antibodies. After washing with PBS–BSA (0.5% BSA), the samples were acquired using either FACSCanto II or FACSFortessa (BD Biosciences) using the FACsDiva software. Populations of interest were identified by size and granularity (Forward Scatter × Side Scatter), and gating strategies were determined using unstained cells and fluorescence minus one (FMO) samples.
Fluorescent-dye-conjugated monoclonal antibodies used were: anti-mouse CD45 103108, FITC (30-F11); antimouse CD11b, 12-0112-82, PE (M1/70); anti-mouse CD11b (M1/70), 101223, Pacific blue (M1/70); anti-mouse Ly6G, 561105, FITC (1A8); anti-mouse Ly6G, 563005, BV605 (1A8); anti-mouse Ly6G, 127607, PE (1A8); anti-mouse Ly6C, 560525, Percp5.5 (AL-21); anti-mouse F4/80, 123114, PeCy7 (BM8); anti-mouse CD36, 552544, PeCy7 (CRF D-2712 RUO); anti-mouse Ki-67, 652421 Pacific Blue (16A8); anti-mouse Ki-67, 652417 AF488 (16A8); anti-mouse CD206 (MMR), 141708, APC (C068C2), anti-mouse I-A/I-E (MHCII), 107627, APC-cy7 (M5/114.15.2); anti-mouse Arginase 1, 56-3697-82, Alexa Fluor700 (A1exF5); anti-mouse CD11c, 561241, APC-cy7 (HL3); anti-mouse CD11c, 117329, BV421 (N418); LIVE/Dead TM Fixable Aqua Stain Kit, L34957.
2.11 Intravenous injection of FITC-dextran
TRMs are strategically positioned near blood vessels, enabling them to efficiently uptake macromolecules from the bloodstream. Particularly, these macrophages have a propensity for capturing dextran molecules. To assess the endocytic capacity of this macrophage subset via flow cytometry, mice were intravenously administered 18 mg/kg FITC-dextran (Sigma-Aldrich) and euthanized after 30 min. The mean fluorescence intensity (MFI) of FITC was then quantified using flow cytometry, providing a measure of fluorescence expression in spleen and ear cells and reflecting their endocytic activity.
2.12 Cell sorting and monocyte transfer
Blood and spleen samples were obtained from both healthy and obese C57BL/6 mice and processed accordingly. Spleens were homogenized, and cell suspensions were centrifuged at 500 g for 10 min at 4 °C. Blood was collected in heparinized tubes via cardiac puncture. The blood cells were isolated by adding Histopaque 1083 (Sigma-Aldrich), and centrifuged at 500 g for 25 min at room temperature without braking. Red blood cells were lysed using 1 × red blood cell lysis buffer (BD). Following this, the cells were centrifuged and resuspended in a complete RPMI medium. CD11b+LY6G−Ly6C+ monocytes were sorted using cell sorting on the FACSAriaII (BD Bioscience), and 1 × 10⁶ cells were injected intravenously according to the following scheme: Control group (CTL) → Obese group (OB) and OB → CTL; after 2 wk of L. major infection.
3. Results
3.1 BMDMs from obese C57BL/6 are more susceptible to L. major infection in vitro
Our earlier research revealed that obese mice infected with L. major exhibit more severe lesions than control mice. Additionally, our in vitro studies suggested that peritoneal macrophages from obese hosts displayed heightened susceptibility to infection.11 To delve into the impact of an obesogenic environment on macrophages, we infected BMDMs from obese and control mice. This methodology allowed us to investigate the influence of obesity on macrophage differentiation, phenotype, and function.
Initially, we examined M-CSF-induced BMDMs obtained from both control and obese mice in the context of L. major infection. Our results showed similar replication rates of Leishmania parasites in nonstimulated BMDMs from both groups (Fig. 1A). It is well-established that macrophages treated in vitro with LPS and IFN-γ exhibit efficient parasite clearance. At the same time, IL-4 stimulation does not confer protection against L. major infection, as previously noted. In M1-polarized macrophages derived from the obese hosts, we observed a 2-fold increase in the percentage of infected cells at 24- and 72-h postinfection compared to M1-BMDMs in the control group (Fig. 1B). Additionally, these cells exhibited reduced parasite-killing efficiency, as indicated by a higher mean number of amastigotes per infected cell (Fig. 1B). The lack of protective response observed in infected M1-BMDMs from obese mice correlated with decreased NO production (Fig. 1D) and decreased TNF production (Fig. 1E).
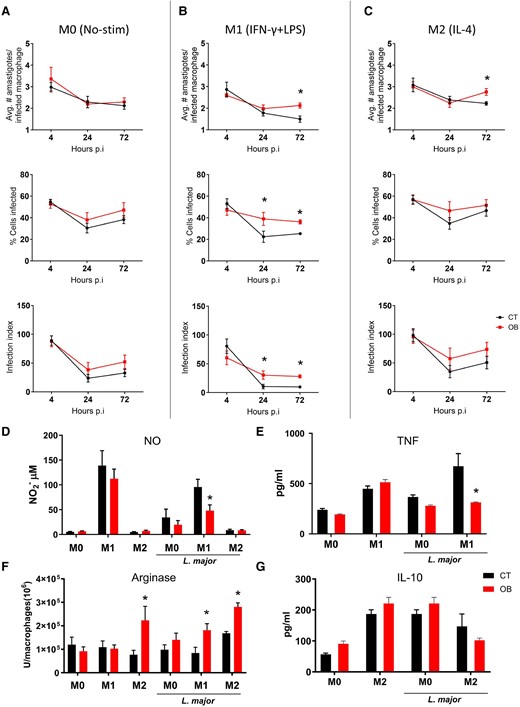
Bone marrow-derived macrophages from mice with obesity exhibit increased susceptibility to L. major infection under different stimuli. Macrophages were derived from the bone marrow of mice with obesity and subjected to different stimuli: M0, macrophages without any stimulation; M1, macrophages stimulated with LPS (100 ng/ml) and IFN-gamma (10 ng/ml); and M2, macrophages stimulated with IL-4 (10 ng/ml). The cells were then incubated with L. major at a ratio of 1:5 on a glass coverslip for 4, 24, and 72 h. The mean number of amastigotes per infected macrophage, mean number of infected cells, and infection index were evaluated by light microscopy after collecting the coverslips and quick staining with Panoptic. A) M0; B) M1; C) M2. D) Nitrite production was measured in the supernatant of macrophage cultures after 24 h of stimulation with IFN-gamma and LPS or IL-4, in the presence or absence of L. major, using the Griess method. E) TNF-alpha concentration was measured in the culture supernatant after 24 h of infection by ELISA. F) Arginase activity was evaluated in macrophages stimulated with IFN-gamma and LPS or IL-4, infected or not with L. major. G) IL-10 concentration was measured in the culture supernatant after 48 h of infection by ELISA. Results from two independent experiments, with n = 3 mice per experimental time/per experiment. Data are represented as mean ± SEM. *P < 0.05; statistical analysis was performed by multiple unpaired Student's t-test between the control (CT) and obese groups (OB) at each time point of infection.
Upon analyzing M2-BMDMs from obese mice, we noted a higher parasite load per infected macrophage 3 d after infection compared to that in control M2-BMDMs (Fig. 1C). Additionally, we assessed the activity of arginase, an enzyme produced by IL-4-stimulated macrophages that facilitates L. major replication, in BMDMs. Interestingly, without infection, IL-4 stimulation alone was sufficient to increase arginase activity in BMDMs from obese mice. Furthermore, infection of M0- and M1/M2-polarized BMDMs from obese mice resulted in increased arginase activity compared to that in their control counterparts (Fig. 1F). Notably, no significant differences in IL-10 production were observed when the culture supernatant was evaluated at 48 h postinfection (Fig. 1G). Additionally, using a model that simulates the metabolic conditions of obese patients in which BMDMs from control lean mice were incubated with glucose, insulin, and palmitate (MMe),21 we noticed that MMe-activated BMDMs were less effective in killing parasites than M1 macrophages (Supplementary Fig. 1). After 72 h of infection, metabolically activated macrophages showed a response similar to that of the unstimulated group (M0), with similar percentages of infected cells (Supplementary Fig. 1A), and similar average numbers of amastigotes per infected macrophage (Supplementary Fig. 1B). Moreover, MMe-activation did not increase the production of leishmanicidal molecules such as TNF (Supplementary Fig. 1D) and ROS levels (Supplementary Fig. 1D).
Collectively, these data indicated that BMDMs from obese mice exhibited an inadequate inflammatory response against L. major infection in vitro. Furthermore, the increase in arginase activity and reduced production of nitric oxide and TNF under various stimuli align with enhanced parasite survival.
3.2 Obesity impairs resistance of C57BL/6 against L. major infection
The in vitro experiments revealed that macrophages from obese mice may be more susceptible to infection, which led us to investigate the phenotype of macrophages in the context of in vivo infection, considering the complexity of the lesion microenvironment. C57BL/6 mice were fed a high-sugar, high-fat diet for 12 weeks, which resulted in substantial weight gain (Fig. 2A), elevated epididymal AT weight (Fig. 2B), elevated fasting blood glucose levels (Fig. 2C), and reduced glucose tolerance as determined by GTT (Fig. 2D). The mice were then infected intradermally with an intermediate dose (2 × 10⁵) of L. major metacyclic promastigotes in the ear. The course of the infection was monitored for up to 14 weeks. While lesions in control mice peaked around the sixth week and recovered naturally over time, obese mice exhibited progressively growing lesions that eventually ulcerated and worsened considerably after 8 weeks of infection. The severity of the obesity-associated lesions was evident by measuring the diameter (Fig. 2E), thickness (Fig. 2F), and pathological score (Fig. 2G), which accounted for tissue damage and ulceration. In some cases, the auricular tissue was destroyed and the parasite disseminated to the spleen (data not shown). Parasite burden measurements over the weeks confirmed that control mice exhibited a reduction in lesions concomitant with a reduction in parasite burden, whereas HSB-fed mice were unable to control ear parasitism after 8 wk of infection (Fig. 2H). Interestingly, after 8 weeks of infection, the lesion size was positively correlated with body weight (Supplementary Fig. 2A), and fasting blood glucose levels (Supplementary Fig. 2B).
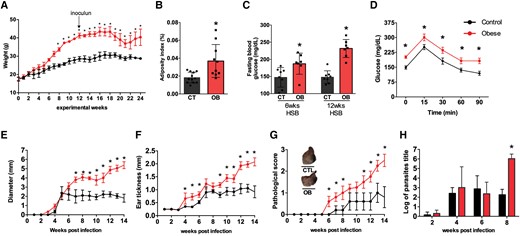
Mice with diet-induced obesity show more severe lesions and higher parasite load when infected with L. major. C57BL/6 mice were fed a standard AIN93-G diet or a high-sugar and high-fat (HSB) diet for 12 wk before being infected with 2 × 10⁵ L. major metacyclic promastigotes in the ear. A) Mean body weight of mice over 25 wk of the experiment; B) Adiposity index expressed as the sum of epididymal, inguinal, and mesenteric AT weights divided by body weight at the end of the experiment; C) Fasting blood glucose levels; D) Oral GTT performed after 12 wk of diet consumption. Lesion measurements: E) Diameter, F) Thickness, and G) Pathological score (0, without ulceration; 1, with ulceration; 2, mild tissue damage; and 3, severe tissue damage). H) Parasite load in the ears of mice 2 d; 2, 4, and 8 wk after infection. Results represent the mean of 2 independent experiments (n = 3–5/each experiment), and bars indicate the mean and SD. Statistical significance was determined by Two-Way ANOVA between the CT (AIN93-G) and obese (HSB) groups, *P < 0.05.
3.3 Characterization of resident macrophages population in different tissue upon obesity
As previously described,37 naive C57BL/6 mice present a range of innate immune cells in the ear dermis, which can be categorized based on their cell origin. These populations can be defined using markers such as CD11b, CD64, Ly6C, and MHC II, which can efficiently distinguish between cells derived from bone marrow progenitors and resident populations of macrophages and dendritic cells (DCs). Other studies have employed other cell markers, such as the mannose receptor, to characterize these cells in the steady-state dermis38 and in a model of L. major infection.39
To assess the cellular composition of the ear skin, we specifically selected CD11b+ cells, excluding neutrophils, based on the expression of Ly6C and CD206 receptors (Supplementary Fig. 3). Using this approach, we identified four distinct myeloid populations (P1 to P4) (Fig. 3A) that were previously characterized by Lee et al.39 Among these populations, dermal TRMs (P4) were notable for their high expression levels of CD206 (Fig. 3B), arginase (Fig. 3C), and CD36 (Fig. 3D) and low proliferation rate (Fig. 3E) under steady-state conditions in control mice. In addition, we observed that obesity increased the expression of CD206 in the wite adipose tissue (WAT), spleen, and liver (Supplementary Fig. 4).
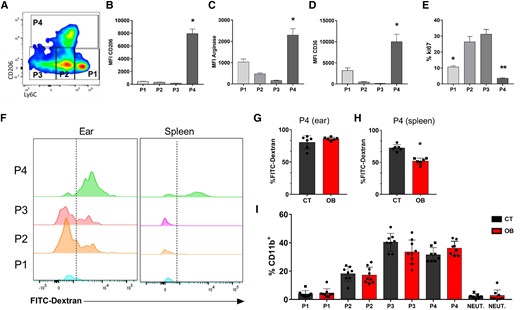
TRMs characterization and frequencies of P1 to P4 in the skin of CT and obese mice. C57BL/6 mice were fed for 12 wk with the AIN93-G or HSB diet. At the end of this period, cell populations were evaluated by flow cytometry. A) Dot plot representative of monocytes (P1), Mo-DCs (P2), Mo/DermalDCs (P3), and TRMs (P4). MFI for expression of (B) CD206; C) Arginase, and D) CD36 in the indicated ear populations (P1 to P4); E) Ki67 expression. The mice were injected with FITC-DEXTRAN (18 mg/kg) intravenously, anesthetized, and euthanized 30 min after the injection. The endocytic activity was assessed by measuring FITC fluorescence. By flow cytometry (F) Measurement of the endocytic capacity of P1 to P4 in the ear and spleen of CT and obese (OB) mice; G) % of cells with FITC-Dextran in P4 in the ear; H) % of cells with FITC-Dextran in P4 in the spleen. I) Frequencies of myeloid cells subpopulations (P1 to P4 and neutrophils) in the ear of CT and obese animals. Representative results from 2 independent experiments. n = 3–5 mice/experiment for (A to E). Data represented by mean ± SEM. Statistical analysis was performed by One-way ANOVA with Turkey's posttest *P < 0.05. n = 6 mice/group for (F to H). Data represented by mean ± SEM; *P < 0.05; Statistical analysis was performed using the unpaired Student's t-test. n = 3–5 mice/experiment for (I). Results combining three independent experiments. Data represented by mean ± SEM. Statistical analysis performed by the One-way ANOVA test followed by Turkey.
To track TRMs, we employed an intravenous injection of FITC-dextran, capitalizing on its robust endocytic activity, as dextran is efficiently internalized by TRMs. This specific population displayed an efficient uptake of the polymer within 30 min postinjection (Fig. 3F). Interestingly, while ear macrophages from both control and obese exhibited similar and rapid uptake of FITC-dextran (Fig. 3G), CD206+ macrophages from the spleens of obese mice exhibited impaired endocytic capacity (Fig. 3H). Additionally, in the ears, both the obese and control mice exhibited comparable frequencies of these cells under noninfected conditions (Fig. 3I).
3.4 Obesity alters the frequency of resident macrophages at the ear after 8 weeks of infection
Next, we investigated whether L. major infection in obese mice could affect the dynamics of myeloid populations throughout the infection. To further explore this, we analyzed neutrophils, monocytes (P1), Mo-DCs (P2), Mo/DermalDCs (P3), and TRMs (P4) during infection (Fig. 4). First, we verified that the number of total CD11b+ cells increased in both groups over time; however, at the fourth and eighth weeks of infection, obese mice showed a higher number of cells infiltrating the lesion (Supplementary Fig. 5A). An increase in CD11b+ cells in the ear occurred, even when considering a similar number of circulating monocytes in the blood (Supplementary Fig. 5B to D). 2 d after infection, we verified that obese mice presented ∼ 2-fold fewer Ly6G+ neutrophils than control mice. After this initial wave, we still observed neutrophils in both groups, but at low and comparable levels. In the context of L. major infection, we noted a considerable increase in the migratory monocyte population (P1) 2 d after inoculation, indicating intense migration in both groups. At this acute time point, migratory monocytes, along with neutrophils, constituted the most frequent cells. Throughout the infection, the frequency of the Mo-DCs (P2) remained similar in both groups, except in the eighth week, where control mice were found to have a higher frequency of these cells when compared to the obese group (Figs. 4 and 5A). After 14 d of infection, we observed an increase in Mo/DermalDCs (P3) in both groups, which coincided with the beginning of the adaptive immune response. After this period, the frequency of DCs in the control mice slightly increased before the eighth week postinfection, while we observed an opposite trend in the obese mice. The reduction in DCs coincided with the concomitant expansion of TRMs expressing CD206 (P4) in obese mice (Fig. 4). Interestingly, this increase in the number and frequency of TRMs expressing CD206 in the eighth week of infection correlates with a more ulcerated lesion and higher parasite burden. Our results are correlated with a previous study describing that the high expression of CD206 in C57BL/6 macrophages is correlated with susceptibility to L. major infection.39
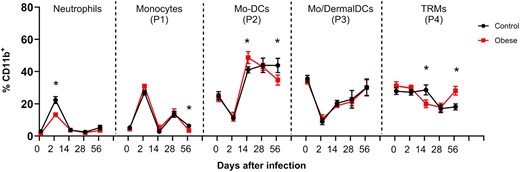
Analysis of cell population frequency kinetics in the ear derm after L. major infection. C57BL/6 mice were fed for 12 wk with AIN93-G or HSB diet and infected with 2 × 10⁵ L. major. Cell frequency was evaluated 2, 14, 28, and 56 d after infection. Live populations of monocytes (P1), Mo-DCs (P2), Mo/DermalDCs (P3), and TRMs (P4) were evaluated in the CD11b+ gate. Populations: Ly6G+ (Neutrophils), Ly6ChiCD206− (P1), Ly6CintCD206− (P2), Ly6CintCD206− (P3), and Ly6CintCD206+ (P4), data are representative from 2 to 3 independent experiments with n = 3–5 mice/experiment. Data represented by mean ± SEM; *P < 0.05 identified by Student's t-test comparing the CT and obese groups at different times of infection.
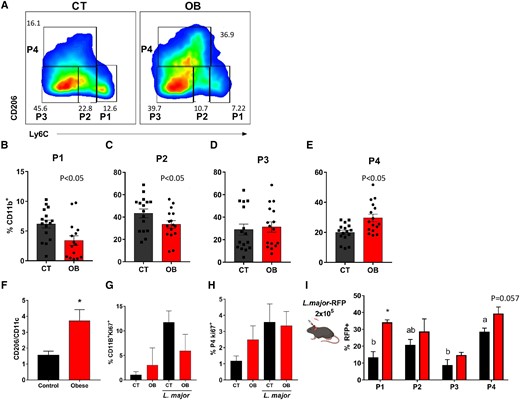
TRM population has increased frequency in the skin over monocytes, DCs, and CD11c+ cells after 8 wk of infection. C57BL/6 mice were fed for 12 wk with AIN93-G or HSB diet and infected with 2 × 10⁵ L. major and euthanized 8 wk after infection. A) Dot plots representative of CD11B+ monocytes (P1), Mo-DCs (P2), Mo/DermalDCs (P3), and TRMs (P4) in infected CT and obese animals; B) Frequencies of P1; C) P2; D) P3; and, P4 (E) in infected CT and obese animals (F) expression ratio of CD11B+CD206+/CD11B+CD11c+ cells in the ear of infected mice after 8 wk; G) Frequency of CD11B+KI67+ cells in the ear with or without infection; E) frequency of CD11B+CD206+KI67+ cells in the ear with or without infection; C57BL/6 mice were fed for 12 wk with AIN93-G or HSB diet, infected with 2 × 10⁵ L. major-RFP, and euthanized 8 wk after infection to measure the presence of Leishmania in cell populations. I) Frequency of RFP expression at P1, P2, P3, and P4 in infected CT and obese mice; (B to E) Results are the pooling of 4 independent experiments (n = 3–5); (F to I) Representative results from 2 independent experiments (n = 3–5), data represented by mean ± SEM. *P < 0.05; Statistical analysis by unpaired Student's t-test (B to F) and One-way ANOVA with Turkey's posttest (G to H). I) Mean ± SEM represents data. *P < 0.05; Statistical analysis performed by unpaired Student's t-test between CT and OB, and by the One-way ANOVA test to compare P1 × P2 × P3 × P4 in the same group (a × b = P < 0.05).
3.5 TRMs in obese mice increase regardless of local proliferation and parasites persist into these cells
Our results indicated that after 8 weeks of infection, there was a notable increase in CD206+ macrophages in the skin of obese mice compared to monocytes (Fig. 5A) and Mo-DCs (Fig. 5C). However, no significant differences were observed in the Mo/DermalDCs (P3) (Fig. 5D). Interestingly, the TRM (P4) population increased only in obese mice (Fig. 5E), with a higher proportion of CD206+ macrophages relative to CD11c+ proinflammatory macrophages in the eighth week of infection, as demonstrated by the CD11b+CD206+/CD11b+CD11c+ ratio (Fig. 5F). Importantly, our data suggest that the increase in TRM CD206+ is unlikely to be due to local proliferation, but rather originates from circulating monocytes, as demonstrated by the similar expression of the transcription factor KI67 in CD11b+ cells (Fig. 5G) and CD11b+CD206+ cells (Fig. 5H).
Embryonic macrophages are highly endocytic and phagocytic in various organs.40 During L. major infection, TRMs in the skin maintain their phagocytic capacity throughout the infection period. However, they are less efficient at killing parasites than other myeloid cells.39 To evaluate the phagocytic capacity and leishmanicidal activity of each cell subtype, we used genetically modified L. major that expresses the RFP protein (L. major-RFP). After 8 wk of infection, we found that dermal TRMs in the control group had the highest infection rate among the cells, indicating their inefficiency in killing parasites related to other myeloid cells. Therefore, while it is relevant to consider the overall higher parasite burden in the obese group, TRMs were among the most parasitized cells in both groups and likely could not efficiently kill the parasites (Fig. 5I).
3.6 CCR2−/− mice show a delay in lesion resolution, and obesity potentiates tissue damage
The role of CCR2 in orchestrating monocyte migration into tissues is well established. CCR2-knockout mice show a reduction in the number of circulating Ly6C+ monocytes and defects in monocyte recruitment to tissues.41 In the context of L. major intradermal infection, CCR2 mediates the migration of monocytes to infected tissues after the release of CCL2 by fibroblasts and leukocytes.42 Notably, in CCR2-knockout mice, most macrophages were TRM-like cells as defined by CD206 expression.37 Therefore, to evaluate the role of dermal TRMs in obese mice infected with L. major, we used CCR2-knockout mice, which allowed us to specifically investigate the contribution of TRMs over monocyte-derived macrophages.
First, we observed that CCR2−/− mice exhibited weight gain similar to that of C57BL/6 mice when fed a hypercaloric diet (Fig. 6A). After infection, the lesions in the obese knockout mice developed faster than those in the control group (Fig. 6B). In the sixth week of infection when we verified recovery in control C57BL/6 mice, both the absence of the CCR2 receptor and diet-induced obesity were factors that caused an increase in lesion size and pathological scores (Fig. 6B and C). It is noteworthy that when evaluating the pathological score of obese CCR2−/− mice, they had more ulcerated lesions and more relevant tissue damage after 8 wk of infection than animals of the same lineage fed the control diet (Fig. 6C).
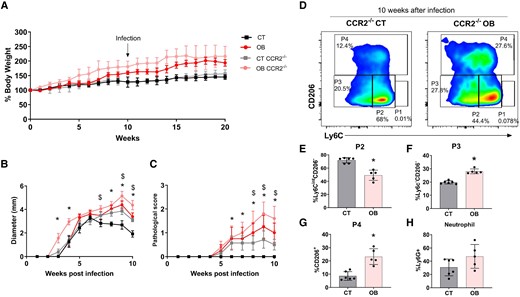
CCR2−/− mice showed a delay in lesion resolution regardless diet consumption, but obesity aggravates the lesion development. C57BL/6 and CCR2−/− mice were fed for 20 wk with the AIN93-G or HSB diet. In the 10th week of the diet, the animals were infected in the ear with 2 × 10⁵ L. major metacyclic promastigotes. A) The mean weight of mice fed the AIN93-G and HSB diets over the experimental period; (B and C) Lesion development: B) diameter, C) pathological score (0, without ulceration; 1, with ulceration; 2, mild tissue damage; and 3, severe tissue damage); D) dot plots representative of CD11B+ monocytes (P1), Mo-DCs (P2), Mo/DermalDCs (P3), and TRMs (P4) in infected CT and obese animals; E) frequency of P2; F) P3; G) P4; H) neutrophils; mean ± SEM represents data; n = 5–7; (B and C) statistical analysis by One-way ANOVA test; *P < 0.05; $ indicates statistical difference between obese CCR2−/− × CT CCR2−/−; (E to H) data represented by mean ± SD. *P < 0.05; Statistical analysis by unpaired Student's t-test.
When assessing the frequency of cells, we first noted that without infection, CCR2−/− mice presented almost twice as many TRMs as wild type (WT) C57BL/6 mice (Supplementary Fig. 6A). Interestingly, after 8 wk of infection, obese CCR2−/− mice showed a striking increase in TRMs compared with lean knockout mice (Fig. 6D). While CCR2−/− control mice showed a higher frequency of Mo-DCs (P2) (Fig. 6E), obese CCR2−/− mice showed an increased frequency of Mo/DermalDCs (P3) (Fig. 6C) and TRMs (Fig. 6D and G). Notably, both groups presented with higher levels of neutrophils (Fig. 6E), which likely compensated for the lack of monocyte migration (Supplementary Fig. 6B). Even so, when analyzing the proportion of TRMs over neutrophils, it is evident that the increase in P4 is not biased towards the increase in neutrophils but rather a specific trait of obese mice (Supplementary Fig. 6C). We also sorted 1 × 10⁶ circulating monocytes (Ly6C+) from both control and obese C57BL/6 mice and transferred them to the opposite group after 2 wk of infection. In this setup, transferring monocytes primed under different host conditions did not affect the prognosis of the disease compared to the respective groups that did not receive the extra load of monocytes (Supplementary Fig. 6D and E).
Therefore, the prevalence of CD206+ TRMs in the skin, irrespective of dietary factors, plays a pivotal role in the exacerbation of lesions. The elevated number of TRMs in obese C57BL/6 mice underscores the significant contribution of this cell subtype in overcoming resistance to L. major infection. The model delineated herein provides compelling evidence for the mechanism underlying obesity-induced susceptibility to infections and holds promise for informing future therapeutic interventions.
4. Discussion
In this study, we demonstrate that macrophages from obese C57BL/6 mice exhibit a less effective response to L. major, rendering the mice more susceptible to the parasite. Consequently, C57BL/6 mice with diet-induced obesity develop more severe lesions and harbor a higher parasite burden. Notably, our findings reveal that after 8 weeks of infection, obese mice display a higher frequency of TRMs at the site of infection in the skin, in contrast to inflammatory cells. Importantly, utilizing CCR2-deficient mice, we establish that the predominance of TRMs in the ear is pivotal for delaying lesion resolution, with diet-induced obesity exacerbating this phenomenon.
Our study underscores the lasting impact of prolonged exposure to a high-sugar, high-fat diet on the behavior of bone marrow progenitor cells, even when cultivated outside the host environment. Previous research has shown that artificially induced obesogenic conditions can induce a mild inflammatory profile in BMDMs following exposure to LPS.21,22 Further studies, including our own, have demonstrated that peritoneal macrophages from obese C57BL/6 mice exhibit reduced nitric oxide levels when exposed to L. major11 or LPS,43 despite showing elevated levels of inflammatory cytokines in the bloodstream and other signs of systemic inflammation. Obesity commonly triggers dyslipidemia, endotoxemia, and heightened plasma cytokine levels, which may contribute to the development of innate immune memory, also known as trained immunity.44 This phenomenon has been previously observed in models of diet-induced obesity,45,46 suggesting that systemic effects associated with obesity could directly influence cell differentiation in the bone marrow. Therefore, we suggest that obesity may induce a state of trained immunity, potentially leading BMDMs to adopt an ineffective profile in controlling parasite proliferation during L. major infection.
While in vitro demonstrations of metabolic inflammation21 highlight how obesity can compromise cell differentiation, it is likely that this phenomenon also occurs in vivo. Macrophages activated in this context could present an altered inflammatory profile i.e. inefficient for parasite control. For instance, FFA, which are elevated during obesity, can bind to both Toll-like receptors (TLRs) and CD36 receptors. TLRs play a crucial role in mediating inflammation, while CD36 is predominantly expressed by macrophages involved in maintaining tissue homeostatic and housekeeping functions. CD36 facilitates increased uptake of lipids by macrophages, while also promoting the secretion of proinflammatory cytokines.47 In addition, obesity can alter the intracellular energy metabolism of macrophages by simultaneously increasing glycolysis and oxidative phosphorylation, which is congruent with a stressed phenotype such as the metabolic inflammation discussed above.48
Abnormal elevation of lipids and other metabolites in circulation has been shown to affect macrophage differentiation, particularly in organs that are overloaded with lipids during obesity, such as the AT and liver.13,49 In the AT niche, recent studies utilizing flow cytometry and single-cell RNA sequencing have provided new insights into the vast heterogeneity of macrophage subpopulations in the organ during both homeostasis and diet-induced obesity.13,14,16,50,51 These reports have expanded our comprehension of AT as a multifaceted immune environment. They demonstrate that excessive lipid accumulation in AT can induce dynamic alterations in macrophages, often shifting them towards a nonclassic inflamatory phenotype. Additionally, these alterations affect cells involved in lipid catabolism, thereby constraining inflammatory exacerbation.13 Furthermore, Silva et al.16 demonstrated that during obesity, the increase in macrophages with distinct inflammatory profiles is accompanied by an increase in TRMs, marked by CD206 expression, which proliferate along with intense vascularization of the tissue. Similarly, our findings demonstrated that obese mice exhibited a higher number of CD206+ macrophages not only in the AT but also in the liver and spleen. It is possible that the increased number of cells in these organs was associated with lipid-associated macrophages, which have been previously described in the AT and liver.13,49 Physiologically, TRMs adapt to continuous uptake lipids and may be viewed as a compensatory mechanism in response to elevated levels of metabolites, circulating inflammatory cytokines, and LPS during obesity. However, this phenomenon can hinder microbial proliferation. Nevertheless, further research is needed to elucidate how the body of an obese host with preexisting inflammation mitigates escalating inflammation and becomes more susceptible to infections.
In contrast to cells from the AT, liver, and spleen, which are highly sensitive to metabolic fluctuations, our observations suggest that the frequencies of different subtypes of innate cells, including TRMs, remain relatively stable in the skin. Following L. major intradermal infection, a pathway is established for neutrophils and circulating monocytes to infiltrate the dermis, hours after injection.52 These bone marrow-derived cells integrate into the preexisting cell population in the dermis, providing a compelling niche for investigating the response of different macrophages from an obese host to the parasite. We noticed that mice on an HSB diet exhibited increased infiltration of CD11b+ cells in the ear from the fourth week of infection. By the 8 wk , when the lesions were more severe and the parasitic burden was higher in obese mice, we observed a rise in both the number and frequency of CD206+ macrophages compared to CD11c+ macrophages, DCs, and inflammatory monocytes. TRMs in the skin have restricted migration to the lymph nodes and have limited antigen-presenting capacity compared to DCs.37 They are effective phagocytic cells that express a series of specific genes that confer functions such as degradation of macromolecules and tissue repair.38 A previous study showed that these cells maintain an antiinflammatory profile and remain permissive to parasite growth, even in a genetic background that favors Th1 immunity,53 such as C57BL/6 infected with L. major.
TRMs in the skin typically exhibit a low turnover rate under a homeostatic state.38,39 Even in the presence of the parasite, these cells displayed a minimal proliferation rate, which was similar across the infected groups. The decline in monocytes in the skin of infected obese mice, followed by a subsequent increase in TRMs, suggests a rapid differentiation of monocytes into TRM-like cells. Importantly, studies have demonstrated that the origin of TRMs in the dermis involves a considerable percentage of monocytes,17,37 a phenomenon that can be further accentuated during inflammatory conditions. In our study, we hypothesized that the heightened tissue vascularization induced by infection, coupled with constant cell influx, could result in increased availability of obesogenic stimuli in the microenvironment. This in turn might influence cell function and local differentiation toward an antiinflammatory phenotype. Alternatively, monocytes from obese mice may be exposed to specific stimuli during bone marrow development or circulation, ultimately leading to the expansion of macrophages with overlapping characteristics with TRMs; this could be a mechanism involved in infectious disease susceptibility in individuals with obesity.54
Indeed, TRMs in the skin exhibited decreased efficiency in parasite elimination, as indicated by the higher expression of L. major-RFP in this population in both the control and obese mice. Another intriguing observation from the study was that TRMs in the skin of obese mice maintained their endocytic capacity, contrasting with resident macrophages in the spleen, which displayed a reduced ability to absorb FITC-dextran. This decline in absorptive capacity was comparable to that observed in CD206+ macrophages in AT.16 Overall, these findings highlight how obesity can have a systemic impact on the proper functioning of macrophages in less-explored tissues.
Previous studies have investigated the susceptibility of CCR2−/− mice to L. major infection,42 highlighting their heightened susceptibility due to the absence of migratory monocytes. Later studies in the CCR2−/− mouse dermis showed that the lack of monocyte migration leads to a compensatory increase in the frequency of TRMs, which can constitute up to 80% of the cells under homeostatic conditions.37 Given this context, we aimed to exploit the predominance of TRMs as the primary population of macrophages at the infection site to study the phenotype associated with an abundance of these cells. Our study revealed that lean CCR2−/− mice exhibited lesions comparable to those observed in obese C57BL/6 mice. Notably, CCR2−/− mice with diet-induced obesity displayed accelerated lesion development, presenting more ulcers than those observed in the other groups after 8 wk .
In conclusion, our study underscores the significance of TRMs predominance in lesions, along with the decreased frequency of inflammatory monocytes, which contributes to the increased susceptibility of mice to L. major infection. These findings align with those of Lago et al.,12 who observed that obesity correlates with prolonged duration of patients experiencing therapeutic failure due to lesions caused by L. braziliensis infection in an endemic area of Brazil.
5. Conclusion
Taken together, our findings suggest that obesity may render macrophages more susceptible to L. major proliferation. We observed that diet-induced obesity impeded parasite containment, leading to elevated lesion severity, parasitic burden, and prevalence of TRM-like cells in the skin following 8-wk of infection. Future investigations should expand to various infection types to elucidate the mechanisms through which obesity serves as a risk factor.
Acknowledgments
We thank Ilda Marçal and Hermes Ribeiro for mice facility care; Professor Flávio Almeida Amaral for CCR2−/− mice donation; and Daniela Silva dos Reis for assistance with flow cytometry.
Author contributions
V.D.M. and T.U.M. designed the study and wrote the manuscript. V.D.M., L.V., S.C.B., P.H.M.P., L.T., M.F.A.O., and M.A.O. performed the experiments. T.U.M., A.M.C.F., and L.Q.V. supervised the project. All authors provided critical comments on the study.
Supplementary material
Supplementary material is available at Journal of Leukocyte Biology online.
Funding
This work was support by research grants from Fundação de Apoio à Pesquisa do Estado de Minas Gerais—FAPEMIG (APQ 00704-14 and APQ-2266-18), Pro-Reitoria de Pesquisa (PRPq) UFMG; Conselho Nacional de Desenvolvimento Científico e Tecnológico (CNPq); Coordenação de Aperfeiçoamento de Pessoal de Nível Superior (CAPES); Instituto de Investigação em Imunologia (III).
References
Author notes
Conflict of interest statement. None declared.
