


Abstract
Insects that infest postharvest commodities cause significant damage or destruction, costing billions of dollars in lost products yearly. Insecticide treatments applied as contact insecticides are effective in managing insect populations. However, recovery of the insects after exposure to these insecticides is increased if food is present, reducing the efficacy of surface treatments and leading to continued infestations. In addition, variation in temperature and humidity could play a significant role in recovery. Here, we assess the role of food, temperature, and humidity on the recovery of Tribolium castaneum Herbst, red flour beetle, after exposure to a contact insecticide. We found food is an important factor in recovery under different temperature and humidity conditions. While recovery was higher at warmer temperatures and higher humidities, recovery increased further when food was present versus absent. Moreover, we found that any amount of flour, even a dusting, resulted in over 90% of beetles recovering after insecticide exposure, but when sand was substituted for flour, recovery was 25% lower compared to a no food treatment. These results highlight the importance of how environmental factors and the availability of food influence efficacy of insecticide treatments. Sanitation in food facilities is critically important as even the smallest amount of food present can cause substantial recovery, allowing beetles to escape treated areas and move throughout facilities. Further work pinpointing variation in underlying recovery between different populations and among different insect species is needed to understand local adaptation potential.
Introduction
Insects that infest stored products can cause significant damage and cost producers and food processors billions of dollars in post-harvest losses (Pimentel 1991, NAAS 2019). Stored product insect pests cause damage by directly feeding on raw grains and contaminating processed food products with insect fragments, cast skins, and frass (Pimentel 1991). Treating food processing and storage facilities with contact insecticides on the floors, walls, and cracks and crevices can reduce insect populations and movement of mobile stages, thus reducing subsequent damage to the stored products. However, many factors influence the efficacy of insecticides, which can ultimately lead to the development of insecticide resistant populations. For example, improper applications can lead to sublethal exposures (Parkin 1965, Nayak et al. 2015, Hagstrum and Athanassiou 2019, Attia et al. 2020) and the presence of food significantly improves recovery after exposure to a variety of insecticide formulations and application methods (Arthur 2000a, 2000b, Toews et al. 2010, Gerken et al. 2021). However, there is little information about how environmental factors interact with the presence of food to influence recovery. What work has been done has shown a significant impact of food presence and temperature on insecticide effectiveness (Muzio et al. 2024). Because these insects live in a constantly changing environment and stored grain is housed in many different thermal environments, it is important to understand how food and other factors influence insecticide efficacy with the goal of preventing the emergence of resistant populations, especially for major pests of stored products, which are currently understudied. Moreover, surface insecticide treatments are costly and understanding what parameters reduce efficacy is important for reducing costs and increasing effectiveness (Fields and White 2002, Abd El-Azi 2011).
Although specific mechanisms of recovery are not known, there are a variety of ways that food and other environmental factors could stimulate recovery following exposure to insecticides. First, the presence of food may trigger the expression of detoxification enzymes, which would allow the insect to regain mobility and reproduce following exposure. Moreover, temperature and humidity can influence metabolic detoxification of insecticides (Punzo 1993, An et al. 2023, Kumar et al. 2023). For example, temperature and humidity may interact to increase in metabolic rates, which contribute to increased levels of metabolic degradation (Mao et al. 2019) and allow insects to clear the toxins and active ingredients from their bodies quickly (Perry 1960). Increased humidity in particular has been hypothesized to increase protection by the cuticle, waxes, and hydrocarbons, essentially wicking away insecticides from the insect (Appel et al. 2004). In addition, food could act to wick away insecticide away from the cuticle, reducing the impacts of absorption into the insect (Ming et al. 2024).
The nutritional value or amount of food could also contribute to the recovery of these insects, both in terms of increasing or sustaining metabolic rates or by absorbing the insecticide, thus reducing the amount of active ingredient that comes into contact with the insect (Arthur 2000a, 2000b, Arthur et al. 2015). For example, flour absorbed the active ingredient β-cyfluthrin from a treated concrete surface in as little as 24 h and had a significant effect on adult Tribolium castaneum Herbst (Coleoptera: Tenebrionidae), red flour beetle, adults even after the flour was placed on a clean concrete surface (Arthur et al. 2015). The physical properties of the food substrate could also play a role in recovery. For example, diatomaceous earth has been shown to increase mortality in insects by cutting into cuticles and resulting in dehydrating effects (Fields and Korunic 2000) and even increasing insecticide effectiveness. Nutritional properties have recently been examined (Ming et al. 2024) and the authors suggest that food with high nutritional value can enhance insect recovery following insecticide exposure.
Environmental conditions and the presence of food vary across the postharvest supply chain. Although sanitation is important for managing stored product insect populations and reducing recovery, food debris cannot be completely excluded around machinery or in other hard to reach areas (Morrison et al. 2019). These locations are typically a foci of resident insect populations and can provide a source of insects when the next shipment arrives at a storage or processing facility (Cogburn 1973, Campbell et al. 2010). In addition, even though raw grain and processed foods are housed predominately in anthropogenic structures, temperature and humidity can vary, especially when goods are transported for processing and retail sale. Therefore, it is critical to understand how these conditions influence insecticide efficacy. Here, we examine how various environmental conditions influence recovery in the presence of food in T. castaneum after exposure to a commercially available deltamethrin contact insecticide. These cosmopolitan stored product pests are highly mobile secondary feeders that are likely to come into contact with insecticides and have been previously shown to recover under different environmental conditions (Gerken et al. 2021) and in the presence of food (Arthur 2000a, 2000b). However, it is unclear whether different environmental conditions, such as temperature and humidity, can influence or synergize recovery in the presence of food. By understanding how small changes in the environment affect recovery, we can better aim to control these insects and prevent recovery from insecticide exposure and possible insecticide resistance within a population.
Materials and Methods
Rearing and General Bioassay Protocols
Tribolium castaneum were obtained from a laboratory colony that has been maintained on wheat flour (Heartland Mills, Merienthal, KS) with 5% brewer’s yeast for over 30 yr at the Center for Grain and Animal Health Research in Manhattan, KS (Beeman et al. 2024). Colonies were maintained by placing 100 mixed sex adults on fresh flour/brewer’s yeast for 1 wk. Adults were then removed and the flour with eggs was placed back in 32 oz (0.95 L) glass Mason jars with filter paper lids for ventilation and reared in an environmental chamber set at 27 °C and 60% relative humidity (RH) on a 16:8, light:dark cycle (Percival, CTH-811 or I36VL, Perry, IA). Mixed sex adults used in the experimental assays were 1- to 2-wk-old and were collected 24 h prior to the experiments and placed in empty 9-dram glass vials in groups of 10.
Bioassay dishes consisted of 100 × 20 mm (62 cm2) plastic petri dishes (Fisher Scientific) partially filled to a depth of ~1.0 cm with concrete (Rockite, Hartline Product Co., Inc, Cleveland, OH), which was allowed to cure at ambient conditions for 2 wk prior to the experimental assays to allow time to harden and dry. Afterwards, a commercially available pyrethroid insecticide CentynalEC (4.75% active ingredient deltamethrin, Central Garden & Pet Company, Shamburg, IL) was applied to the arenas. The label rate specifies application rates of 7.4 to 44 ml of insecticide in 3.8 L of water to treat 92.9 m2. In this study, we used an application rate in the middle of the application range, 29.5 ml to assess effects on T. castaneum, based on results from Arthur (2018). Arthur (2018) observed rapidity of knockdown did not increase with increasing application rate, thus we used a similar rate in this study. The volumetric spray rates used to apply the insecticide was 0.3 ml of formulated solution per individual bioassay dish. The insecticide was applied using a Badger 100 Artist’s airbrush (Franklin Park, IL) to cover the arena, as described in Arthur (2018). Control dishes were sprayed with municipal tap water only (Manhattan, KS) at a rate of 0.3 ml per bioassay dish using a separate artist’s airbrush. Water only dishes served as the control to demonstrate there was nothing dissolved in the water that affected the adult T. castanem. All dishes were allowed to dry at ambient conditions for approximately 24 h after insecticide or water treatments before beetles were exposed to the arenas.
Ten 1- to 2-wk-old mixed sex T. castaneum adults were placed on the arenas (treatment or control) for a total of 3 h. Dishes were monitored every 15 min and the adults were classified as either running or affected (affected includes knocked down and dead). Knocked down is defined as a state of altered mobility, with adults on their backs unable to right themselves, while running is defined as normal movement of the beetles (Arthur 2018, Scheff et al. 2019). For data analysis, we focused on the number of insects that were running as we are most interested in recovery following insecticide exposure.
Recovery dishes consisted of 100 × 20 mm (62 cm2) petri dishes lined with filter paper (Whatman Grade 1, GE Healthcare IUK Limited, Buckinghamshire, UK). The filter paper was secured with a bead of non-toxic adhesive caulking (DAP Kwick Seal, DAP Products Inc. St. Louis, MO), and the sides of the area were coated with Fluon (polytetrafluoroethylene, Sigma-Aldrich Co., St. Louis, MO) to prevent insect escape during recovery testing. The recovery arenas were subjected to different treatment conditions below to identify variables that influenced recovery. Each recovery treatment detailed below was repeated for 5 replicate dishes of ten individuals on a given day (block) with 3 total blocks completed for each treatment.
Amount of Food
To determine the effect of food on recovery, insects were transferred to the recovery dishes and given either 0.42 ± 0.02 g (mean ± standard error) of food consisting of wheat flour + brewer’s yeast or no food. This amount of food represented enough food so that all 10 insects could easily interact with the food, the food was easily distributed throughout the recovery dish, is a similar amount as other studies (Muzio et al. 2024), and the insects not able to go fully into the food. The amount of food present in the recovery dishes was also varied. In addition to no food and 0.42 g of food, insects were also given approximately 0.2 g of food and a dusting, which is a tapping of flour from the top of a scoop of flour, which was on average less than 0.01 g. Dishes were placed in an environmental chamber at 27 °C and 60% RH, in complete darkness. Recovery dishes were observed after 24, 48, or 168 h and the number of running and affected adults were recorded.
Friction
To assay if friction could influence recovery, we transferred the adults to recovery dishes and provided (i) 0.42 ± 0.02 g of fine playground sand (0.08 to 0.4 mm grain size; Sandtastik Play Sand, Sparkling White), (ii) 0.42 ± 0.02 g of wheat flour (average particle size of 0.19 mm for fine ground flour) (Bressiani et al. 2019), or (iii) no food. These dishes were placed at 27°C and 60% RH for recovery and observed after 24, 48, or 168 h and the number of running and affected adults were recorded.
Temperature and Humidity
To test for the effects of food in combination with temperature or humidity, we assayed recovery at 18, 22, and 32 °C at 60% RH with 0.42 g of food or no food. To test for humidity effects, we assayed recovery at 27 °C at 30, 40, and 60% RH both with (0.42 g of wheat flour) and without food present. Recovery status was checked after 24, 48, and 168 h.
Data Analysis
Data analyses were performed in R (version 4.1.3, R Core Team 2021). The data did not follow a normal distribution due to the nature of the experiment (insecticide treated versus control, which leads to inflation on both ends of the distribution) so were analyzed using a generalized linear model (glm.nb) in the package MASS (Venables and Ripley 2002) with number running as the dependent variable. Because the number running is directly proportional to the number of insects knocked down/dead (affected), we do not report any of the knocked down/dead models, as these would reflect the same results as running as the dependent variable. We are also primarily interested in these insects’ ability to recover with and without food and at variable environments, thus the focus on number of insects running. We first used a statistical model that included data for all timepoints, during exposure (every 15 min for 180 min) and post-exposure (24 h, 48 h, and 168 h). Each assay combination was analyzed independently for clarity of comparisons. For temperature effects, treatment (deltamethrin or control), diet (food or no food), exposure times, and temperature (18, 22, 27, or 32 °C) were main effects and replicates were treated as random effects. We also tested for interactions. Similarly, for RH differences, RH (30, 40, and 60% RH), treatment, time, and diet were main effects; for both friction (food, no food, and sand) and food amounts (full food, half food, dusting, and no food), the main effects of treatment, time, and diet and all interactions were tested.
For models with all time points, post-hoc marginal means were compared using the emmeans package (Lenth 2024) for significant interaction effects comparing the number of beetles running for treated and control beetles. This analysis allows us to make sure the effect within each treated group is the same (insecticide treated or control) before groups of beetles were assigned a recovery environment. In addition, these identify specific time points when the majority of the beetles are knocked down and physiologically affected by the insecticide treatment.
For models that contained only post-exposure timepoints (24, 48, and 168 h), post-hoc marginal means were performed with emmeans if there were significant differences for interaction effects, followed by the pairs call. For example, specific pairwise interactions for the temperature assay were found with temperature as the primary effect with the interaction effect of diet-by-time-by-treatment. This is written in R as emmeans(model, ~ Temperature | Diet × Time × Treatment). The effect of time was compared to the interaction effect of diet-by-temperature-by-treatment; the effect of diet compared to time-by-temperature-by-treatment; and the effect of treatment compared to diet-by-temperature-by-time for the temperature assay to find all pairwise comparisons for the 4-way interaction. For the friction and amount assays, the 3-way interaction of diet-by-time-by-treatment was examined in a similar fashion. For the humidity assay, marginal means of the 4-way interaction of humidity-by-diet-by-time-by-treatment was also done as described above.
Results
Amount of Food
For the model with all time points, the interaction of treatment–diet–time was significant (Table 1). Post-hoc marginal means showed no significant differences in number of beetles running between the controls and treatments through 60 min; however, fewer beetles were observed running in the insecticide treatments at the 75 min time point (Supplementary Table 1; Fig. 1). At 168 h, the number of beetles running in the presence of food at any amount did not differ between deltamethrin treated and control treatments (Supplementary Table 1).
ANOVA output from the negative binomial generalized linear model for number running for different amounts of diet, treatment, and time. Full Model is for all exposure and post-exposure time points.
| Full Model, All Time Points | Post-exposure Time Points | |||||
|---|---|---|---|---|---|---|
| Chi-sq | Df | P-value | Chi-sq | Df | P-value | |
| Treatment | 2060.39 | 1 | < 0.0001 | 245.83 | 1 | < 0.0001 |
| Diet | 22.15 | 3 | < 0.0001 | 76.13 | 3 | < 0.0001 |
| Time | 1049.21 | 14 | < 0.0001 | 55.931 | 2 | < 0.0001 |
| Treatment:Diet | 59.57 | 3 | < 0.0001 | 190.056 | 3 | < 0.0001 |
| Treatment:Time | 2982.05 | 14 | < 0.0001 | 110.436 | 2 | < 0.0001 |
| Diet:Time | 79.71 | 42 | 0.00039 | 12.877 | 6 | 0.045 |
| Treatment:Diet:Time | 305.7 | 42 | < 0.0001 | 60.534 | 6 | < 0.0001 |
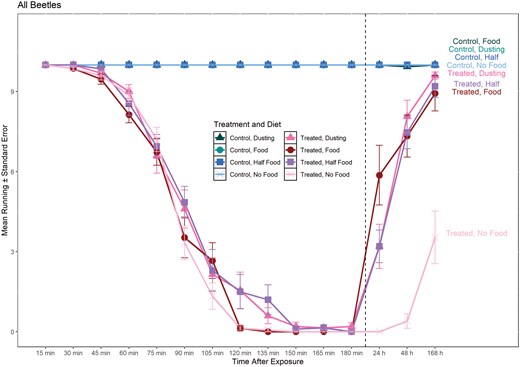
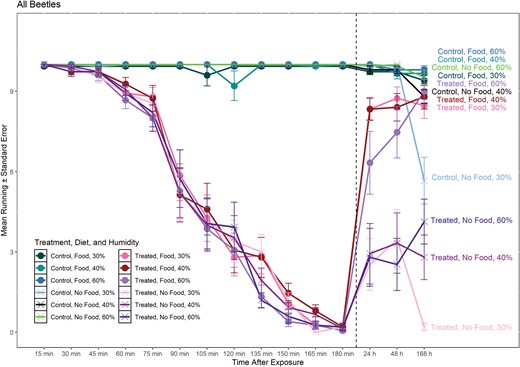
Line graph of mean number of T. castaneum running during exposure and post-exposure to deltamethrin on concrete surface in the presence of different amounts of food. Dashed line separates 0–180 min (during exposure) from > 24 h (post-exposure). Circles represent treatments with food present during recovery (24 h, 48 h, and 168 h), X represents treatments with no food present during recovery, squares represent treatments with half the amount of standard food present during recovery, and triangles represent only a dusting of food present during recovery. Labels on the right side of the graph correspond to each line of treatment and amount of diet.
For the model that included post-exposure time points only, all main effects and interactions were significant (Table 1). At 24 and 48 h, the number of treated beetles that were running was significantly lower compared to control beetles (Fig. 2). However, at 168 h, the number of beetles running did not differ between the 3 food treatments in the treated and control samples (Fig. 2). Within the control treatments, there were no differences in number of beetles running throughout the different post-exposure times within each diet treatment (absolute z-ratio = 0 to 0.062, P > 0.99). Moreover, there were no significant differences in number of beetles running throughout the different diet treatments in the controls within each exposure time (absolute z-ratio = 0 to 0.058, P > 0.99). However, within each exposure time, beetles with the full amount of food recovered by 24 h with significantly fewer beetles recovering with only a dusting and half food; by 48 h, the number of beetles running with any amount of was not significantly different (Table 2).
Amount marginal means, between food amount. All Control P-value > 0.90. All df = Inf.
| Time | Contrast | Estimate | SE | z-ratio | P-value |
|---|---|---|---|---|---|
| 24 h | Dusting—Food | −0.61 | 0 | −3.69 | 0.0013 |
| Dusting—Food half | 0.00 | 0 | 0.00 | 1.00 | |
| Dusting—No Food | 38.21 | 17327434 | 0.00 | 1.00 | |
| Food—Food half | 0.61 | 0 | 3.69 | 0.0013 | |
| Food—No Food | 38.81 | 17327434 | 0.00 | 1.00 | |
| Food half—No Food | 38.21 | 17327434 | 0.00 | 1.00 | |
| 48 h | Dusting—Food | 0.095 | 0 | 0.72 | 0.89 |
| Dusting—Food half | 0.077 | 0 | 0.59 | 0.94 | |
| Dusting—No Food | 3.00 | 0 | 7.18 | < 0.0001 | |
| Food—Food half | −0.018 | 0 | −0.13 | 0.99 | |
| Food—No Food | 2.91 | 0 | 6.94 | < 0.0001 | |
| Food half—No Food | 2.93 | 0 | 6.98 | < 0.0001 | |
| 168 h | Dusting—Food | 0.072 | 0 | 0.64 | 0.92 |
| Dusting—Food half | 0.043 | 0 | 0.41 | 0.98 | |
| Dusting—No Food | 1.00 | 0 | 6.44 | < 0.0001 | |
| Food—Food half | −0.029 | 0 | −0.26 | 0.99 | |
| Food—No Food | 0.93 | 0 | 5.72 | < 0.0001 | |
| Food half—No Food | 0.96 | 0 | 6.14 | < 0.0001 |
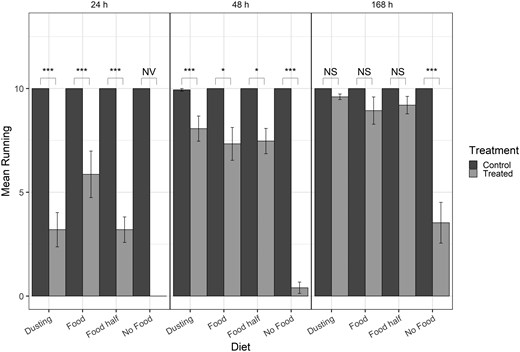
Bar graph of mean number of beetles running for post-exposure time points only (columns) in the presence of food, half the amount of regular food, and a dusting of food. Brackets indicate differences between specific treatments in the post-exposure time point. NS = not significant (P > 0.05), * = P < 0.01, ** = P < 0.001, *** = P < 0.0001, NV = no value (statistics could not be computed with log-values of 0).
For deltamethrin treated beetles, there was a significant difference in recovery between 24 h and 48 h for beetles with a dusting and half the normal amount of food with more beetles running at 48 h than 24 h. Between 48 h and 168 h, there was significantly more beetles running when no food was present, but recovery did not differ for any of the food treatments (Table 3, Fig. 2). For full food, half the usual amount of food, and a dusting, recovery gradually increased over time from 24 h to 48 h to 168 h, with initial recovery often increasing from 5 or fewer beetles running at 24 h to more than 7 running at 48 h and nearly all 10 beetles running by 168 h (Fig. 2).
Amount marginal means, between time points. All Control P-value > 0.9. All df = Inf.
| Amount | Contrast | Estimate | SE | z-ratio | P-value |
|---|---|---|---|---|---|
| Dusting | 24 h—48 h | −0.92 | 0 | −5.98 | < 0.0001 |
| 24 h—168 h | 1.10 | 0 | 7.62 | < 0.0001 | |
| 48 h—168 h | 0.17 | 0 | 1.50 | 0.29 | |
| Food | 24 h—48 h | −0.22 | 0 | −1.56 | 0.26 |
| 24 h—168 h | 0.42 | 0 | 3.07 | 0.0062 | |
| 48 h—168 h | 0.20 | 0 | 1.53 | 0.28 | |
| Half Food | 24 h—48 h | −0.85 | 0 | −5.41 | < 0.0001 |
| 24 h—168 h | 1.06 | 0 | 7.28 | < 0.0001 | |
| 48 h—168 h | 0.21 | 0 | 1.74 | 0.19 | |
| No Food | 24 h—48 h | −36.13 | 17327434 | 0.00 | 1.00 |
| 24 h—168 h | 38.31 | 17327434 | 0.00 | 1.00 | |
| 48 h—168 h | 2.18 | 0 | 5.06 | < 0.0001 |
Friction
Analyses with all timepoints indicate significant differences in the interaction of treatment-diet-time (Table 4; Fig. 3). Post-hoc marginal means of the 3-way interaction show no significant differences in number of beetles running through 60 min, with significantly fewer beetles running starting at 75 min and number running consistently declining from 75 min to 180 min (Supplementary Table 1). During the post-exposure recovery time, number running was consistently lower in the insecticide treatments in the remaining time points compared to the control (Supplementary Table 1), with the exception of beetles with food at 48 and 168 h.
ANOVA output from the negative binomial generalized linear model for number running for different types of diet, treatment, and time. Full Model is for all exposure and post-exposure time points.
| Full Model, All Time Points | Post-exposure Time Points | |||||
|---|---|---|---|---|---|---|
| Chi-sq | Df | P-value | Chi-sq | Df | P-value | |
| Treatment | 1210.88 | 1 | < 0.0001 | 284.66 | 1 | < 0.0001 |
| Diet | 19.16 | 2 | < 0.0001 | 68.95 | 2 | < 0.0001 |
| Time | 588.27 | 14 | < 0.0001 | 24.411 | 2 | < 0.0001 |
| Treatment:Diet | 42.28 | 2 | < 0.0001 | 134.691 | 2 | < 0.0001 |
| Treatment:Time | 1573.02 | 14 | < 0.0001 | 75.093 | 2 | < 0.0001 |
| Diet:Time | 63.94 | 28 | 0.00013 | 4.043 | 4 | 0.40 |
| Treatment:Diet:Time | 125.28 | 28 | < 0.0001 | 13.439 | 4 | 0.0093 |
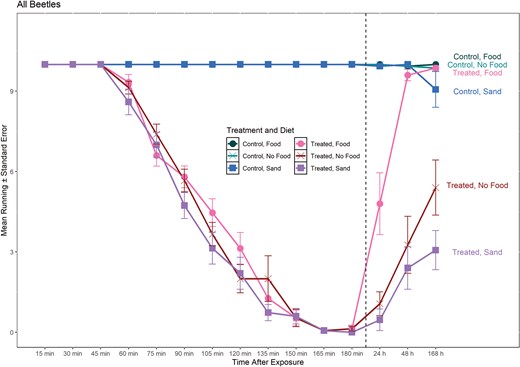
Line graph of mean number of T. castaneum running during and post-exposure to deltamethrin on concrete surface at different diet or sand treatments. Dashed line separates 0–180 min (during exposure) from > 24 h (post-exposure). Circles represent treatments with food present during recovery (24 h, 48 h, and 168 h), X represents treatments with no food present during recovery, and squares represent treatments with sand present during recovery. Labels on the right side of the graph correspond to each line of treatment and diet.
For models of post-exposure time points, the 3-way interaction of treatment-diet-time was significant for the friction assay, as well as all main effects and two-way interactions of treatment-diet and treatment-time (Table 4). Within each time point, treated individuals had significantly lower recovery than control individuals (P < 0.0001; Fig. 3). Comparing diet treatments within each timepoint, there was no difference between recovery for the no food and sand treatments at 24 h and 48 h, but beetles with food had significantly higher recovery than beetles with sand or no food (Fig. 4). Higher recovery in the food treatment compared to the sand treatments and food and no food comparisons was maintained at 168 h as well, but the sand treatment had lower recovery than the no food treatment at the 168 h post-exposure time point. For the friction assay, there were significant differences within diet between recovery for the control and treated beetles for all diets (Fig. 4). Within diet, post-exposure recovery differed in the number of insects running when food, sand, or no food was present between 24 and 48 h, with fewer running at 24 h in all cases (Table 5, Fig. 4). Beetles continued to recover to nearly 100% of beetles tested running at 48 and 168 h when food was present. When sand was present, the number of beetles running did not increase between 48 and 168 h but recovery did increase when no food was present (Table 5).
Friction, marginal means, between hours. All Control treatments P > 0.60. All df = Inf.
| Diet | Contrast | Estimate | SE | z-ratio | P-value |
|---|---|---|---|---|---|
| Food | 24 h—48 h | −0.69 | 0.14 | −4.80 | < 0.0001 |
| 24 h—168 h | 0.72 | 0.14 | 5.01 | < 0.0001 | |
| 48 h—168 h | 0.027 | 0.12 | 0.23 | 0.97 | |
| No Food | 24 h—48 h | −1.12 | 0.29 | −3.89 | 0.0003 |
| 24 h—168 h | 1.62 | 0.27 | 5.93 | < 0.0001 | |
| 48 h—168 h | 0.50 | 0.18 | 2.78 | 0.015 | |
| Sand | 24 h—48 h | −1.64 | 0.41 | −3.96 | 0.0002 |
| 24 h—168 h | 1.88 | 0.41 | 4.64 | < 0.0001 | |
| 48 h—168 h | 0.25 | 0.22 | 1.10 | 0.51 |
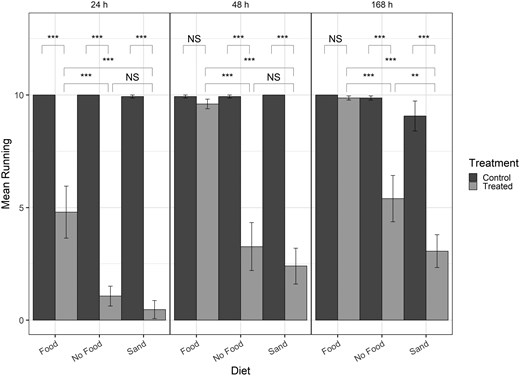
Bar graph of mean number of beetles running for post-exposure time points only (columns). Brackets indicate differences between specific treatments in the post-exposure time point. NS = not significant (P > 0.05), * = P < 0.01, ** = P < 0.001, *** = P < 0.0001, NV = no value (statistics could not be computed with log-values of 0).
Temperature and Humidity
For differences in temperature, in the models with all timepoints considered, the 4-way interaction of treatment-diet-temperature-time was significant, as were the 3-way interactions of treatment-temperature-time, treatment-diet-temperature, and treatment-diet-time (Table 6). Post-hoc marginal means indicated no significant differences in number of beetles running through 45 min in the any of the insecticide treatments (Supplementary Table 1; Fig. 5). Consistent differences of fewer beetles running in the treated samples occurred after 60 min exposure to deltamethrin. Beetles with food at 27 and 32 °C showed no significant differences between treatment and control beetles at 168 h (Supplementary Table 1).
ANOVA output from the negative binomial generalized linear model for number running for different temperatures, food versus no food, treatment, and time. Full Model is for all exposure and post-exposure time points.
| Full Model, All Time Points | Post-exposure Time Points | |||||
|---|---|---|---|---|---|---|
| Chi-sq | Df | P-value | Chi-sq | Df | P-value | |
| Treatment | 5625.4 | 1 | < 0.0001 | 1547.07 | 1 | < 0.0001 |
| Diet | 21.5 | 1 | < 0.0001 | 98.34 | 1 | < 0.0001 |
| Time | 1758.1 | 14 | < 0.0001 | 15.12 | 2 | 0.00052 |
| Temperature | 17.7 | 3 | 0.00052 | 101.92 | 3 | < 0.0001 |
| Treatment:Diet | 74.4 | 1 | < 0.0001 | 341.72 | 1 | < 0.0001 |
| Treatment:Time | 5965.2 | 14 | < 0.0001 | 86.98 | 2 | < 0.0001 |
| Diet:Time | 106.1 | 14 | < 0.0001 | 0.63 | 2 | 0.73 |
| Treatment:Temperature | 81.3 | 3 | < 0.0001 | 465.53 | 3 | < 0.0001 |
| Diet:Temperature | 1.3 | 3 | 0.72 | 3.04 | 3 | 0.39 |
| Time:Temperature | 124.7 | 42 | < 0.0001 | 26.84 | 6 | 0.00016 |
| Treatment:Diet:Time | 279.3 | 14 | < 0.0001 | 0.25 | 2 | 0.88 |
| Treatment:Diet:Temperature | 12.8 | 3 | 0.0049 | 50.18 | 3 | < 0.0001 |
| Treatment:Time:Temperature | 460.7 | 42 | < 0.0001 | 62.89 | 6 | < 0.0001 |
| Diet:Time:Temperature | 14.1 | 42 | 0.99 | 7.48 | 6 | 0.28 |
| Treatment:Diet:Time:Temperature | 96 | 42 | < 0.0001 | 37.86 | 6 | < 0.0001 |

Line graph of mean number of T. castaneum running during and post-exposure to deltamethrin on concrete surface at different temperature treatments. Dashed line separates 0–180 min (during exposure) from > 24 h (post-exposure). Circles represent treatments with food present during recovery (24 h, 48 h, and 168 h) and X represents treatments with no food present during recovery. Labels on the right side of the graph correspond to each line of treatment, diet, and temperature.
The 4-way interaction of treatment–diet–time–temperature was also significant for the temperature assays for the analysis of the post-exposure time points only (Table 6). When examining post-hoc marginal means for differences of temperature–diet–time for deltamethrin treated beetles (Table 7) there were significantly more beetles running at warmer temperatures (32 °C and 27 °C) than at 18 °C or 22 °C, a trend that was held through all post-exposure time points and whether or not there was food present. When food was present, the number of beetles running was higher at 32 °C compared to 27 °C, but only at 24 h; after 24 h, there were no differences between 27 °C and 32 °C (Fig. 6, Table 8). For control comparisons within time points at each temperature, there were no significant differences whether food was present or not at any temperature (absolute z-ratio = 0 to 1.4, P > 0.16). Between time points at each temperature for control beetles for each diet, there was also no significant differences over time (absolute z-ratio = 0 to 1.63, P > 0.23).
Temperature Marginal Means, between temperatures for treated beetles only. All control comparisons are P > 0.9. All df = Inf.
| Food | No Food | ||||||||
|---|---|---|---|---|---|---|---|---|---|
| Time | Contrast | Estimate | SE | z-ratio | P-value | Estimate | SE | z-ratio | P-value |
| 24 h | 18–22 °C | 0 | 1 | 0 | 1.00 | −36.28 | 17327434 | 0 | 1 |
| 18–27 °C | −2.28 | 1 | −4.34 | 0.0001 | −38.48 | 17327434 | 0 | 1 | |
| 18–32 °C | −3.27 | 1 | −6.41 | < 0.0001 | −39.72 | 17327434 | 0 | 1 | |
| 22–27 °C | −2.28 | 1 | −4.34 | 0.0001 | −2.20 | 1 | −2.07 | 0.16 | |
| 22–32 °C | −3.27 | 1 | −6.41 | < 0.0001 | −3.43 | 1 | −3.33 | 0.0048 | |
| 27–32 °C | −0.99 | 0 | −5.28 | < 0.0001 | −1.24 | 0 | −2.86 | 0.022 | |
| 48 h | 18–22 °C | 0.24 | 0 | 0.60 | 0.93 | −34.17 | 17327434 | 0 | 1 |
| 18–27 °C | −2.12 | 0 | −7.51 | < 0.0001 | 0.86 | 24504692 | 0 | 1 | |
| 18–32 °C | −2.26 | 0 | −8.04 | < 0.0001 | −37.57 | 17327434 | 0 | 1 | |
| 22–27 °C | −2.36 | 0 | −7.50 | < 0.0001 | 35.02 | 17327434 | 0 | 1 | |
| 22–32 °C | −2.50 | 0 | −7.97 | < 0.0001 | −3.40 | 1 | −4.82 | < 0.0001 | |
| 27–32 °C | −0.14 | 0 | −1.07 | 0.71 | −38.43 | 17327434 | 0 | 1 | |
| 168 h | 18–22 °C | −0.21 | 0 | −1.08 | 0.70 | −32.07 | 3775342 | 0 | 1 |
| 18–27 °C | −1.15 | 0 | −6.78 | < 0.0001 | −34.67 | 3775342 | 0 | 1 | |
| 18–32 °C | −1.06 | 0 | −6.21 | < 0.0001 | −34.74 | 3775342 | 0 | 1 | |
| 22–27 °C | −0.93 | 0 | −5.97 | < 0.0001 | −2.60 | 1 | −3.55 | 0.0022 | |
| 22–32 °C | −0.85 | 0 | −5.35 | < 0.0001 | −2.67 | 1 | −3.66 | 0.0015 | |
| 27–32 °C | 0.086 | 0 | 0.72 | 0.89 | −0.071 | 0 | −0.27 | 0.99 |
Temperature Marginal Means, between time for treated beetles only. All control comparisons are P > 0.30. All df = Inf.
| Food | No Food | ||||||||
|---|---|---|---|---|---|---|---|---|---|
| Temperature | Contrast | Estimate | SE | z-ratio | P-value | Estimate | SE | z-ratio | P-value |
| 18°C | 24 h—48 h | −1.25 | 1 | −2.21 | 0.070 | −2.80 | 24504693 | 0.00 | 1.00 |
| 24 h—168 h | 2.44 | 1 | 4.69 | < 0.0001 | 4.91 | 17733956 | 0.00 | 1.00 | |
| 48 h—168 h | 1.19 | 0 | 3.90 | 0.0003 | 2.11 | 17733956 | 0.00 | 1.00 | |
| 22°C | 24 h—48 h | −1.01 | 1 | −1.73 | 0.19 | −0.69 | 1 | −0.56 | 0.84 |
| 24 h—168 h | 2.66 | 1 | 5.14 | < 0.0001 | 0.69 | 1 | 0.56 | 0.84 | |
| 48 h—168 h | 1.65 | 0 | 4.99 | < 0.0001 | 0.00 | 1 | 0.00 | 1.00 | |
| 27°C | 24 h—48 h | −1.10 | 0 | −5.94 | < 0.0001 | 36.53 | 17327434 | 0.00 | 1.00 |
| 24 h—168 h | 1.31 | 0 | 7.28 | < 0.0001 | 1.10 | 0 | 2.54 | 0.030 | |
| 48 h—168 h | 0.21 | 0 | 1.73 | 0.20 | 37.63 | 17327434 | 0.00 | 1.00 | |
| 32°C | 24 h—48 h | −0.24 | 0 | −1.87 | 0.15 | −0.66 | NaN | NaN | NaN |
| 24 h—168 h | 0.24 | 0 | 1.81 | 0.17 | −0.067 | 0 | −0.27 | 0.79 | |
| 48 h—168 h | −0.0075 | 0 | −0.061 | 1.00 | −0.73 | NaN | NaN | NaN |
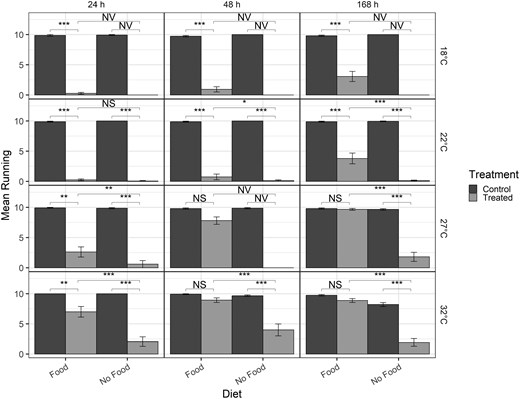
Bar graph of mean number of beetles running for post-exposure time points only (columns) for different temperatures (rows) with cooler temperatures at the top and warmer temperatures at the bottom row. Brackets indicate differences between specific treatments in the post-exposure time point. NS = not significant (P > 0.05), * = P < 0.01, ** = P < 0.001, *** = P < 0.0001, NV = no value (statistics could not be computed with log-values of 0).
Within diet treatments, when food was present at 27 °C or 32 °C, there were no significant differences in recovery after exposure to deltamethrin after 168 h in comparison to the control (Fig. 6). For all other temperatures and time points, treated individuals had lower numbers running compared to control. At cooler temperatures, food also had little impact on recovery after exposure to deltamethrin (Fig. 6, Table 8) and with no food present there were very few treated beetles running at any post-exposure time point. Differences in recovery were observed in all food treatments compared to no food treatments at all temperatures (Fig. 6), although specific statistics could not be calculated on the log-scale for comparisons at 18 °C and 48 h at 27 °C. At warmer temperatures, recovery was highest in food treatments after 168 h with nearly all beetles running in some cases, but without food, recovery was less than 5 beetles running at 168 h (Fig. 6).
For the model with all time points for the humidity assay, the 4-way interaction of treatment-diet-humidity-time was not significant, but the 3-way interaction between treatment-time-humidity was significant as well as treatment-diet-time (Table 9). Post-hoc marginal means showed no significant differences in number of beetles running until 75 min, with fewer treated beetles running in the remainder of the time points (Supplementary Table 1; Fig. 7).
ANOVA output from the negative binomial generalized linear model for number running for different humidity levels, food versus no food, treatment, and time. Full Model is for all exposure and post-exposure time points.
| Full Model, All Time Points | Post-exposure Time Points | |||||
|---|---|---|---|---|---|---|
| Chi-sq | Df | P-value | Chi-sq | Df | P-value | |
| Treatment | 1876.12 | 1 | < 0.0001 | 297.123 | 1 | < 0.0001 |
| Diet | 29.73 | 1 | < 0.0001 | 159.94 | 1 | < 0.0001 |
| Time | 1023.46 | 14 | < 0.0001 | 3.799 | 2 | 0.15 |
| RH | 0.86 | 2 | 0.65 | 3.635 | 2 | 0.16 |
| Treatment:Diet | 50.25 | 1 | < 0.0001 | 227.545 | 1 | < 0.0001 |
| Treatment:Time | 2499.95 | 14 | < 0.0001 | 2.593 | 2 | 0.27 |
| Diet:Time | 147.22 | 14 | < 0.0001 | 12.324 | 2 | 0.0021 |
| Treatment:RH | 3.54 | 2 | 0.17 | 1.097 | 2 | 0.58 |
| Diet:RH | 2.21 | 2 | 0.33 | 10.508 | 2 | 0.0052 |
| Time:RH | 31.31 | 28 | 0.30 | 22.354 | 4 | 0.00017 |
| Treatment:Diet:Time | 183.8 | 14 | < 0.0001 | 2.279 | 2 | 0.32 |
| Treatment:Diet:RH | 3.07 | 2 | 0.21 | 7.746 | 2 | 0.02 |
| Treatment:Time:RH | 52.07 | 28 | 0.0038 | 12.002 | 4 | 0.017 |
| Diet:Time:RH | 35.75 | 28 | 0.15 | 26.183 | 4 | < 0.0001 |
| Treatment:Diet:Time:RH | 36.84 | 28 | 0.12 | 20.739 | 4 | 0.00036 |
Line graph of mean number of T. castaneum running during and post-exposure to deltamethrin on concrete surface at different humidity treatments. Dashed line separates 0-180 min (during exposure) from > 24 h (post-exposure). Circles represent treatments with food present during recovery (24 h, 48 h, and 168 h) and X represents treatments with no food present during recovery. Labels on the right side of the graph correspond to each line of treatment, diet, and humidity.
For the analysis that included the post-exposure time points only (Fig. 8), all 4-way and 3-way interactions were significant, except treatment–diet–time (Table 9). With food present, there were significantly fewer beetles running at 30% humidity at 24 h but not at 48 or 168 h, no difference in the number of beetles running at 40% humidity, and fewer beetles running at 24 and 48 h at 60% humidity, but not at 168 h (Fig. 8). Between humidity treatments, the only significant differences occurred with no food at 168 h; for both control and treated beetles at 30% there were fewer beetles running compared to both 40% and 60% humidity (Table 10). All other comparisons with and without food did not differ between humidities (absolute z-ratio = 0 to 2.016, P > 0.1). Comparing between diet treatments, there were significantly fewer beetles running when no food was present at each post-exposure time point and humidity treatment (Fig. 8). In addition, at 30% humidity and 168 h, there were also significantly fewer control beetles running when no food was present compared to with food (z-ratio = 3.69, P = 0.0002; Table 11). Finally, the number of beetles running declined significantly with no food present at 30% humidity from 24 to 168 h for both control and treated beetles (Table 11).
Humidity Marginal Means, between humidities. All other comparisons for food, time, and treatment were not significantly different (P > 0.1). All df = Inf.
| No Food, 168 h | |||||
|---|---|---|---|---|---|
| Treatment | Contrast | Estimate | SE | z-ratio | P-value |
| Treated | 30–40% | −2.64 | 0.59 | −4.42 | <0.0001 |
| 30–60% | −3.03 | 0.59 | −5.12 | <0.0001 | |
| 40– 60% | −0.39 | 0.20 | −1.95 | 0.13 | |
| Control | 30–40% | −0.44 | 0.14 | −3.17 | 0.004 |
| 30–60% | −0.52 | 0.14 | −3.80 | 0.0004 | |
| 40–60% | −0.08 | 0.12 | −0.66 | 0.78 | |
Humidity Marginal Means, between Time Points. All other comparisons for food, humidity, and treatment were not significantly different (P > 0.64). All df = Inf.
| Treated | Control | |||||||||
|---|---|---|---|---|---|---|---|---|---|---|
| Diet/Humidity | Contrast | Estimate | SE | z-ratio | P-value | Contrast | Estimate | SE | z-ratio | P-value |
| No Food, 60% | 24 h—48 h | 0.10 | 0.22 | 0.45 | 0.89 | 24 h—48 h | 0.0067 | 0.12 | 0.058 | 0.99 |
| 24 h—168 h | 0.39 | 0.20 | 1.95 | 0.13 | 168 h—24 h | −0.045 | 0.12 | −0.41 | 0.91 | |
| 48 h—168 h | 0.49 | 0.21 | 2.38 | 0.046 | 168 h—48 h | −0.041 | 0.12 | −0.35 | 0.93 | |
| Food, 60% | 24 h—48 h | −0.16 | 0.14 | -1.18 | 0.47 | 24 h—48 h | 0.020 | 0.12 | 0.17 | 0.98 |
| 24 h—168 h | 0.35 | 0.13 | 2.62 | 0.024 | 168 h—24 h | −0.020 | 0.12 | −0.17 | 0.98 | |
| 48 h—168 h | 0.19 | 0.13 | 1.46 | 0.31 | 168 h—48 h | 0.00 | 0.12 | 0.00 | 1.00 | |
| No Food, 30% | 24 h—48 h | −0.31 | 0.21 | -1.47 | 0.31 | 24 h—48 h | −0.0067 | 0.12 | −0.058 | 0.99 |
| 24 h—168 h | −2.54 | 0.60 | -4.23 | 0.0001 | 168 h—24 h | −0.56 | 0.14 | −4.129 | 0.0001 | |
| 48 h—168 h | −2.85 | 0.59 | -4.80 | < 0.0001 | 168 h—48 h | −0.57 | 0.14 | −4.183 | 0.0001 |
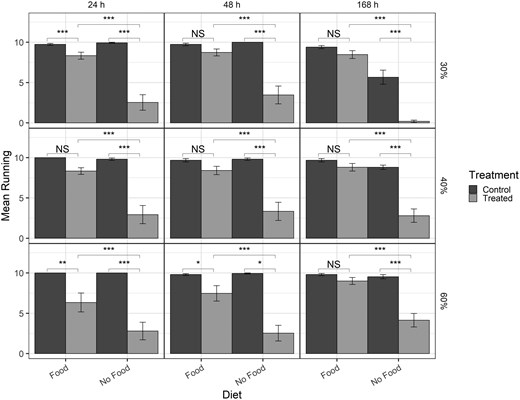
Bar graph of mean number of beetles running for post-exposure time points only (columns) for different humidities (rows) with lower humidity at the top and higher humidity at the bottom row. Brackets indicate differences between specific treatments in the post-exposure time point. NS = not significant (P > 0.05), * = P < 0.01, ** = P < 0.001, *** = P < 0.0001, NV = no value (statistics could not be computed with log-values of 0).
Discussion
Treatment with the contact insecticide deltamethrin, at an application rate less than the maximum allowable, effectively knocks down T. castaneum adults on concrete starting around 60 min of consistent exposure time, as observed in this and previous studies (Arthur 2018). The T. castaneum adults remain knocked down throughout a 3-h exposure time course. However, knockdown is a transitionary stage in which insect can either remain knocked down and eventually die or recover from this state (Arthur 2008, Campbell et al. 2014, Cato et al. 2019, Athanassiou et al. 2021). In this study, we showed that several factors influenced recovery from insecticide in the presence of food. For example, we found that even a small amount of food aid can lead to up to 90% (9 out of 10) of beetles recovering from insecticide exposure. Temperature had a large effect on recovery with cooler temperatures of 18 and 22 °C resulting in recovery of less than 50% even in the presence of food. Without food, the effect of temperature was exacerbated with nearly 0 beetles recovering at 18 and 22 °C. Comparatively, the presence of food had a greater influence than humidity on recovery as we observed 0% survival in beetles with no food at 30% RH.
Effective use of contact insecticides not only relies on proper application techniques, ensuring insects receive an adequate exposure to the insecticide but also environmental conditions after exposure. This is especially relevant in food facilities where insects may be moving around quickly and experience brief exposure periods to contact insecticides and often food facilities are fairly temperature regulated in ranges that are conducive to insect growth and development. Our study shows that insects can recover from being knocked down, even after 3 h of exposure to insecticides and that it takes at least 45 to 60 min of exposure to knock down T. castaneum adults. It is possible that a faster knockdown rate could be achieved at the maximum allowable application rate (44 ml). However, Arthur (2018) did not observe an increase in knockdown rate when application rate increased from 4 to 24 mg AI/m2. In field situations, it is possible that dispersing insects could encounter treated areas and leave them before they are knocked down, especially if the product is applied as a pre-bin treatment or barrier treatment near entryways or around pallets and the insect is passing through. Even if grain bins, elevator boots, and storage areas are cleaned to remove residual food debris, there are often resident populations of insects still present in such areas (Tilley et al. 2007, 2015, 2017). Tribolium castaneum have been observed spending more time in food patches compared to outside food patches (Campbell and Hagstrum 2002), thus if there was food present on a treated surface, it is expected the insects would spend extended periods of time on the treated surface, potentially increasing the efficacy of the insecticide treatment, a phenomenon that has been observed in previous studies with contact insecticides (Paudyal et al. 2016, Prazic-Golic et al. 2018). However, the presence of food could also aid in absorbing some of the insecticide off of the insect’s cuticle, surface, or dilute the effects of the insecticide (Ming et al. 2024). When no food is present there is nothing available to absorb insecticide as food is proposed to do and recovery is significantly reduced. In our experiment, when insects are moved away from the treated surface, we show that significant recovery occurs for T. castaneum, and significantly more so when food is present. In addition, recovery tends to increase from 24 h to 168 h regardless of whether food is present, suggesting that T. castaneum are able to detoxify this insecticide and its metabolites or it is removed from the cuticle and not absorbed into the insect at least to some degree.
Our results show similar trends to other work that has linked environmental conditions to recovery to insecticide exposure (Arthur 2000b, Athanassiou et al. 2008, 2017, Toews et al. 2010, Vassilakos and Athanassiou 2013, Gerken et al. 2021). For example, previous studies have shown that warmer temperatures also led to more recovery in T. castaneum (Gerken et al. 2021) and our results show that recovery is greatly enhanced at temperatures greater or equal to 27 °C compared to less than or equal to 22 °C. In addition, our results show that substrates that cause friction (sand in our case) and have no nutritional value, inhibit recovery from the knockdown state. Similar results have been observed in studies with diatomaceous earth, which also shows decreases in survival of these insects over time (Fields and Korunic 2000) due to the abrasive particles cutting into the insect’s cuticle resulting in water loss and desiccation. In addition, our study showed that only a small amount of food is needed for recovery. This is highly relevant for food facilities as Arthur et al. (Arthur 2000a) showed that insects can be collected from areas where there may be little amounts of food such as cracks and crevices. These results also reinforce the necessity for sanitation (Morrison et al. 2019) and maintaining clean environments especially if investing in chemical treatments, to get the most economic efficiency and impact from the applied treatments. Lastly, we found that the presence of food was what mostly impacted recovery at 40% and 60% humidity. At 30% humidity beetles did not survive well without food, as survivorship of control beetles even decreased. Humidity levels of 55% to 75% also had very little impact on insecticide efficacy in T. confusum (Kavallieratos et al. 2010, Vassilakos and Athanassiou 2013).
As environmental conditions in grain processing and storage facilities continue to change due to changing climates, understanding the impacts of temperature, humidity, and presence of food on recovery to insecticides is critically important. We show here a clear impact of the presence of any amount of food on the improved recovery compared to no food present as well as a delineation of the influence of higher temperatures (27 °C and 32 °C) on increased recovery and lower humidity (30%) and temperatures (18 °C and 22 °C) on reduced recovery. These parameters can provide managers of storage and processing facilities targets for best effectiveness of treatments in terms of environmental conditions. Reducing ambient temperatures and humidity in processing or storage arenas will reduce insect developmental times in general and will reduce recovery opportunities for insects exposed to a contact insecticide. In addition, residual insecticide applications are only one tool to control populations of stored product insects in such environments and additional treatments, such as aerosols, fumigations, trapping, or utilizing mating disruption, are needed to control stored product insects as part of an integrated pest management program. Continued understanding of the nutritional aspects associated with food is necessary to understand how that impacts recovery as well but some information is available to aid in developing new assays (Ming et al. 2024). Together, these results can help improve the efficiency and value of insecticidal treatments necessary to manage these populations within this aspect of our food supply chain.
Acknowledgments
We thank Brian Barnett and Ken Friesen for their help in preparing insects or collecting data points during this experiment. We thank Central Life Sciences for donating the Centynal insecticide used in this study. The use of trade names is for the purposes of providing scientific information only and does not constitute an endorsement by the United States Department of Agriculture. The USDA is an equal-opportunity employer and provider.
Author contributions
Alison Gerken (Conceptualization [Equal], Data curation [Equal], Formal analysis [Lead], Funding acquisition [Equal], Investigation [Equal], Methodology [Equal], Project administration [Equal], Resources [Equal], Supervision [Equal], Validation [Lead], Visualization [Lead], Writing—original draft [Lead], Writing—review & editing [Equal]), Rose Scott (Data curation [Equal], Investigation [Equal], Writing—review & editing [Equal]), Sonika Khosla (Data curation [Equal], Investigation [Equal], Writing—review & editing [Equal]), Alexus Markley (Data curation [Equal], Investigation [Equal], Writing—review & editing [Equal]), Codi Mueller (Data curation [Equal], Investigation [Equal], Writing—review & editing [Equal]), and Deanna Scheff (Conceptualization [Equal], Data curation [Equal], Formal analysis [Equal], Funding acquisition [Equal], Investigation [Equal], Methodology [Equal], Project administration [Equal], Resources [Equal], Supervision [Equal], Validation [Equal], Visualization [Equal], Writing—review & editing [Equal])
Funding
Support for this project was in house funding from USDA ARS Project Number 3020-43000-034-000-D.
Conflicts of interest. The authors declare no conflict of interest.
Data Availability
Data are available on Ag Data Commons through the National Agricultural Library at https://doi.org/10.15482/USDA.ADC/26798911.v1.
