


Abstract
Lethal bronzing (LB) and huanglongbing (HLB) are harmful plant diseases causing significant economic losses in Florida agriculture. Both diseases are caused by bacteria that are transmitted by Hemipteran insect vectors. Accurate detection of pathogens within insect vectors can help provide a better understanding of disease epidemiology. Monitoring of the vector of LB is done primarily using sticky traps within palm canopies. However, it is unknown how long pathogen and vector DNA remain intact under field conditions. If significant DNA degradation takes place over the course of days or weeks, there is a possibility of false negatives occurring when detecting pathogens from these surveys. This study determined how long Haplaxius crudus Van Duzee (Hemiptera: Cixiidae) and LB DNA could remain detectable on sticky traps under field conditions in Florida in winter and summer, using PCR and qPCR. Additionally, this study compared the DNA degradation of Diaphorina citri Kuwayama (Hemiptera: Liviidae) and Candidatus Liberibacter asiaticus (CLas), the causal agent of HLB. The results showed that DNA concentration and amplification rate declined as time on sticky traps increased. Degradation varied between different target genes. The amplification rate of insect genes from sticky trap samples suggests that sticky traps should be changed weekly in summer, and every 2 wk in winter for accurate H. crudus detection. Traps should be changed every 4 days for phytoplasma detection. Traps can be changed monthly for accurate D. citri and CLas detection. Based on these results, standard monitoring protocols can be implemented to more accurately detect vectors and pathogens.
Introduction
Monitoring for insect pests and pathogens is one of the most critical components of developing IPM programs. Because of this, having accurate data from these efforts is essential for mitigating the negative effects of the organism(s) in question. In Florida, 2 major epiphytotic diseases, lethal bronzing (LB) and huanglongbing (HLB) or citrus greening, have caused significant economic losses to the palm and orange industries, respectively, and threaten the long-term sustainability of these crops.
LB is a disease caused by the phytoplasma, ‘Candidatus Phytoplasma aculeata’ (Soto et al. 2021), and was first discovered in Canary Island date palms (Phoenix canariensis) in Texas, USA (McCoy et al. 1980). In 2006, LB was discovered along the west coast of Florida, where it infected Phoenix canariensis, P. dactylifera, P. sylvestris, and Syagrus romanozoffiana (Harrison et al. 2008). Currently, LB is widespread in Florida (Mou et al. 2022a) but has also been documented in Louisiana within the United States (Singh and Ferguson 2017) and is also known from Mexico (Narváez et al. 2017). Since the discovery of LB, it has been identified in over 20 species of palm (Mou et al. 2022a) and always results in the death of infected plants. The first symptoms of LB include premature fruit drop and flower necrosis, followed by the oldest leaves turning a bronze color. The bronze color progressively moves to younger leaves followed by spear leaf collapse representing death of the apical meristem (Harrison et al. 2002, Harrison and Elliot 2015). Palm death typically occurs 3–5 months after the initial symptoms begin (Harrison and Elliot 2015).
HLB disease was first described in China in 1929 (Zhao 1981), although reports of citrus dieback in India occurred as early as the 18th century (Capoor 1963). Currently, HLB has been found in over 50 countries worldwide (Ghosh et al. 2023). HLB was found in Miami-Dade County, FL, in 2005 (Halbert 2005). HLB is now present in every citrus-producing county in Florida (Alvarez et al. 2016). Since HLB was first reported in Florida, citrus acreage and yield have declined (USDA/NASS 2019, Singerman and Rogers 2020). Huanglongbing is associated with 3 species of bacteria: Candidatus Liberibacter asiaticus (CLas), Ca. L. americanus, and Ca. L. africanus (Bové 2006). Of these species, CLas is the associated pathogen of HLB in the United States (Graham et al. 2020). In the United States, the vector of CLas is the Asian citrus psyllid, Diaphorina citri Kuwayama (Hemiptera: Liviidae). Symptoms of HLB include the development of yellow shoots and leaves that are mottled with green and yellow patterns (McClean and Schwarz 1970). Other plant symptoms include corky veins, leaf drop, twig dieback, and excessive fruit drop (McClean and Schwarz 1970, Gottwald et al. 2007). Fruits from infected trees are abnormal in shape, may remain green when ripe, and have aborted seeds (Gottwald et al. 2007). The fruit is also smaller and inedible, with bitter juice (Bassanezi et al. 2009, Hall and Gottwald 2011). Ultimately, CLas infection results in tree death.
Potential vectors of LB were first determined by conducting population surveys in areas of Florida with LB-infected palms. Haplaxius crudus Van Duzee (Hemiptera: Cixiidae), Ormenaria rufifascia Walker (Hemiptera: Flatidae), and Omolicna joi Wilson et al. (Hemiptera: Derbidae) were the most abundant species in these locations, suggesting they may be possible vectors (Halbert et al. 2014). Haplaxius crudus was previously shown to vector ‘Candidatus Phytoplasma palmae’, which is closely related to ‘Ca. P. aculeata’ (Howard et al. 1983). Unlike other insects, H. crudus appears to display a preference for phytoplasma-infected palms compared to healthy palms in field settings (Mou et al. 2020b). Haplaxius crudus collected from population surveys in Mexico and Florida tested positive for ‘Ca. P. aculeata’ (Narváez et al. 2018, Mou et al. 2020a). Subsequent transmission assays confirmed that H. crudus is the vector of ‘Ca. P. aculeata’ (Dzido et al. 2020, Mou et al. 2022b).
A population survey of potential insect vectors of LB was conducted at the Fort Lauderdale Research and Education Center (FLREC) in Davie, Florida. Two species of insects tested positive for ‘Ca. P. aculeata’, H. crudus (0.672%) and an unidentifiable Cicadellid (0.248%). However, it is unknown how accurate this percentage is due to the potential of DNA degradation on the traps under field conditions (Mou et al. 2020a). Traps were collected weekly in contrast to studies where insects were directly processed or stored in ethanol (Brown et al. 2006, Narváez et al. 2018) and yielded a higher percentage of phytoplasma positive insects. Sticky traps are often used for phytoplasma detection in H. crudus, though specimens collected from traps are often damaged or exposed to contaminants, potentially interfering with pathogen detection (Wentz et al. 2020). DNA degradation on sticky traps, to our knowledge, has not been assessed for H. crudus or D. citri and their associated pathogens under Florida field conditions. Degradation of insect DNA for D. citri was assessed under Texas field conditions using PCR (Villegas 2020). There was a daily decrease in insect DNA detection of 3.5% in the summer and 2.4% in the fall. The detection of CLas from insects on sticky traps was also assessed in this study. Researchers found that field conditions did not affect the detection of CLas. However, this assessment only took place in the spring. Different field conditions such as increased temperatures may affect the ability to detect pathogens from insect vectors on sticky traps (Villegas 2020). Assessments of DNA degradation in mealybugs (Daane et al. 2011) and diamond back moths (Uesugi et al. 2016) found that approximately 1 wk was the limit for reliable detection, while an assessment of the tomato leafminer moth could detect DNA reliably for up to 3 wk (Butterwort et al. 2022). These assessments varied in DNA extraction technique as well as the field conditions included. Understanding these rates of degradation can help to optimize sampling protocols in both systems and reduce false negatives that can arise from template loss. As a result, more effective management strategies can be implemented, minimizing economic losses as well as obtaining a better understanding of disease epidemiology.
The objective of this study was to assess the DNA degradation of 2 important insect vectors, H. crudus and D. citri, on sticky traps under Florida field conditions. Three different genes were selected for each species representing nuclear coding regions, ribosomal RNA genes, and mitochondrial genes to assess effect that copy number and physical nature of the location of different DNA types had on degradation rates. Finally, the effect on pathogen template degradation was also assessed by generating mock-infective specimens of H. crudus with LB, using H. crudus taken from LB-infected source plants, and using D. citri collected from CLas-infected source plants. The hypothesis of this study is that a measurable decrease in DNA will be observed on specimens in sticky traps placed under field conditions over time.
Materials and Methods
Insect/Pathogen Source and Degradation Experimental Setup
Adults of H. crudus were collected from Montgomery Botanical Collection (Coral Gables, FL, USA; 25°39ʹ40.96″N, 80°16ʹ40.81″W) and transported alive to FLREC where they were stored directly at −80 °C until placement on yellow sticky traps. Adults of D. citri were collected from an established colony on an HLB-positive host plant at the University of Florida Citrus Research and Education Center (Lake Alfred, FL, USA) and handled the same as H. crudus.
At the time of this study, it was unknown how to generate phytoplasma-infected insects. To simulate LB-infective insects, 3 g of trunk tissue was collected from LB-infected cabbage palms (Sabal palmetto) located at FLREC using the protocol described in Bahder and Helmick (2018) and subsequently mixed in 100% ethanol. Using a pipette, 1 µl of solution was injected into the body cavity before being placed on the yellow sticky trap. The adults of D. citri collected from the colony had previously been maintained on CLas-infected ‘Valencia’ sweet orange (Citrus sinensis). The infection status of the palm used was confirmed using the assay outlined by Bahder et al. (2017).
Degradation experiments were initiated on 25 January 2021 with 50 adults of H. crudus and 50 adults of D. citri placed on separate yellow sticky traps. Traps were subsequently placed in the field, with the H. crudus trap placed within the lower canopy of a Syagrus romanzoffiana palm (26°05ʹ03.4″N, 80°14ʹ14.1″W) and the D. citri placed within the lower canopy of an unidentified citrus tree (26°05ʹ11.4″N, 80°14ʹ19.8″W) at FLREC (Fig. 1). Sticky traps were placed in the lower canopy because that is where we typically place the traps for monitoring H. crudus. That way, we can make recommendations on how often traps should be changed according to our current monitoring protocol. Five individuals of each species were removed daily and total DNA was extracted for a total of 7 days. Five individuals were also removed and processed weekly for the subsequent 3 wk. Five adults of H. crudus and 5 adults of D. citri were collected and processed immediately after killing to serve as a baseline to assess DNA yield from specimens. This experiment was replicated in July 2021 to account for differences in temperature and humidity as a result of different seasonal weather conditions. Subsequent research found that H. crudus could successfully acquire ‘Ca. P. aculeata’ after feeding on an infected palm spear leaf with an acquisition access period of 2 days or more (Mou et al. 2022b). Therefore, the summer experiment included an additional group of H. crudus, which acquired the phytoplasma by feeding on the spear leaf of an LB-infected S. palmetto for 4 days. Temperature and relative humidity were recorded using HOBO Temperature/RH Data Loggers (Onset Computer Corporation, Bourne, MA). Temperature and relative humidity were recorded every 30 min for the duration of the winter and summer experiments.
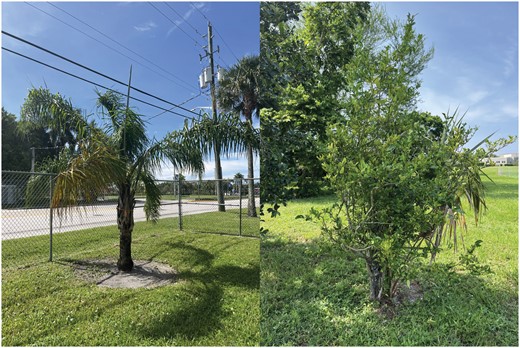
Sticky traps with Haplaxius crudus were tied to a Syagrus romanzoffiana palm (left). Sticky traps with Diaphorina citri were tied to an unidentified citrus tree (right).
Nucleic Acid Preparation
DNA extraction was performed using the DNeasy Blood and Tissue kit (Qiagen, Hilden, Germany). The manufacturer’s instructions were used, but without grinding the specimens, and using a lysis time of approximately 18.5 h. Each DNA sample was quantified using the NanoDrop Lite Spectrophotometer (ThermoFisher Scientific, Inc). Then, each sample was evaporated to 50 μl using the Savant DNA 120 speedvac concentrator (Thermo Scientific, Asheville, NC).
To determine whether DNA degradation varies between different target genes, 3 different coding regions were selected for each insect species. For both H. crudus and D. citri, the Cytochrome c Oxidase subunit I (COI) gene was chosen to represent a mitochondrial target. For both species, the 18S rRNA gene was chosen to represent a ribosomal target. The histone 3 (H3) gene and the wingless gene were chosen to represent a nuclear target for H. crudus and D. citri, respectively. All primer sets and probes used are listed in Table 1.
Primers and primer-specific PCR parameters used to obtain molecular data to measure DNA degradation of insect vectors and associated pathogens
| Primer | Target sequence | Sequences | Annealing | Extension | Reference |
|---|---|---|---|---|---|
| COI_D1Fa | Insect COI gene | (5ʹ-GGAACWATAAGAAGWATAATYATYCG-3ʹ) | 52 °C | 1 min 30 s | Humphries et al. (2021) |
| COI_2195_RCa | (5ʹ-ACTTCTGGATGACCAAAAAATCAA-3ʹ) | ||||
| 18SFIb | Insect 18S gene | (5ʹ-ACTGTCGATGGTAGGTTCTG-3ʹ) | 50 °C | 2 min | Bahder et al. (2019) |
| 18SRIb | (5ʹ-GTCCGAAGACCTCACTAAA-3ʹ) | ||||
| H3F1a | Insect H3 gene | (5ʹ-CAGACGGCBMGKAARTCSACC-3ʹ) | 58 °C | 30 s | Echavarria et al. (2021) |
| H3R1a | (5ʹ-GTKACHCKCTTRGCGTGRAT-3ʹ) | ||||
| Dcitri COI Lc | Insect COI gene | (5ʹ-AGGAGGTGGAGACCCAATCT-3ʹ) | 53 °C | 1 min | Boykin et al. (2012) |
| Dcitri COI Rc | (5ʹ-TCAATTGGGGGAGAGTTTTG-3ʹ) | ||||
| Wg Fc | Insect Wingless gene | (5ʹ-GCTCTCAAAGATCGGTTTGACGG-3ʹ) | 55 °C | 30 s | Li et al. (2008) |
| Wg Rc | (5ʹ-GCTGCCACGAACGTTACCTTC-3ʹ) | ||||
| secA614Fa | ‘Ca. P. aculeata’ secA gene | (5ʹ-GGWCGTCAATTTAGYGAWGG-3ʹ) | 55 °C | 5 s | Bloch et al. (2022) |
| secA759Ra | (5ʹ-GCMGTTCCYGTCATTCCTGA-3ʹ) | ||||
| Las Fc | CLas 16S gene | (5ʹ-TCGAGCGCGTATGCAATACG-3ʹ) | 60 °C | 1 min | Li et al. (2006) |
| Las R (16Sr)c | (5ʹ-GCGTTATCCCGTAGAAAAAGGTAG-3ʹ) | ||||
| HLBp (Las probe)c | (5ʹ-AGACGGGTGAGTAACGCG-3ʹ) |
aHaplaxius crudus only.
bHaplaxius crudus and Diaphorina citri.
cDiaphorina citri only.
All standard PCR assays were performed on a Bio-Rad T100. Products were visualized on 2% agarose gels stained with GelRed (Biotium, Hayward, CA). Standard PCR for COI, H3, and 18S for H. crudus was performed in volumes of 25 µl, comprised of 8.8 μl of UltraPure Water, 5 μl of 5× GoTaq Flexi Buffer, 2.5 μl of MgCl2 (25mM), 0.5 μl of dNTPs (10 mM), 0.5 μl of forward primer (10uM), 0.5 μl of reverse primer (10 uM), 5 μl of PVP-40 10%, 0.2 μl of GoTaq G2 Flexi Polymerase, and 2 μl of tDNA. Reaction mixtures for COI and 18S for D. citri had the same reagent concentrations as those in H. crudus.
HRMA reactions for detection of the wingless gene for D. citri were performed in volumes of 25.5 µl and were comprised of 12.5 μl SsoFast EvaGreen Supermix with Low ROX (Bio-Rad), 1.5 μl of forward primer (2 µM), 1.5 μl reverse primer (2 µM), 9 μl PVP-40, and 1 µl of tDNA. Thermal cycling conditions were as follows: initial denaturation 2 min at 95 °C followed by 35 cycles of denaturation for 30 s at 95 °C, annealing for 30 s at 55 °C, and extension for 30 s at 72 °C. The conditions for the melt curve were as follows: 95 °C for 15 s, 60 °C for 1 min, step and hold detection to 95 °C reading at 0.1 °C intervals.
To test insects for ‘Ca. P. aculeata’, we used an HRMA assay which amplifies the secA gene (Table 1). Concentrations and parameters for amplification follow those outlined by Bloch et al. (2022). Quantitative PCR (qPCR) reactions for detection of the CLas 16S gene were performed in volumes of 25.5 µl and were comprised of 12.5 μl TaqMan Universal Master Mix II (Applied Biosystems), 1.5 μl of forward primer (2 µM), 1.5 μl reverse primer (2 µM), 3 μl HLB probe (1 µM), 6 μl PVP-40, and 1 µl of tDNA. Thermal cycling conditions were as follows: 1 cycle at 95 °C for 10 min followed by 35 cycles of 95 °C for 15 s and 60 °C for 1 min. Primers and probes used for CLas detection were published by Li et al. (2006).
Statistical Analysis
Statistical analyses were performed using R version 4.0.3 (R Core Team 2022) with Rstudio 2023.03.0 ‘Cherry Blossom’ (Rstudio Team 2020). Generalized linear models (GLM) with Gamma distribution with an inverse link function were used to assess the effects of time and season on DNA concentration for each species (injected H. crudus, fed H. crudus, or D. citri). In these models, DNA concentration was the response variable. The predictor variables were time on the sticky trap (continuous variable), season (2 levels: winter or summer), and the interaction of time and season.
For each insect group, the effects of time, insect gene, and season on amplification success rate were assessed using GLM with binomial distribution. In these models, the amplification rate (success or failure) was the response variable. For injected H. crudus amplification, the predictor variables were time on the sticky trap (continuous variable), target gene (3 levels: COI, H3, or 18S), and season (2 levels: winter or summer). For fed H. crudus amplification, the predictor variables were time on the sticky trap (continuous variable), target gene (3 levels: COI, H3, or 18S), and the interaction of time and target gene. For D. citri amplification, the predictor variables were time on the sticky trap (continuous variable), target gene (3 levels: COI, wingless, or 18S), season (2 levels: winter or summer), and the interactions of time, target gene, and season. For the GLM models, analysis of deviance tables and P-values were calculated using the Anova function in the car package (Fox and Weisberg 2019). The estimated amplification success rates and confidence intervals were calculated using the emmeans function in the emmeans package (Lenth 2021).
Results
Environmental Conditions and Total DNA Concentration
For both the H. crudus and D. citri winter trials, average daily temperature ranged from about 13 to 26 °C (Fig. 2). Relative humidity ranged from about 60% to 89% (Fig. 2). During the summer trials, average daily temperature ranged from about 25 to 29 °C (Fig. 2). Relative humidity ranged from about 78% to 92% (Fig. 2).
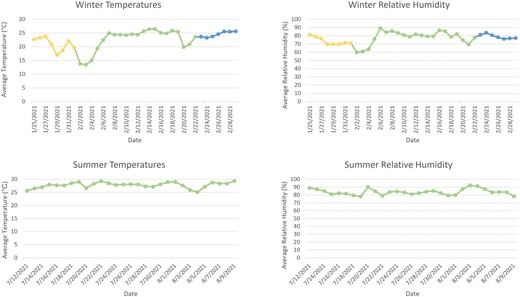
Average daily temperature (°C) and relative humidity (%) for winter and summer experiments. In winter, the duration of Haplaxius crudus on the sticky trap is shown in yellow and green, while the duration of Diaphorina citri on the sticky trap is shown in green and blue.
For H. crudus, DNA concentration decreased over time on the sticky traps in both seasons for both the injected group and the fed group (Fig. 3). Average initial concentrations were similar for phytoplasma-injected insects for both the winter and summer trials, with values of 34.44 and 31.08 ng/μl, respectively. However, after 4 wk on the traps, the average winter concentration dropped from the initial value by approximately 58%, while the average summer concentration dropped by approximately 77%. The DNA concentration for the phytoplasma-injected H. crudus was significantly affected by number of days on the sticky trap (P < 0.0001) and the interaction of time with season (P = 0.000595), but not by season alone (P = 0.975511, Table 2).
Analysis of concentration affected by time on the sticky trap and season; Cr = H. crudus that were injected with phytoplasma, FCr = H. crudus that fed on the infected spear leaf, and ACP = D. citri.
| Group | Predictor | Estimate | SE | t-value | P-value |
|---|---|---|---|---|---|
| Cr | Time | 0.0059356 | 0.0007783 | 7.626 | <0.0001 |
| Season | 0.0001398 | 0.0045437 | 0.031 | 0.975511 | |
| Time × Season | −0.0032492 | 0.000917 | −3.540 | 0.000595 | |
| FCr | Time | 0.007195 | 0.001283 | 5.608 | <0.0001 |
| ACP | Time | 0.008686 | 0.001092 | 7.956 | <0.0001 |
| Season | 0.021602 | 0.008690 | 2.486 | 0.0144 | |
| Time × Season | −0.009322 | 0.001193 | −7.817 | <0.0001 |
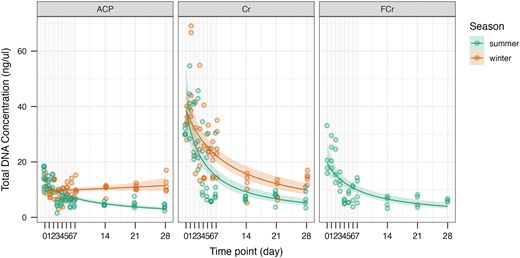
Total DNA concentration (ng/μl) over time on the sticky traps (days) for Diaphorina citri (ACP), injected Haplaxius crudus (Cr), and fed H. crudus (FCr) in the summer and winter. The line shows the probability of concentration over time estimated by the generalized linear model, and the ribbon shows the 95% confidence interval.
The average initial concentration for the fed H. crudus samples was noticeably lower than those that were injected, with a value of 21.85 ng/μl. At 4 wk on the traps, the average concentration dropped by approximately 72%. The concentration for the fed H. crudus was also significantly affected by days on the sticky trap (P < 0.0001, Table 2).
For D. citri, DNA concentration over time noticeably differed between the 2 seasons (Fig. 3). Initially, average concentrations were similar for winter and summer, with values of 12.60 and 14.63 ng/μl, respectively. After 4 wk on the trap, the average concentration for winter dropped by less than 5%. However, the GLM estimated a slight increase in DNA concentration over time for winter samples (Fig. 3). For summer, the average concentration dropped by about 75%. The DNA concentration for D. citri was significantly affected by number of days on the sticky trap (P < 0.0001), the season (P = 0.0144), and the interaction of days on the sticky trap with season (P < 0.0001, Table 2). All measurements of DNA concentration (yield and purity) for all specimens are presented in Supplementary Table 1.
Insect DNA Amplification
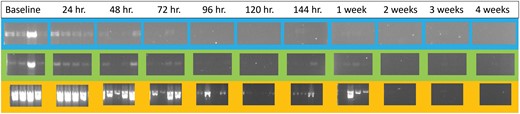
For injected H. crudus, all trials were 100% positive for the COI gene for the baseline and 24-h samples. However, inconsistent amplification began at 72 h in trials for summer (4/5 amplified) and 96 h for winter (4/5 amplified; Figs. 4 and 5) . Injected H. crudus were 100% positive for the H3 gene for the baseline samples. Inconsistent amplification began at 24 h for summer (4/5 amplified) and 48 h for winter (3/5 amplified; Figs. 4 and 5). Trials were 100% positive for the 18S gene for the baseline and 24-h samples. Inconsistent amplification began at 48 h for summer (4/5 amplified) and 120 h for winter (4/5 amplified; Figs. 4 and 5). Amplification rate was significantly affected by time on the sticky trap (P < 0.0001), target gene (P < 0.0001), and season (P < 0.0001, Table 3).
Analysis of deviance table of the generalized linear model. This analysis shows the effects of time on the sticky trap, target gene, and season on amplification success rate of the injected H. crudus samples
| Predictor | LR χ2 value | df | P-value |
|---|---|---|---|
| Time | 113.296 | 1 | <0.0001 |
| Gene | 49.420 | 2 | <0.0001 |
| Season | 42.383 | 1 | <0.0001 |
| Predictor | LR χ2 value | df | P-value |
|---|---|---|---|
| Time | 113.296 | 1 | <0.0001 |
| Gene | 49.420 | 2 | <0.0001 |
| Season | 42.383 | 1 | <0.0001 |
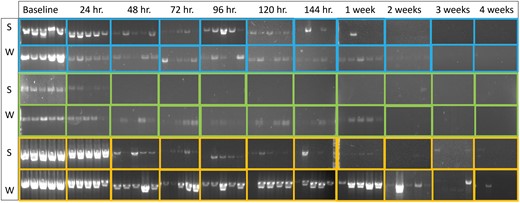
Agarose gels of the injected Haplaxius crudus samples in summer (S) and winter (W) experiments, from baseline to 4 wk on the sticky trap. COI products are shown in blue, H3 products are shown in green, and 18S products are shown in yellow.
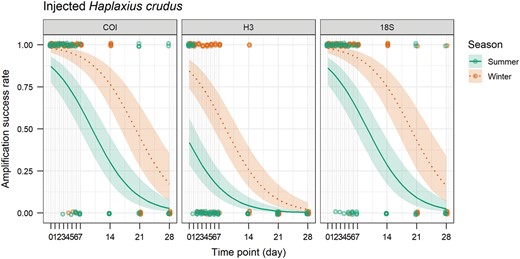
Amplification success rate of the COI, H3, and 18S genes over time (days) on sticky trap for injected Haplaxius crudus in summer and winter. The line shows the probability of amplification success rate estimated by the generalized linear model and the ribbon shows the 95% confidence interval.
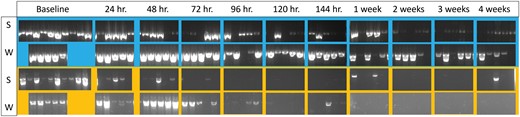
For fed H. crudus, samples were 100% positive for the COI gene for the baseline and 24-h samples. However, inconsistent amplification began at 48 h (2/4 amplified; Figs. 6 and 7). Fed H. crudus were 100% positive for the H3 gene for the baseline samples. Inconsistent amplification began at 48 h (3/4 amplified; Figs. 6 and 7). For the 18S gene, samples were 100% positive for the 18S gene for the baseline and 24-h samples. Inconsistent amplification began at 96 h (3/4 true positives; Figs. 6 and 7). The amplification rate was significantly affected by time on the sticky trap (P < 0.0001), target gene (P < 0.0001), and the interaction of time and target gene (P = 0.023, Table 4).
Analysis of deviance table of the generalized linear model. This analysis shows the effects of time on the sticky trap, target gene, and the interaction of time and target gene on amplification success rate of the fed H. crudus samples
| Predictor | LR χ2 value | df | P-value |
|---|---|---|---|
| Time | 68.325 | 1 | <0.0001 |
| Gene | 26.428 | 2 | <0.0001 |
| Time × Gene | 7.545 | 2 | 0.023 |
| Predictor | LR χ2 value | df | P-value |
|---|---|---|---|
| Time | 68.325 | 1 | <0.0001 |
| Gene | 26.428 | 2 | <0.0001 |
| Time × Gene | 7.545 | 2 | 0.023 |
Agarose gels of the fed Haplaxius crudus samples from baseline to 4 wk on the sticky trap. COI products are shown in blue, H3 products are shown in green, and 18S products are shown in yellow.
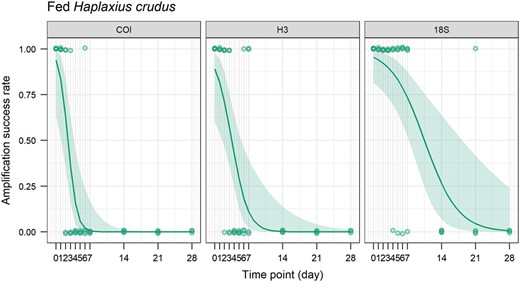
Amplification success rate of the COI, H3, and 18S genes over time (days) on sticky trap for fed Haplaxius crudus. The line shows the probability of amplification success rate estimated by the generalized linear model and the ribbon shows the 95% confidence interval.
Amplification of the 18S gene declined at the slowest rate among the 3 insect genes evaluated for H. crudus, with bands visible for the majority of samples in both injected and fed groups after 1 wk on the sticky traps. COI was less reliable. The majority of injected samples had visible bands for up to 2 wk, but for the fed H. crudus, few bands were visible after just 2 days on the trap. Similarly, H3 amplification declined quickly in both injected and fed H. crudus groups. For the injected group, the majority of samples had visible bands for up to 24 h. For the fed group, the majority of samples had visible bands for up to 48 h on the trap.
Diaphorina citri samples were 100% positive for the COI gene for the baseline and 24-h samples. Inconsistent amplification began at 48 h for summer (4/5 amplified) and 96 h for winter (4/5 amplified), but the majority of samples still amplified as time on the sticky trap progressed. At 4 wk on the sticky traps, D. citri samples were 80% positive for both seasons (Figs. 8 and 9). Diaphorina citri trials were 100% positive for the wingless gene for the baseline and 24-h samples. Like the COI gene, inconsistent amplification began at 48 h for summer (4/5 amplified) and 96 h for winter (4/5 amplified), but amplification was relatively consistent over time (Table 5 and Fig. 9). At 4 wk on the traps, 100% of samples were positive in summer and 60% of samples were positive in winter. Trials were 100% positive for the 18S gene for the baseline samples. Inconsistent amplification began at 24 h for summer (3/5 amplified) and 72 h for winter (4/5 amplified, Figs. 8 and 9). The amplification rate was significantly affected by time on the sticky trap (P < 0.001) and target gene (P < 0.0001), but not season alone (P = 0.540038, Table 6).
Amplification and melt-curve analysis data for the D. citri wingless gene
| Time point | Winter | Summer | ||
|---|---|---|---|---|
| Avg. Ct (±SE) | Avg. Tm (±SE) | Avg. Ct (±SE) | Avg. Tm (±SE) | |
| Baseline | 29.32 ± 1.1 | 79.96 ± 0.0 | 26.98 ± 0.9 | 80.11 ± 0.0 |
| 1 day | 26.74 ± 0.8 | 80.02 ± 0.0 | 26.38 ± 1.7 | 80.08 ± 0.0 |
| 2 days | 25.31 ± 0.2 | 79.99 ± 0.0 | 26.09 ± 1.2 | 80.14 ± 0.0 |
| 3 days | 25.70 ± 1.0 | 80.02 ± 0.0 | 27.02 ± 1.4 | 77.25 ± 4.1 |
| 4 days | 28.12 ± 0.9 | 76.23 ± 3.8 | 28.24 ± 1.5 | 80.17 ± 0.0 |
| 5 days | 28.33 ± 0.9 | 80.02 ± 0.0 | 28.40 ± 0.7 | 72.59 ± 4.6 |
| 6 days | 27.20 ± 0.5 | 79.80 ± 0.0 | 28.05 ± 1.1 | 80.29 ± 0.0 |
| 1 wk | 28.86 ± 0.8 | 80.14 ± 0.0 | 25.22 ± 1.1 | 80.11 ± 0.0 |
| 2 wk | 29.50 ± 1.6 | 76.26 ± 3.7 | 30.30 ± 1.9 | 76.50 ± 3.8 |
| 3 wk | 30.31 ± 0.8 | 80.14 ± 0.0 | 30.56 ± 1.2 | 79.84 ± 0.1 |
| 4 wk | 30.10 ± 2.0 | 76.17 ± 3.7 | 28.21 ± 0.6 | 80.26 ± 0.0 |
| (-) control – water | — | 61.34 | — | 61.34 |
Analysis of deviance table of the generalized linear model. This analysis shows the effects of time on the sticky trap, target gene, season, and the interactions of time and target gene, time and season, target gene and season, and time, target gene, and season on amplification success rate of the D. citri samples
| Predictor | LR X2 Value | df | P-value |
|---|---|---|---|
| Time | 27.740 | 1 | <0.0001 |
| Gene | 78.056 | 2 | <0.0001 |
| Season | 0.375 | 1 | 0.540038 |
| Time × Gene | 10.665 | 2 | 0.004831 |
| Time × Season | 11.659 | 1 | 0.000639 |
| Gene × Season | 6.673 | 2 | 0.035560 |
| Time × Gene × Season | 13.344 | 2 | 0.001266 |
Agarose gels of the Diaphorina citri samples in summer (S) and winter (W) experiments, from baseline to 4 wk on the sticky trap. COI products are shown in blue and 18S products are shown in yellow.
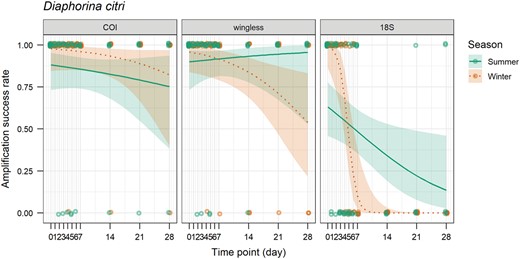
Amplification success rate of the COI, wingless, and 18S genes over time (days) on sticky trap for Diaphorina citri in summer and winter. The line shows the probability of amplification success rate estimated by the generalized linear model and the ribbon shows the 95% confidence interval.
Amplification of the COI gene declined the slowest among the insect genes evaluated from D. citri, with most bands on the gel representing insects collected from traps after 4 wk still visible. The 18S gene was the least reliable for the detection of D. citri. The majority of bands were visible for up to 48 h. The wingless gene had a similar rate of amplification to COI, with the majority of samples amplifying, even after 4 wk on the traps.
Pathogen DNA Amplification
Amplification of ‘Candidatus Phytoplasma aculeata’ was more variable with time on the sticky traps for both trials (Table 7). ‘Candidatus Phytoplasma aculeata’ genes amplified in all baseline samples of injected and fed H. crudus. However, the number of positive samples decreased starting at 24 (6/10 amplified) and 96 h (3/4 amplified) for the injected and fed groups, respectively. There were few positives from samples between 120 h and 2 wk for the injected group. There were also no positives in the samples on traps between 120 h and 2 wk for the fed group. However, the number of positives for both groups increased after these time periods. Overall, the fed group had a faster rate of decline in amplification when compared to the injected group.
Amplification and high-resolution melt-curve analysis data for the “Ca. P. aculeate” secA gene
| Timepoint | Winter Injected | Summer Injected | Summer Fed | |||
|---|---|---|---|---|---|---|
| Avg. Ct (±SE) | Avg. Tm (±SE) | Avg. Ct (±SE) | Avg. Tm (±SE) | Avg. Ct (±SE) | Avg. Tm (±SE) | |
| Baseline | 25.53 ± 1.1 | 73.22 ± 0.0 | 24.71 ± 0.1 | 73.44 ± 0.0 | 25.25 ± 0.2 | 73.37 ± 0.0 |
| 1 day | 26.17a | 74.84 ± 1.6 | 24.41 ± 0.7 | 73.53 ± 0.0 | 24.97 ± 0.1 | 73.32 ± 0.0 |
| 2 days | — | 73.25 ± 0.0 | 25.08 ± 0.3 | 73.53 ± 0.0 | 25.17 ± 0.2 | 73.35 ± 0.0 |
| 3 days | — | 73.25 ± 0.0 | 25.06 ± 0.4 | 73.55 ± 0.0 | 25.15 ± 0.2 | 73.35 ± 0.0 |
| 4 days | 19.8a | 74.99 ± 1.7 | 25.32 ± 0.2 | 73.58 ± 0.0 | 25.56 ± 0.2 | 73.42 ± 0.0 |
| 5 days | — | 73.25 ± 0.0 | 23.98a | 73.66 ± 0.1 | — | 73.50 ± 0.1 |
| 6 days | 12.10 ± 5.3 | 73.27 ± 0.0 | — | 73.64 ± 0.0 | — | 73.45 ± 0.0 |
| 1 wk | 17.73a | 73.22 ± 0.0 | — | 73.62 ± 0.0 | — | 73.41 ± 0.0 |
| 2 wk | 20.86a | 76.90 ± 2.3 | — | 73.68 ± 0.0 | — | 73.46 ± 0.1 |
| 3 wk | 15.58 ± 2.5 | 75.23 ± 5.2 | 24.27a | 73.702 ± 0.1 | 20.15a | 73.51 ± 0.1 |
| 4 wk | 16.01 ± 4.4 | 79.18 ± 4.1 | 25.62 ± 0.2 | 73.981 ± 0.0 | 24.15 ± 0.3 | 73.70 ± 0.0 |
| (-) control – water | — | — | — | — | — | — |
aOnly one sample amplified, thus no average or SE are presented, only Ct for successful reaction.
Very few CLas genes were amplified from D. citri samples. In winter, only 2 samples from different time points tested positive (Table 8). One was from the baseline and the other was from a sample collected after 72 h on the sticky trap. In summer, 5 samples tested positive (Table 8). These included 1 from 24 h, 1 from 72 h, 1 from 144 h, and 2 from 4 wk on the sticky trap.
Amplification data for the CLas 16S genesss
| Timepoint | Winter | Summer |
|---|---|---|
| Avg. Ct (±SE) | Avg. Ct (±SE) | |
| Baseline | 30.33a | — |
| 1 day | — | 27.71a |
| 2 days | — | — |
| 3 days | 26.23a | 29.97a |
| 4 days | — | — |
| 5 days | — | — |
| 6 days | — | 30.5a |
| 1 wk | — | — |
| 2 wk | — | — |
| 3 wk | — | — |
| 4 wk | — | 33.17 ± 1.7 |
| (-) control – water | — | — |
aOnly one sample amplified, thus no average or SE are presented, only Ct for successful reaction.
Discussion
This study was conducted to determine how long insect samples from sticky traps can be aged under field conditions before insect and pathogen DNA are no longer reliably detectable, using H. crudus and D. citri as models. Total DNA concentration declined more quickly in the summer trials than during the winter trials. These differences in concentration decline may be due to differences in weather conditions during the 2 seasons. The summer sticky traps were exposed to higher temperatures and relative humidity than the winter sticky traps. It is unknown why the GLM showed a slight increase in DNA concentration over time for the winter D. citri samples. One possible explanation is that as time on the sticky traps progressed, colonization by microorganisms increased (Butterwort et al. 2022). Alternatively, there may be a slight increase in concentration if more gravid females were sampled. Insects were not sexed during this study, potentially skewing the concentration data if more gravid females were randomly sampled.
For H. crudus insect DNA detection, it is typically recommended that sticky traps be changed every 2–4 wk. Here, the amplification rate was significantly affected by season, with lower rates for each insect gene in the summer. The current results indicate that for reliable H. crudus insect DNA detection, sticky traps should be changed at least weekly in summer, and every 2 wk in winter. The 18S primer set had the most reliable detection, while the H3 primer set had the least. The results also indicate that D. citri DNA can be reliably obtained from traps changed monthly when using COI or wingless primers for gene amplification. Season alone did not affect the amplification of D. citri genes, indicating that the timing of sticky trap changing does not need to change depending on the season.
There are a number of reasons why DNA detection may have varied with the different primer sets. Past studies have shown that the PCR success of degraded samples increases when the PCR target size decreases (Alonso et al. 2005, Butler et al. 2003, Uesugi et al. 2016). This was not observed in the results for H. crudus. Amplicons of the 3 insect primer sets varied in size, with 18S samples being the largest (about 1,400 bp) and H3 samples being the smallest (about 300 bp). The genes tested for each insect species were from 3 different organelles. The COI gene is mitochondrial, the 18S gene is ribosomal, and the H3 and wingless genes are nuclear. Studies have shown that genes of these different locations vary in detectability as they degrade over time and at different temperatures (Foran 2006). For qPCR of mammalian DNA, a mitochondrial gene was most readily detectable, followed by a nuclear gene, then followed by another nuclear gene (Foran 2006). This may be due to a variety of factors such as number of copies, chromatin structure, and location within the cell. Eukaryotic cells contain one nucleus, but numerous mitochondria and ribosomes. Since both mitochondria and ribosomes outnumber the nucleus in each cell, there are many copies of their genes, potentially prolonging the timeframe of positive detection. Additionally, each mitochondrion has one or more copies of mitochondrial DNA, making it generally more likely to have PCR success when compared to nuclear DNA. The modern mitochondrion may retain some resistance to host cell destruction from its predecessor, unlike the highly porous nucleus (Foran 2006). Mitochondrial DNA and nuclear DNA also differ in structure. Mitochondrial DNA is circular, while nuclear DNA is linear. This linearity can make nuclear DNA more prone to digestion by exonucleases. Differences in degradation between separate nuclear genes can be attributed to factors such as their different functions in the cell and how often they’re expressed. Genes that are only transcriptionally active within certain tissues are less vulnerable than those that are active in multiple parts of the body. This is because inactive genes are likely to remain in a histone-bound state (Foran 2006). Additionally, the wingless gene was tested using qPCR, which has increased sensitivity compared with standard PCR. This may have potentially increased detection of the wingless gene compared to the other genes tested.
The COI amplification was noticeably lower for fed H. crudus when compared with the injected H. crudus, but this was not the case for 18S and H3. It is unclear why amplification rate for the fed group was lower than the injected group. Perhaps the phloem and ethanol solution helped to preserve parts of the injected specimens. However, if that were the case, we would expect the same differences in amplification rate to occur for the 18S and H3 genes. Two different primer sets were used to detect the COI gene in H. crudus and D. citri, which explains the difference in COI amplification between the 2 species. For the 18S gene, the same primer set was used. Differences in amplification may be because H. crudus samples were often higher in DNA concentration than the D. citri samples. Additionally, D. citri are much smaller and more soft-bodied than H. crudus, which may cause them to be more susceptible to degradation (Butterwort et al. 2022).
UV exposure was not quantified during any of the trials. Previous studies have shown that UV radiation significantly impacts insect DNA detection on sticky traps, with more degradation occurring in the sun than in the shade (Uesugi et al. 2016). In the present study, when sticky traps were tied to the palm and citrus tree, orientation of the sticky traps was not considered. Difference in trap orientation between D. citri, injected H. crudus, and fed H. crudus may have affected the rates of DNA degradation due to differences in UV exposure. The palm and citrus were located approximately 290 m apart from each other, and there was likely more shade under the citrus tree. This difference in location also may have altered UV exposure between H. crudus and D. citri samples. Additionally, the palm that the traps were tied to was selected due to its short height and elongate leaves, making it easily accessible for daily sampling. This palm’s canopy was lacking in shade compared with palms that are typically used for monitoring H. crudus with sticky traps. Further studies should assess the detection of insect and pathogen DNA using traps that are tied in the same orientation, on palms which provide more shade.
Detection of ‘Ca. P. aculeata’ was highly variable overtime on the sticky traps. It is unknown what caused the sudden increase in detection of the phytoplasma at 3 and 4 wk. For the most reliable detection of ‘Ca. P. aculeata’, sticky traps should be changed every 4 days. This contrasts with prior recommendations to change the traps every week for phytoplasma detection. Amplification declined faster among the fed H. crudus as compared with the injected H. crudus in summer. Infections were originally simulated by injecting the mixture of palm trunk tissue and ethanol for the H. crudus samples due to it being unknown how to generate phytoplasma-infected insects. However, subsequent research found that H. crudus could successfully acquire ‘Ca. P. aculeata’ after feeding on an infected palm spear leaf with an acquisition access period of 2 days or more (Mou et al. 2022b). Simulating infections using infected trunk tissue may have exaggerated the values of DNA concentration and phytoplasma amplification. Indeed, the samples that had naturally acquired the phytoplasma had lower concentration and phytoplasma amplification than the injected samples. Haplaxius crudus for this study had an acquisition access period of about 4 days. However, the acquisition access period of H. crudus may vary in field settings. If the acquisition access period is shorter, this may cause a lower titer of phytoplasma to be present within the insects. Lower titers of phytoplasma may degrade faster on sticky traps, and therefore be more difficult to detect. It is possible that the phytoplasma needs more time to leave the insect gut, enter the salivary glands, and replicate. Lack of replication may make the pathogen less likely to be detected. Additionally, pathogens which remain in the gut rather than the salivary glands may degrade faster. Now that an established method to generate phytoplasma-infected H. crudus is available, further studies should be conducted to determine whether different acquisition access periods influence phytoplasma detection from vectors caught on sticky traps.
Detection of CLas was low in the winter and summer trials, even in the baseline samples. No positive samples were found in the baseline during the summer trials. Therefore, it is unknown whether samples taken from the sticky traps were negative due to degradation or because they simply did not acquire the pathogen. The infection rate of the psyllid colony ranges from 80% to 90% depending on the season, with lower rates of infection during the winter. Infection rate is determined by testing insects on a monthly basis using qPCR. Therefore, it is unknown why so few of the D. citri samples were positive compared to average infection rates of the colony. The infection rate of D. citri can be variable depending on time of year and pathogen distribution in the host. It’s possible that the random subgroups used in this study were feeding on plants with relatively low titers of CLas. Nevertheless, the summer trial showed that CLas is detectable within sticky trap samples for as long as 4 wk. These results coincide with the study by Villegas (2020), which found that time on the sticky trap was not correlated with CLas detection. Therefore, in addition to live-collected insects, it is possible to use D. citri collected from sticky traps for CLas testing, even in the summer. Aside from using sticky traps, D. citri used for CLas detection are typically collected via stem tapping or aspiration (Villegas 2020). These techniques require users to inspect and correctly identify D. citri on trees. In the case of stem tapping, surveyors must tap tree branches with a PVC pipe, a physically laborious process. In contrast, sticky traps are easy to set up and do not require initial inspection and identification of D. citri (Hall and Hentz 2010, Villegas 2020). The use of sticky traps to detect CLas in insects has been a cause for concern due to the possible degradation of DNA template (Villegas 2020, Wentz et al. 2020). However, the current results indicate that sticky traps can potentially serve as an additional tool for CLas detection.
The number of insect species capable of transmitting ‘Ca. P. aculeata’ is unknown. Haplaxius crudus has been confirmed as a vector for this phytoplasma (Dzido et al. 2020, Mou et al. 2022b). However, there are other species in the genus Haplaxius found on palms in the Caribbean. These other species have similar morphological features to H. crudus, but their status as vector is unknown (Barrantes et al. 2021). Accurate detection and identification of specimens are needed to monitor for insect vectors. Sticky traps provide a convenient method to monitor insect vectors without the use of physical labor. However, when insects are captured in sticky traps, physical damage adds to the difficulty of identification based on morphological features (Butterwort et al. 2022). Researchers can monitor populations of H. crudus while minimizing damage to specimens and false negatives in the data by implementing a standard protocol of weekly or bimonthly sticky trap sampling, depending on the season. This monitoring can allow for further understanding of the disease cycle, leading to the development of effective pest management.
There is room for improving the collection of insect vectors for molecular studies. Studies have shown improved pathogen detection from insect vectors caught in 3D-printed traps that contain a preservative when compared with insects caught in sticky traps (Wentz et al. 2020). However, sticky traps caught more target insects than 3D-printed traps, especially when target insect abundance was high (Horton et al. 2018). Future studies should compare H. crudus and phytoplasma DNA detection as well as trap counts from a 3D-printed trap with those from a sticky trap. The same can be done for D. citri and CLas.
Acknowledgments
The authors thank Brandon Di Lella, Maria Colmenares, and Kaitlin Gazdick for their technical assistance.
Funding
Funding for this research was provided through the FNGLA Endowed Research Fund.
Author Contributions
Melody Bloch (Conceptualization [Supporting], Data curation [Lead], Formal analysis [Supporting], Methodology [Supporting], Validation [Equal], Visualization [Equal], Writing – original draft [Lead], Writing – review & editing [Lead]), De-Fen Mou (Formal analysis [Lead], Methodology [Supporting], Software [Supporting], Validation [Equal], Visualization [Equal], Writing – original draft [Supporting], Writing – review & editing [Supporting]), Ericka Helmick (Data curation [Supporting], Methodology [Supporting], Resources [Lead], Supervision [Supporting], Writing – original draft [Supporting], Writing – review & editing [Supporting]), Kirsten Pelz-Stelinski (Conceptualization [Supporting], Methodology [Supporting], Project administration [Equal], Resources [Supporting], Supervision [Equal], Writing – original draft [Equal], Writing – review & editing [Equal]), and Brian Bahder (Conceptualization [Lead], Funding acquisition [Lead], Methodology [Equal], Project administration [Equal], Resources [Supporting], Supervision [Lead], Writing – original draft [Supporting], Writing – review & editing [Supporting])
