


Abstract
Recent work in biosensors has shown promise to enable high throughput searches through large genetic libraries. However, just as physiological limitations and lack of in-depth mechanistic knowledge can prevent us from achieving high titers in microbial systems; similar roadblocks can appear in the application of biosensors. Here, we characterized a previously developed transcription-factor (ExuR) based galacturonate biosensor for its other cognate ligand, glucuronate. Though we saw an ideal response to glucuronate from the biosensor in controlled and ideal experimental circumstances, these results began to deviate from a well-behaved system when we explored the application of the sensor to different MIOX homologs. Through modifications to circuit architecture and culture conditions, we were able to decrease this variation and use these more optimal conditions to apply the biosensor for the separation of two closely related MIOX homologs.
In this work, a transcription-factor biosensor was investigated for its potential to screen a library of myo -inositol oxygenase variants while seeking to mitigate the impact the production pathway appeared to have on the biosensor.

Illustration of the unequal demand for transcriptional and translational resources that the co-expression of biosensor and production plasmids can cause to a bacterial cell relative to their expression on a single plasmid.
Abbreviations
- TF,
transcription factor
- HTS,
high-throughput screening
- FACS,
fluorescence-activated cell sorting
- MI,
myo-inositol
- MmMIOX,
myo-inositol oxygenase from Mus musculus
- AtMIOX,
myo-inositol oxygenase from Arabidopsis thaliana
- FjMIOX,
myo-inositol oxygenase from Flavobacterium johnsinae
- RnMIOX,
myo-inositol oxygenase from Rattus norvegicus
Introduction
Through microbial production, it is possible to generate specialty chemicals, fuels, and many other products from more renewable sources than those commonly used in traditional chemical synthesis (Acevedo-Rocha et al., 2019; Chen et al., 2013; Keasling et al., 2021; Thakur et al., 2022). However, these processes often suffer from low titers, yields, and productivities (Aamer Mehmood et al., 2021; Liu & Nielsen, 2019; Ye et al., 2018). While it is possible to apply rational methods to generate improved titers of desired products (Chen et al., 2018; Liu H. et al., 2018; Liu et al., 2021), our ability to rationally engineer genetic systems is limited by our prior knowledge (Bassalo et al., 2016; Cobb et al., 2012). To bypass the need for such expertise, we can use directed evolution to seek out enzymes with improved characteristics in an outcome-oriented manner (Wang et al., 2021). Once a target gene with a desired functionality is identified, the genetic sequence can be randomized to create a large library that can be investigated to isolate superior enzyme variants. Ideally, directed evolution circumvents the need for detailed understanding of the sequence-function relationship, instead putting the focus on the development of screens or selections to find these new and improved enzyme variants with the desired phenotype (Packer & Liu, 2015).
Though conceptually straightforward, identification of individual cells containing the mutant enzymes responsible for an enhanced desired phenotype is often challenging as it requires distinguishing improvement within a library of mostly average and non-functioning variants (Porter et al., 2016). To add to this challenge, this sparsely populated sequence space is so vast that it cannot be completely covered for even a small enzyme (Packer & Liu, 2015). This means that to evolve an enzyme, it is necessary to have a robust method to scan through a significant number of library members—sometimes across many attempts and rounds if a single screen is not sufficient. As most desirable phenotypes are not conspicuous, their measurement can require laborious, time-consuming methods to quantify, making the search through a typical library intractable.
Transcription factor (TF)-based biosensors are able to bridge the gap between the desired and the detectable phenotypes to increase throughput in the search for improved enzymes. TFs are naturally occurring regulatory proteins that can drive the expression of a target gene in response to various environmental stimuli—including the presence or absence of a target molecule (Zhang et al., 2015). By using a TF that responds to the molecule of interest (or by modifying an existing TF to respond to this molecule [d'Oelsnitz et al., 2022; Kasey et al., 2018; Peters et al., 2018]), it is possible to relate the level of a desired product to an observable output. With the biosensor output acting as a proxy for improved production levels, high-throughput screening (HTS) methods like fluorescence-activated cell sorting (FACS) can be employed to detect improved intracellular production of a desired product, enabling greater coverage of the sequence space across a reasonable timeframe.
Though biosensors have the potential to enable HTS of a large number of genetic variants (Chen et al., 2015; Flachbart et al., 2019; Gao et al., 2022; Le et al., 2021), false positives often decrease the effectiveness of a screen. The noise at the single-cell level due to heterogeneity and the risk of product transport are two possible sources of false positives that can decrease the effectiveness of a sort (Flachbart et al., 2019; Trivedi et al., 2022). Further, the use of a biosensor necessitates that the measured quantity is only a proxy for the product yield while also adding a transcriptional regulation step between the generation of product and the output of a reporter gene. This adds additional layers of heterologous protein expression to the system, and the impact of genetic circuits on hosts and hosts upon the genetic circuits is challenging to know in advance (Arkin, 2008; Stanton et al., 2013). Further, cellular resources are limited, and these resources can become strained as additional proteins are expressed. When these limits are reached, the consequences can have a non-negligible effect on the expected outcome of a circuit (Ceroni et al., 2015; Gyorgy et al., 2015; Vind et al., 1993). All of these uncertainties present challenges that cannot be overlooked when characterizing a biosensor and finding the conditions for its successful application.
Here, we use a TF-based biosensor to isolate a variant of myo-inositol oxygenase (MIOX) with higher productivity out of a mixture of enzyme homologs with the ultimate goal of applying this tool to seek improvement in glucarate production in Escherichia coli. We chose to target MIOX, the second heterologous enzyme in a biosynthetic pathway for glucarate in E. coli (Moon et al., 2009a) (Fig. S1), since it has been shown to have the lowest enzymatic activity out of the three heterologous enzymes used in this pathway (Moon et al., 2009a). MIOX catalyzes the reaction to generate glucuronate from myo-inositol (MI), making glucuronate a suitable target for screening improvements in MIOX activity. This is the penultimate step in the pathway, and the transformation from glucuronate to glucarate—catalyzed by uronate dehydrogenase (Udh)—is catalytically efficient, such that improvements in glucuronate are highly likely transfer to improvements in glucarate.
In applying the biosensor, we found that the reporter output was strongly impacted by metabolic burden in the system and showed varying responses across our applied conditions. Accordingly, we modified our constructs and experimental approach in an attempt to minimize the burden. This resulted in a biosensor response that was much more reliable, though the inconsistent output was not fully resolved. We then demonstrated that the biosensor showed potential for screening improved variants out of a set of mixed MIOX homologs.
Materials and Methods
Strains and Media
All growth and production were done in Luria–Bertani (LB) broth (BD, Franklin Lakes, NJ) with appropriate antibiotics (50 µg/mL of kanamycin or 100 µg/mL of carbenicillin) for the plasmids in use as indicated in Table S1. All plasmids were cloned in DH5α chemically competent cells. Biosensor characterization and glucuronate production from MI were carried out in E. coli MG1655ΔgudDΔuxaC (1458) and MG1655ΔgudDΔuxaCΔexuT (1458ΔexuT). The gudD knockout prevents the consumption of glucarate (Shiue & Prather, 2014). Deletion of exuT from the chromosome was done using the λ-red-mediated recombination method using plasmid pKD13 (Datsenko & Wanner, 2000). The kan cassette (flanked by FLP recognition target sites) from the pKD13 plasmid was amplified using primers exuT-del-pKD13_fwd-1 & exuT-del-pKD13_rev-1 and exuT-del-pKD13_fwd-2 & exuT-del-pKD13_rev-2 (Table S2). There are two sets of primer sets as there were two successive amplifications to add the necessary homology arms for the genetic insertion. Strain 1458 harboring pKD46 was transformed with the knockout cassette to remove exuT. Following transformation, the kan selection cassette was cured of successful deletion mutants using FLP recombinase expressed from pCP20, generating strain 1458ΔT. To generate strain 972ΔT, we removed exuT from strain 972, which carried deletions in uxaC, gudD, endA, and recA (Table S2). Primers 1–36 and exuT-del-check_rev were used to amplify homology arms and the kanamycin selection cassette from the intermediate strain, 1458ΔexuT: KanR. This selection cassette was used to transform strain 972 (MG1655ΔrecAΔendAΔgudDΔuxaC) harboring plasmid pKD46. Following transformation, the kanamycin selection cassette was cured of successful deletion mutants using FLP recombinase expressed from pCP20, generating strain 972ΔT. Both exuT knockouts were verified using primers p1-36 and exuT-del-check_rev.
Cloning and Plasmid Construction
pHH-AtMIOX was constructed by amplifying AtMIOX from pTrc-AtMIOX-1 (see Table S2) with INS_R-pHH_AtMI and INS_F-pHH_AtMI. These primers amplified the region of interest while also adding nucleotides to the end of the amplicon that encoded SacI and SbfI digestion sites. The pHH-MmMIOX plasmid and amplicon were digested using SacI and SbfI restriction enzymes (NEB, Ipswich, MA) and ligated using T4 DNA ligase (NEB). pHH-FjMIOX and pHH-RnMIOX were created via HiFi DNA assembly. The FjMIOX insert was amplified from pTrc-FjMIOX (see Table S2) using Fj-MIOX-HiFi-fwd and Fj-MIOX-HiFi-rev, while RnMIOX insert was generated by amplifying a gblock (IDT, Coralville, Iowa) codon optimized for E. coli with primers RnMIOX-Amp-fwd and RnMIOX-Amp-rev. The pHH-MmMIOX plasmid was linearized with the corresponding overhangs that overlapped with the FjMIOX and RnMIOX inserts using pHH-MIOX_LIN-1 and pHH-MIOX_LIN-2. Sequence verification was done using primers SP1 and SP2.
Primers pCNJ23101_lin-1 and pCNJ23101_lin-2 were used to linearize plasmid P1OO for cloning via HiFi DNA Assembly, where the overhangs were designed to anneal to oligo J23101_ins. This generated biosensor plasmid pCNpJK101. Sequence verification was done with pCNpJK-seq-fwd and CP2.
Plasmids pJKN–xxMIOX and pJKN101–xxMIOX (where xx is the gene identifier Mm, At, Fj, or Rn) were constructed by linearizing the respective pHH-xxMIOX plasmid with primers pHH-pCN_LIN-1 and pHH-pCN_LIN-2 and amplifying the exuR–sfgfp genes from P1OO or pCNpJK with overhangs that corresponded to the linearized pHH-xxMIOX gene using primers pHH-pCN_exuRins-fwd and pHH-pCN_exuRins-rev. The insert from P1OO was used to create pJKN–xxMIOX plasmids, and the inset from pCNpJK was used to generate pJKN101–xxMIOX plasmids. To generate the plasmid from the two pieces, we used the NEBuilder HiFi DNA Assembly Cloning Kit (NEB). Sequence verification was done with p3-7 and p5-62, and the identity of the whole plasmid was verified using Plasmidsaurus (SNPsaurus, Eugene, OR).
All cloning amplification reactions were done using the Q5®High Fidelity Polymerase 2X Master Mix, and all sequencing verification reactions were done using OneTaq® 2X Master Mix (NEB, Ipswich).
Glucuronate Production and Fluorescence Measurements
Fluorescence measurements were taken throughout production runs in the BioLector microbioreactor system (m2p-labs GmbH, Baeweiler, Germany). Overnight cultures were grown at 30°C at 250 rpm. 10 µL of overnight culture was used to inoculate 1 mL of culture in a 48-deep-well FlowerPlate (m2p-labs). MI used for production and glucuronate used to generate standards for quantification were purchased from Sigma-Aldrich (St. Louis, MO). All glucuronate production was in LB medium. MI was always added to the desired concentration at inoculation, and the inducer, aTc (final concentration 50 ng/mL), was added either at inoculation or 4 hr after inoculation (the OD600 value of the cultures was between 0.8 and 1 during this time). BioLector conditions were 30°C, 1200 rpm, and 85% humidity. Every 20 min, both biomass (620 nm excitation) and GFP (488 nm excitation, 520 nm emission) measurements were recorded. All BioLector cultures were grown for 24 hr with a sample for glucuronate taken at the end of the culture time.
Glucuronate Quantification
Glucuronate was quantified using a modified form of the enzymatic assay from Moon et al. (2009b) This assay is based on the change in absorbance that occurs when NADH is formed from NAD+ in a 1:1 ratio with the conversion of glucuronic to glucaric acid via Udh (when NAD+ is in abundance). Briefly, 6 µL of culture supernatant was added to 194 µL of buffer containing NAD+ in a 96-well plate, and an initial absorbance reading at 340 nm was observed. Following this, purified Udh enzyme was added to each well, and after 30 min, the final absorbance reading was used to calculate the Δabs340. The absolute quantity of glucuronate in our samples was determined from a standard curve generated with standards of known concentration.
Cell Sorting of MmMIOX Versus RnMIOX and Preparation for Flow Cytometry
For cell sorting, colonies were grown at 30°C for 16 hr in LB and then used to inoculate a culture that contained substrate but no inducer at a dilution of 1:100 for both MmMIOX and RnMIOX monocultures. The co-culture was inoculated with the monoculture with the higher OD600 being inoculated at a 1:200 ratio, and the other culture was inoculated such that it was normalized to the same level based on relative OD600 values. After 4 hr of growth, aTc was added as previously described, and the culture was allowed to grow for 20 hr more for a total of 24 hr of growth prior to preparation for sorting. Directly before preparing the sample for sorting, a small amount of the culture was streaked out onto a solid medium with appropriate antibiotic to yield colonies to screen via PCR. The following day, 15 colonies were selected for screening via colony PCR to verify the ratio of MmMIOX: RnMIOX. The primers for this PCR were SP1 and SP2. This procedure was similarly followed to prepare our mixture of catalytically active and inactive MmMIOX for our flow cytometry work. A portion of the culture was washed twice and resuspended in PBS + 10% sucrose, and ∼3 × 10⁸ cells were then taken for sorting and/or flow cytometry in 1 mL 1X PBS.
All further steps will describe the cell sorting of MmMIOX and RnMIOX variants only. Sorting was gated first based on FSC-H versus SSC-H and SSC-H versus SSC-W to exclude cell debris. The gate for sorting was based on the GFP histogram. Roughly 12 000 cells were sorted and then allowed to recover at 37°C for 30 min prior to plating on the appropriate antibiotic overnight. Approximately 80% of the cells were plated from this sort (assuming this population would adequately represent the whole). After a night of incubation on solid medium, there were ∼4000 colonies on the plate, indicating a recovery of ∼40% of the cells. Ten colonies were selected at random from this plate for colony PCR using SP1 and SP2, and another 46 colonies were selected at random for growth in LB with the appropriate antibiotics in a 48-deep-well Flowerplate (m2p-labs) for a secondary screen in the BioLector. Following 16 hr of overnight growth, the cultures were inoculated (1:100 dilution) in fresh medium containing LB + 2.5 g/L MI with appropriate antibiotics. 4 hr into the culture, aTc (final concentration 50 ng/mL) was added to each individual well. Following aTc addition, the culture was continued for 20 hr for a total of 24 hr, with a sample to quantify glucuronate titers taken at the end and GFP measured continuously in the BioLector.
Results and Discussion
Biosensor Characterization for Glucuronate Detection
To improve glucuronate yields in E. coli, we aimed to develop an HTS tool to aid the search through a library of MIOX enzymes for an improved variant. This was facilitated by previous work in our lab in which a genetic circuit using ExuR from Bacillus subtilis was constructed to regulate pathways in response to the presence of galacturonate (Ni et al., 2021). Though Ni et al. characterized the biosensor in response to galacturonate, in published literature there is evidence that this TF also responds to glucuronate (Mekjian et al., 1999), making it an ideal candidate for a biosensor for improved glucuronate yields from MIOX.
The ExuR biosensor as designed by Ni et al. (2021), P1OO, constitutively expresses exuR using promoter BBa_J23117 from the Anderson promoter library (http://parts.igem.org/Promoters/Catalog/Anderson) and expresses sfgfp using a hybrid promoter based on the insulated proD promoter (Davis et al., 2011) with two ExuR binding sites (Fig. 1a). One operator is located in between the −10 and −35 σ70 RNA polymerase recognition sites, and the other is downstream of the −10 site. This configuration was found to have the lowest leakiness and the highest dynamic range (Ni et al., 2021). Upon binding to these two operators, ExuR will repress the sfgfp expression. This repression is relieved upon glucuronate binding to ExuR and changing its configuration such that ExuR releases from the DNA.
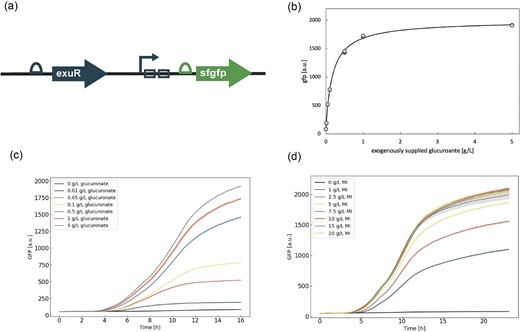
Biosensor circuit components and characteristic response. (a) Biosensor circuit design: the transcription factor, exuR, and the two ExuR operators (open rectangles), upstream of an sfgfp gene. The open semicircles are the ribosomal binding sites. (b) Hill curve fit (black line) generated from GFP measured at 16 hr as a function of the supplemented glucuronate concentration (gray dots) for two biological replicates. Inset represents the region where the GFP response is mostly linear. Both replicates from the experiment are shown in the plot. (c) Time course of GFP response for final values is shown in Fig. 1b (colors indicated in the legend). The range of the observed values is indicated by the shaded region around the line plots, where the line itself is an average of 2 points. (d) Time course of GFP response over a 24-hr time period for biosensor P1OO in response to glucuronate production from pHH-MmMIOX from a variety of myo-inositol substrate levels (colors indicated in the legend). Error is indicated by the shaded region around the line plots as represented by SD, n = 3.
To characterize the biosensor, we first demonstrated the capacity of P1OO for the in vivo detection of glucuronate by determining the dynamic and operational ranges. To ensure that the glucuronate would not be metabolized, all experiments were done in a uxaC knockout strain (strain 1458) as isomerization of glucuronate to fructuronate via UxaC is a key step in the catabolism of glucuronate (Ashwell et al., 1960). Increasing the level of glucuronate substrate yielded increasing GFP output with a dynamic range of ∼20-fold between fully activate and fully inactive P1OO (Fig. 1b). This range was comparable by order of magnitude to a number of other TF-based biosensor systems (Hanko et al., 2018; Liu C. et al., 2018; Ni et al., 2021; Siedler et al., 2014). The operational range of the biosensor spanned from 0.01 to 1 g/L glucuronate. Such values were reasonable for distinguishing improved variants at the levels of endogenous glucuronate production we could attain in our system. We further saw that these activation trends were consistent throughout the length of the culture, even as the rate of increase in fluorescence began to level off between 12 and 16 hr of culture depending on the level of glucuronate fed (Fig. 1c). The corresponding growth curves and validation of biosensor behavior at the single-cell level via FACS are shown in Fig. S2.
To verify a sufficient response to endogenous glucuronic acid, the biosensor was applied to detect glucuronate produced via MIOX from Mus musculus (MmMIOX) across a range of MI levels. Previous work from our lab has shown that expression of MIOX from single-copy integration into the genome would likely be too low for effective product formation and that production from MI was much more efficient than production from glucose (Moon et al., 2009a). Thus, to ensure there were adequate production levels to activate the biosensor, we used plasmid-based expression of MIOX in combination with P1OO (Fig. S3), using MI as the substrate. As MIOX expression is more efficient in the presence of MI, and we wanted to remain within the operational range of the biosensor (Fig. 1b), we used a low copy number plasmid where MIOX is expressed from an aTc-inducible promoter, named pHH-MmMIOX. The use of two plasmids would permit compartmentalization of the biosensor and production plasmids for ease and efficiency of library cloning in later work. Using this two-plasmid system, we observed dose–response behavior to endogenously produced glucuronate from the biosensor that followed an effectively linear output range across concentrations of glucuronate similar to that observed with exogenous addition (Fig. 1d).
Host Modifications for Effective Biosensor Application
While the previous characterization of the biosensor demonstrated its suitability in a bulk culture setting, an effective biosensor must enable the separation of high-performing library members at the single-cell level. Thus, we tested the behavior of our system using flow cytometry with the expectation of a clear bimodal fluorescence distribution for a mixture of producing and non-producing cells being activated and inactivated, respectively. To demonstrate this, we generated test libraries using a production plasmid producing a catalytically active enzyme, pHH-MmMIOX, and one leading to a catalytically inactive variant, pHH-MmMIOX(K127A) (MmMIOX with mutation K127A). We grew cells containing the biosensor and one of the two MmMIOX plasmid variants in the presence of 5 g/L MI as monocultures or as co-cultures, where the active and inactive variants were inoculated in a 50–50 ratio. This ratio was confirmed via colony PCR. Contrary to our expectation, we observed that within 8 hr, the culture that contained ∼50% inactive MIOX showed very little overlap with our fully inactive control (Fig. 2a). Further, the mixed culture showed the behavior of an almost fully activated biosensor by 12 hr (Fig. 2b). These results suggest that the biosensor can be activated by glucuronate imported from the surrounding culture medium and are corroborated by other reports that product transport can result in cheaters passing through a screening process. (Flachbart et al., 2019; Trivedi et al., 2022) This phenomenon would have severe impact on the effective sorting of mutants as they are presumably much closer in activity than the two groups examined here.
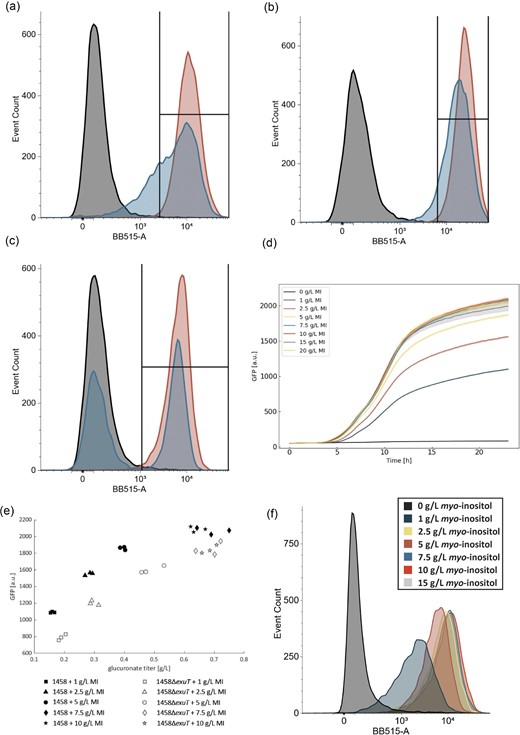
Impact of exuT presence and absence on the single-cell GFP distribution in response to glucuronate production. (a–b) Histograms of GFP for strain 1458 following 8 hr (a) or 12 hr (b) of growth and glucuronate production. The black histogram is the GFP from a negative control where MIOX is catalytically inactive, the red is the GFP distribution from the WT where MIOX is fully active, and the blue histogram is the GFP distribution for a culture that is 50% inactive and 50% active. (c) GFP histogram for strain 1458ΔexuT. The color scheme matches (a–b). The box inset into (a–c) indicates the relative percentage of catalytically inactive MIOX (black) and the mixed active/inactive culture (blue) that overlap with 99% of the active MIOX culture (red). (d) Time course GFP data over 24 hr for strain 1458ΔexuT containing production plasmid pHH-MmMIOX and biosensor plasmid P1OO. The corresponding dose–response curve is shown in Fig. 2e. Error is indicated by the shaded region around the line plots as represented by SD, n = 3. (e) GFP signal at 24 hr as a function of glucuronate titer for biosensor P1OO in strains 1458 (black-filled markers) and 1458ΔexuT (gray-filled markers). (f) Single-cell GFP distribution for strain 1458ΔexuT following 18 hr BioLector cultivation at a truncated range of myo-inositol levels. The colors of the histogram match those shown in the legend in (d). The corresponding time course data for this experiment is found in the supplementary information (Fig. S7).
In the literature, it has been shown that exuT is responsible for the import of glucuronate (Mata Gilsinger & Ritzenthaler, 1983; Suvorova et al., 2011) and so we targeted this gene for knockout using the lambda red protocol (Datsenko & Wanner, 2000), creating strain 1458ΔexuT. Upon the removal of exuT, we were able to observe the expected bimodal GFP distribution between active and inactive peaks in our co-culture experiment, indicating that the biosensor was able to distinguish between producing and non-producing cells after 8 hr of growth at the single-cell level when 5 g/L MI was supplied as substrate (Fig. 2c). We then verified that the biosensor in the knockout strain would display similar time course behavior when compared to the original biosensor characterization in strain 1458 (Figs 1d and 2d). We hypothesized that the knockout of exuT only prevented the importation and not the export of glucuronate, and would not strongly impact the biosensor response or product quantification levels. This hypothesis was verified as we saw that there was no response to exogenously provided glucuronate except for a very small signal at very high levels of substrate (Fig. S4) and that we could still quantify product generated from MIOX in the culture supernatant at levels similar to those in strain 1458 (Fig. 2e). We further observed that the biosensor showed a clear response at the single-cell level that followed the behavior seen in bulk culture (Fig. 2f).
The key observable difference when removing importation of glucuronate was a lower overall GFP output from the biosensor in response to the same level of glucuronate. It is possible that for the base strain (1458), intracellularly produced glucuronate could diffuse out into the culture medium to be taken up by neighboring cells, effectively activating sensors in more than one host cell, leading to higher fluorescence. This multi-cell activation was prevented in the knockout strain, likely leading to the lower levels of activation (Fig. 2e). The difference between the strains lessens as the production and fluorescence increases, possibly indicating that the higher GFP signal from product transport is less impactful as the sensor output approaches saturation.
Application of the Biosensor to Different MIOX Homologs
To investigate the biosensor's potential for distinguishing glucuronate levels produced from a library of MIOX enzymes, we applied it to detect the difference in production between homologs with varying productivities in E. coli. Specifically, we chose MIOX variants from Arabidopsis thaliana (AtMIOX), Flavobacterium johnsinae (FjMIOX), and Rattus norvegicus (RnMIOX), which shared 46%, 48%, and 96% sequence similarity to MmMIOX, respectively. FjMIOX and AtMIOX were chosen as previous work in our lab found that they generate different yields in Saccharomyces cerevisiae (Marques et al., 2020), and we believed it likely this would remain true in E. coli. RnMIOX was chosen due to its high sequence similarity to MmMIOX. These variants were similarly expressed from a pTet promoter in plasmids pHH-AtMIOX, pHH-FjMIOX, and pHH-RnMIOX, respectively.
Upon testing the response to production from these homologs, we found that the biosensor did not show a consistent dose–response. The most drastic loss of biosensor output was seen for variant AtMIOX, where the slope of linear dose–response was ∼15% of that observed with MmMIOX and RnMIOX—two variants that showed highly consistent behavior (Fig. 3a). Along with this dramatic decrease in GFP signal, there was also a clear decrease in growth rate (Fig. 3e) as well as a much higher output of glucuronate at each substrate level (Fig. 3a) relative to MmMIOX and RnMIOX.
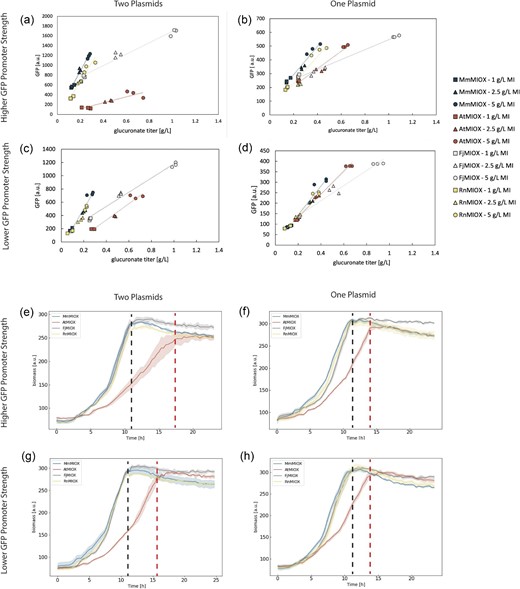
Dose–response curves from titer and fluorescence data taken at 24 hr for four different MIOX homologs in four different biosensor configurations. All three biological replicates are plotted for each test group, and the resulting fitted linear dose–response curve for the biosensor response to production from each homolog is shown. (a–d) The legend is shown to the right and indicates the appropriate markers for all figures. (a) Dose–response curve for the two-plasmid system (producer and sensor on separate plasmids) with the original P1OO biosensor. (b) Dose–response curve for the single-plasmid system pJKN-xxMIOX, where xx stands for each MIOX identifier. (c) Dose–response curve for the two-plasmid system with production plasmid and biosensor pCNpJK. (d) Dose–response curve for the single plasmid system pJKN101-xxMIOX, where xx stands for each MIOX identified. (e–h) Biomass time course progression over the 24 hr fermentation that generated the final data shown in (a–d) for the 5 g/L myo-inositol test group, which is representative of every other substrate level, including LB only. The color was chosen to represent each homolog matches (a–d). Error is indicated by the shaded region around the line plots as represented by SD, n = 3. The black dashed line indicates the time at which myo-inositol oxygenase from Mus musculus, myo-inositol oxygenase from Flavobacterium johnsinae, and myo-inositol oxygenase from Rattus norvegicus groups attain steady state, while the red line indicates the time at which AtMIOX attains steady-state growth. Biomass here is represented by 620 nm excitation and is a proxy for size.
Though AtMIOX was the only homolog with impaired growth when paired with the biosensor (Fig. 3e–h), it was not the only homolog that showed a different dose–response curve. When generating glucuronate in E. coli containing the biosensor and either pHH-FjMIOX or pHH-AtMIOX, we saw a clear decrease in the slope of the response curve and, for pHH-AtMIOX, a drastic decrease in the absolute GFP signal for a given product level. For AtMIOX in particular, there was a significant increase in glucuronate titers relative to cultures containing only the production plasmid (Fig. S5). These differences seem to suggest that the output from both the biosensor and production plasmids are influencing each other and the biosensor is dependent on the composition of the system to which it is applied, making it non-robust for screening a library of variants with low homology. Previous work has shown that seemingly individual genetic circuits can behave in a coupled manner due to the intra-cellular competition for resources (McBride et al., 2021) and that differences in growth rate due to circuit burden can cause further unexpected changes (McBride & Del Vecchio, 2021). Though here we intend to use the biosensor for HTS and not dynamic pathway regulation, we believe these fundamental constraints that apply to circuits are relevant to our system. Thinking of the potential for unintended regulatory action in our own system, we believe there could be two impacts from the unintended coupling: The influence of the biosensor plasmid upregulating the production levels could increase the risk of false positives, while the production plasmid downregulating biosensor output will decrease the ability of our system to detect improved library members.
Decreased System Burden Leads to More Consistent Biosensor Output
We believe that the impacts to the performance of our genetic circuitry are related to transcriptional and translational burdens from the expression of heterologous proteins. When using the Salis Lab calculator to predict translational rates (Reis & Salis, 2020; Salis, n.d.), we saw relatively higher predicted rates of translation for AtMIOX and FjMIOX (values of 885 and 1220 predicted as compared to values of 72 and 44 for MmMIOX and RnMIOX, respectively), indicating that the translational requirements of this system may have exceeded the finite resources the cell had for expressing proteins (Gorochowski et al., 2016). Although this is a prediction, and not necessarily an exact determination of translation strength, the trends matched our results and support our hypothesis that a higher metabolic burden led to a lower GFP output for higher product.
We hypothesized that the system could be made more robust if some of these issues could be addressed through minimization of the burden imposed by our constructs. In an attempt to lower the burden imposed by the biosensor circuit, we decreased the strength of the promoter driving transcription of sfgfp (which simultaneously decreased the predicted translational rate by approximately fourfold) creating a new biosensor plasmid, pCNpJK101. Our second method involved the generation of one single plasmid that combined the production and sensor constructs for each homolog (Fig. S3), generating plasmids pJKN-MmMIOX, pJKN-AtMIOX, pJKN-FjMIOX, and pJKN-RnMIOX. This way, we could address cellular burden in a twofold approach, where we decreased the transcriptional and translation burden of protein expression and of maintaining two plasmids. We saw that when done separately, both these approaches restored the growth rate of the AtMIOX system to levels that more closely matched those of the other homologs (Fig. 3f–g) while also bringing the dose–response curves of all other homologs closer together (Fig. 3b–c). When simultaneously decreasing the promoter strength and the number of plasmids in the system (creating plasmids pJKN101-MmMIOX, pJKN101-AtMIOX, pJKN101-FjMIOX, and pJKN101-RnMIOX), we saw an even closer dose–response (Fig. 3d) but no further restoration of growth (Fig. 3h). These solutions thus decreased the overall system burden but did not fully restore the behavior of the circuit in higher-yield and higher-burden situations.
As a final system modification, we investigated how the method of MIOX protein expression impacted the behavior of our system. There is a collection of evidence that inducing heterologous expression of proteins at later time points is beneficial as the cell has an opportunity to grow before producing foreign protein (Ganesan et al., 2017; Glick, 1995). As such, we hypothesized that a similar benefit could be found for our system by delaying the induction of the MIOX homologs in the system. By delaying the induction of MIOX from 0 hr (i.e., at inoculation) to ∼4 hr into the experiment, we saw that the growth of the AtMIOX variant relative to the other variants was fully restored (Fig. 4a). The trendlines between the variants were also the closest observed, though still not overlapped in such a way that the biosensor is responding consistently across the variants (Fig. 4b). We further attempted decreasing the level of aTc, but at 50% of its initial strength we saw no further benefit (data not shown), and when decreased to 20%, we did not see a significant amount of glucoronate production from most homologs and MI levels (data not shown). The delay of aTc addition showed similar benefits in our two-plasmid system (Fig. S5).
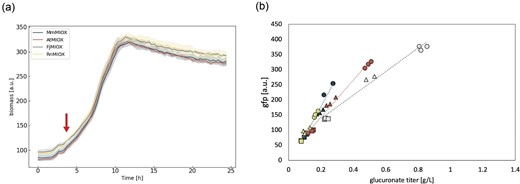
Impact of delayed aTc induction on growth and biosensor behavior. Representative growth curves (a) and biosensor dose response (b) from glucuronate production induced 4 hr into the fermentation (indicated by the red arrow on the growth curve) using various levels of myo-inositol (MI) supplementation. Error is indicated by the shaded region around the line plots as represented by SD, n = 3. Navy blue = myo-inositol oxygenase from Mus musculus, red = myo-inositol oxygenase from Arabidopsis thaliana, gray = myo-inositol oxygenase from Flavobacterium johnsinae, yellow = myo-inositol oxygenase from Rattus norvegicus; squares = 1 g/L MI substrate, triangles = 2.5 g/L MI as substrate, and circles = 5 g/L MI substrate.
Application of the Biosensor to Separate MmMIOX and RnMIOX
Throughout the investigation into the burden of the biosensor and production plasmids, we saw highly similar dose–response curves from MmMIOX and RnMIOX, indicating that the biosensor maintains its functionality across these closely related variants and that these two homologs had potential to showcase the applicability of the biosensor when resource limitation did not seem to be a factor. As the two variants also show relatively close but still distinct titers—generally a difference of ∼20–30% higher titer and fluorescence from MmMIOX—the ability to separate the two will illustrate the potential of the sensor to identify improved enzyme variants out of a library of average-performing variants.
To sort our populations, we used our most optimal growth conditions: our single-plasmid system with induction of MIOX 4 hr after inoculation. Further, we utilized a strain that contained a recA knockout (strain 972ΔT) to eliminate RecA-mediated homologous recombination (Chen et al., 2008) and decrease the chance of homologous recombination to minimize the possibility of plasmid recombination leading to dimers (Crozat et al., 2014), tetramers, etc. that could impact the fidelity of the screen. Glucuronate was produced from a moderate amount of MI (2.5 g/L) supplemented to a co-culture of MmMIOX and RnMIOX and by two controls: a monoculture of MmMIOX and a monoculture of RnMIOX. The distribution of the co-culture was ∼40% MmMIOX/60% RnMIOX as determined via colony PCR. At the single-cell level, we saw that the mixed population had the appearance of two peaks that overlapped with the two controls on the GFP histogram (Fig. 5a). Using this histogram, we selected a portion of high-performing cells out of the mixed culture (indicated on Fig. 5a) with the intent of setting the gate such that there was a reported 0% overlap with the RnMIOX peak while still overlapping our mixed culture peak. The sorted colonies were plated and submitted at random for sequencing. 10/10 randomly selected colonies were found to be MmMIOX via PCR screening. Further, we investigated the ability of the biosensor to enrich cultures that were inoculated as 10–90 and 1–99 mixtures (MmMIOX–RnMIOX ratios). The same gate used to sort our 50–50 mixed population was applied. Following the sort, we found that 8/10 and 7/10 randomly selected colonies, respectively, contained the MmMIOX sequence, while prior to the sort, we saw 0/10 for both populations. These results indicate the effectiveness of the biosensor for enrichment of more active variants.
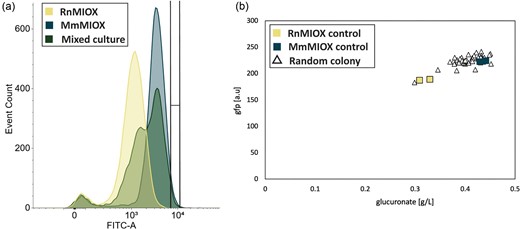
Cell sorting to separate myo-inositol oxygenase from Mus musculus (MmMIOX) from myo-inositol oxygenase from Rattus norvegicus (RnMIOX) in a 50–50 mixed culture. The GFP distribution from single-cell sorting is shown in (a), where yellow = RnMIOX, blue = MmMIOX, and green = mixed culture. The region encased in black lines on the chart is the sorted region, which overlaps ∼5% of cells in the mixed population and only <0.1% of RnMIOX cells. (b) GFP as a function of glucuronate titer for the post-sorting secondary screen. The unfilled triangles indicate the GFP as a function of glucuronate for 46 randomly selected outgrown sorted cells, while the filled triangles represent the control groups (yellow = RnMIOX and navy blue = MmMIOX).
To simulate the follow-up secondary screen, we plated the cells from our sort, grew these colonies overnight in LB, and selected 46 colonies to inoculate fresh media with 2.5 g/L MI using the same delayed induction as was done for the screen. Here, we saw that the majority of the sorted culture clustered around the MmMIOX controls (navy blue triangles, Fig. 5b), corroborating the sequencing data from our colony PCRs. We found it interesting that, as the gate used for sorting the mixed culture moved closer and closer to the rightward tail of the fluorescence distribution (as it did for the 10–90 and 1–99 distributions), our clusters around our controls became more linear in behavior (Fig. S6). This is likely directly related to the heterogeneity at the single-cell level, where the tail of our distribution displays a wider range of phenotypes. We believe that these results do not indicate an inability of our screen to isolate higher producers, but do present a caution against sorting the upper end of the distribution. Instead, the use of a multi-round enrichment will result in a higher likelihood of success. When taken together, this shows that this biosensor exhibits the potential to effectively distinguish and enrich higher-producing MIOX variants at the single-cell level out of a mixture.
Conclusions
In this work, we showcased the potential of the ExuR biosensor for application in MIOX library screening by demonstrating its ability to separate homologs at the single-cell level. Biosensors show significant promise for aiding in the HTS of large libraries of both strains and enzymes, but they are not a solution that can currently fit every problem that requires screening. As was the case here, they often require extensive modification beyond just the sensitivity or operating range modifications we often focus on for a biosensor. By considering the effect of the genetic circuitry used on biosensor output, it is possible to circumvent problems that may negatively influence the outcome of a screen. Our tool as well as many others shows great potential to further our ability as enzyme engineers to find new and better enzymes as we continue to discover how to improve robustness and reliability across applications.
Acknowledgments
We thank the Koch Institute's Robert A. Swanson (1969) Biotechnology Center Flow Cytometry Core Facilities for technical support and use of cell sorting equipment.
Funding
This work was supported by the National Science Foundation Graduate Research Fellowship Program for J.K.N. and by an MIT Bose Research Grant (award number 2116642).
Conflict of Interest
There are no conflicts of interest associated with this manuscript.
