


Abstract
In this study, we aimed to evaluate the antibacterial and antifungal properties, cytotoxicity, and elution behavior of copper oxide (CuO) thin films with varying concentrations and roughness values. CuO films greater than 0.2 mol % showed 99.9 % antimicrobial activity against Escherichia coli, Staphylococcus aureus, Campylobacter jejuni, and Penicillium funiculosum. Cu ions were found to be noncytotoxic in New Zealand white rabbits. The concentration of Cu ions from CuO thin films eluted in drinking water in 24 h at 100 °C was 0.014 μg L−1, which was below the standard acceptable level of 0.02 μg L−1. The transmittance of CuO thin film-coated glass was similar to that of parent glass. The antimicrobial activity, cytotoxicity, elution behavior, and transmittance of CuO deposited on glass suggest that these films could be useful in household devices and display devices.
Introduction
In the last decade, interest in environmentally friendly home electronics as well as bathroom and kitchen products has increased greatly. In addition to the goal of improving our standard of living, the requirement for household cleanliness has increased with the increasing human lifespan. Despite our interest in maintaining healthy lifestyles, germs pose a serious challenge to healthy living [7, 23]. Therefore, the antimicrobial properties of metal ions on glass, bulk metallic glass, plastic, and steel are now being actively investigated [13, 16, 29]. Common metal ions such as Zn2+, Cu2+, Al3+, and Ag+ exhibit antimicrobial properties [2, 10, 13, 15, 21]. These materials are used as disinfectants against various kinds of microbes. Ag+ has been used most commonly as an antibacterial agent because of its many advantages, including its potent antibiotic activity and durability [3, 31]. However, a risk of dermatosis exists when the skin is exposed to Ag-coated materials [8]. Ag+ ions have also been reported to accumulate in the body after absorption [4, 14].
Cu ions are also an effective antimicrobial; Cu metal and Cu-based compounds are highly destructive to microbes and exhibit strong antibacterial properties [13–15]. Generally, metallic Cu has excellent antibacterial activity, more so than CuO film [6, 22]; however, CuO films have many advantages for use in display devices. For example, the processing temperature of CuO film is lower (approximately 200–400 °C) than that of metallic Cu (800–1200 °C), and oxide forms such as CuO have relatively low refractive indexes compared to that of metallic materials. Therefore, CuO films have high transmittance of light in the visible range. Moreover, CuO films with monoclinic structures have more Cu atoms on the surface than those with cubic structures; therefore, CuO film has antimicrobial activity superior to that of Cu2O film. The raw materials used to obtain Cu ions for household applications are cheaper than those used to obtain Ag ions. The antimicrobial activities of Cu ions are proportionate to their concentration and surface roughness, because these factors increase the contact surface between Cu ions and microbes. Therefore, the use of Cu ions as an antimicrobial coating method has been investigated in several studies [11, 17–20].
An important advantage of the sol-coating method is the ability to precisely control film thickness and roughness by regulating spinning, dipping, and spray coating conditions such as the sol concentration, deposition speed, and heat treatment temperature [12, 26, 30]. The antimicrobial activity of Cu ions is well documented, but few studies have examined their cytotoxicity and harmful effects on the human body. High metal ion concentrations are being used in the production of various products including those that directly contact the skin; thus, the concern over Cu ion toxicity via skin absorption is growing. Prolonged Cu ion inhalation and skin contact is associated with risks such as skirt ulcer, hemochromatosis, and chronic gastritis [1]. Based on health concerns, the World Health Organization (WHO) has limited Cu requirements of human body to 2.0 mg, and restricted the maximum allowable extracting concentration of Cu ions in drinking water to 0.02–0.1 μg L−1, according to provisional guideline values [27]. Therefore, to evaluate whether Cu ions are safe for human and animal use, the cytotoxicity and elution behavior of Cu ions must be assessed.
The purpose of the present study was to evaluate the antibacterial and antifungal properties, cytotoxicity, and elution behavior of CuO thin films against Escherichia coli, Staphylococcus aureus, Campylobacter jejuni, and Penicillium funiculosum. In addition, the transmittance of CuO thin film-coated glass prepared with various concentrations and roughness values was measured to determine whether this material could be suitable for use in display devices such as smartphones and touch panels.
Materials and methods
Preparation of CuO thin film
Cupric nitrate hemipentahydrate [(CuNO3)2·2.5H2O, 99 %, Sigma-Aldrich, USA], absolute ethanol, distilled water, and nitric acid (HNO3, 70 %, Sigma-Aldrich, USA) were used to prepare the Cu solution. From 1.0, 1.5, and 2.0 g of (CuNO3)2·2.5H2O, respectively, 0.2, 0.3, and 0.4 mol % solutions were prepared. Mixtures containing 0.2 mol % (CuNO3)2·2.5H2O and 69.8 mol % (87.8 mL) absolute ethanol were then hydrolyzed with 29.9 mol % (11.6 mL) distilled water, and 0.1 mol % (0.1 mL) nitric acid was introduced into the 100 mL solution. To put Cu-sol into a stable state, HNO3 solution was used to adjust the pH to 1.5, and the mixture was stirred for 24 h. Square sodium aluminosilicate glass substrates (Corning Inc., USA) each 0.7 mm thick, 10 mm wide, and 10 mm long were prepared. Thin films were generated from three 0.05 mL drops of Cu solution in ethanol by using the spin-coating method at 3000 rpm for 30 s. Films were then dried at 100 °C for 10 min, and heated at 5 K min−1 in an Ar (99.999 %) atmosphere by using an electric tube furnace (Lindberg Blue M, USA) at 200 °C for 10 min.
Characterization of CuO thin films
Strains and culture conditions
Escherichia coli (ATCC 8739), S. aureus (ATCC 6538), C. jejuni (ATCC 49943) and P. funiculosum (ATCC 11797) were used. Nutrient agar medium (Difco 0001, 3.0 g beef extract, 5.0 g peptone, 15.0 g agar, and 1.0 L distilled water adjusted to pH 7.0) was used to grow E. coli. Trypticase soy agar medium BBL 4311768 (17.0 g pancreatic digest of casein, 3.0 g pancreatic digest of soybean meal, 5.0 g NaCl, 2.5 g K2HPO4, 2.5 g glucose, 15.0 g agar, and 1.0 L distilled water) was used to culture S. aureus, whereas trypticase soy agar medium BBL 211043 (15.0 g pancreatic digest of casein, 15.0 g pancreatic digest of casein, 5.0 g papaic digest of soybean meal, 5.0 g NaCl, 15.0 g Agar, 50.0 mL defibrinated sheep blood, and 0.95 L distilled water adjusted to pH 7.3) was used to grow C. jejuni. Potato dextrose agar medium (BBL 7149, 4.0 g potato infusion, 20.0 g dextrose, 15.0 g agar, and 1.0 L distilled water) was used to grow P. funiculosum.
Antibacterial and antifungal activity tests
Cytotoxicity and elution tests
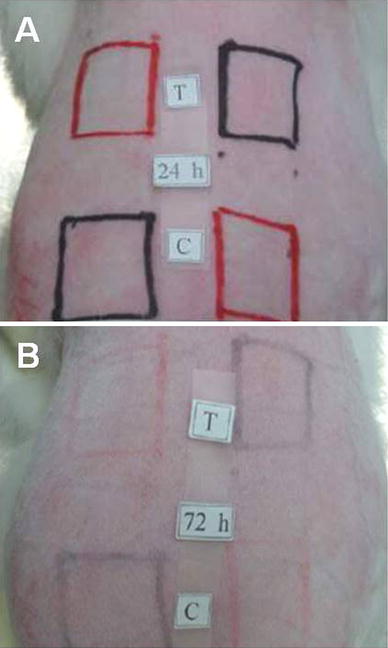
Photographs of New Zealand white rabbits used for the cytotoxicity tests: a 24 h and b 72 h after incubation with 0.2 mol % Cu ions. Red square indicates abraded skin, black square showed intact skin with test (T) and control (C) sites
The PII was used to evaluate cytotoxicity and skin irritation. According to the PII value, the material was classified as being a nonirritant (PII ≤0.5), mild irritant (0.6 ≤ PII ≤ 2.0), moderate irritant (2.1 ≤ PII ≤ 5.0), or severe irritant (5.1 ≤ PII ≤ 8.0). The mean PII values were calculated from a total of 6 NZW rabbits. The elution test for the CuO film was performed using inductively coupled plasma (ICP) atomic emission spectroscopy (Optima-4300 DV, USA). To confirm that the Cu ion concentration in drinking water meets the WHO guideline (2.0 mg L−1, ICP analysis limit of detection: 0.02 μg L−1), the CuO (0.2–0.4 mol %) thin film-coated glass substrate was placed into drinking water (100 mL). The drinking water used for the elution test was purified water (pH 7.4 at 25 °C) containing between 0.1 and 0.5 mg L−1 dissolved minerals (Ca2+, K+, Mg2+, Na+). The concentration of eluted Cu ions was assessed at various time points between 1 and 24 h in the water bath at 100 °C. After the elution test at 100 °C for 24 h, changes in R a, CA, and chemical composition of the 0.4 mol % CuO thin film were calculated to confirm the durability and residual quantity of Cu on the CuO film surface.
Results
Characterization of the CuO thin film
XRD spectra of the CuO thin films prepared at various Cu-sol concentrations
Crystalline size of the CuO thin film (200 °C, 10 min) generated using various Cu concentrations
| Specimen | Crystalline size (nm) | FWHM (°) | D spacing (Å) | 2θ (°) | Diffraction plane (hkl) |
|---|---|---|---|---|---|
| 0.2 mol % Cu | 5.6 | 1.50 | 0.237 | 37.9 | (111) |
| 0.3 mol % Cu | 6.4 | 1.32 | 0.238 | 37.8 | (111) |
| 0.4 mol % Cu | 7.6 | 1.09 | 0.259 | 34.7 | (−111) |
| Specimen | Crystalline size (nm) | FWHM (°) | D spacing (Å) | 2θ (°) | Diffraction plane (hkl) |
|---|---|---|---|---|---|
| 0.2 mol % Cu | 5.6 | 1.50 | 0.237 | 37.9 | (111) |
| 0.3 mol % Cu | 6.4 | 1.32 | 0.238 | 37.8 | (111) |
| 0.4 mol % Cu | 7.6 | 1.09 | 0.259 | 34.7 | (−111) |
Top view field emission scanning electron micrographs (a–d) and atomic force microscopy images (e–h) of CuO thin films prepared using various Cu concentrations: a and e, parent glass; b and f, 0.2 mol % Cu; c and g, 0.3 mol % Cu; d and h, 0.4 mol % Cu. The insets (cross-sectional views) show the thickness of the CuO thin films on the glass substrates
EDS compositional analysis and surface roughness of the CuO thin film with various concentrations of copper sol
| Specimen | Chemical composition (wt %) | Roughness (nm) | |||||||
|---|---|---|---|---|---|---|---|---|---|
| O | Si | Na | Al | Mg | Cu | R a | R q | R t | |
| Parent glass | 52.68 | 25.91 | 10.70 | 6.25 | 4.46 | n/a | 0.199 | 0.265 | 11.86 |
| 0.2 mol % Cu | 57.27 | 17.05 | n/a | n/a | n/a | 25.68 | 0.227 | 0.340 | 18.81 |
| 0.3 mol % Cu | 56.48 | 15.97 | n/a | n/a | n/a | 27.55 | 0.298 | 0.693 | 32.86 |
| 0.4 mol % Cu | 57.12 | 14.24 | n/a | n/a | n/a | 28.64 | 0.306 | 0.779 | 37.80 |
R a average surface roughness, R q root mean square roughness, R t peak-to-valley difference
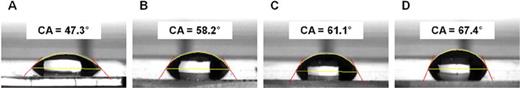
Water contact angle of a drop placed on parent glass and glass coated with CuO thin films with various Cu concentrations: a parent glass, b 0.2 mol % Cu, c 0.3 mol % Cu, d 0.4 mol % Cu
Characteristics of CuO thin films with various Cu concentrations
| Specimen | Contact angle (°) | Height (mm) | Base line length (mm) | Base area (mm2) | Wetting energy (mN m−1) |
|---|---|---|---|---|---|
| Parent glass | 47.3 | 0.618 | 2.823 | 6.257 | 49.4 |
| 0.2 mol % Cu | 58.2 | 0.721 | 2.596 | 5.293 | 38.3 |
| 0.3 mol % Cu | 61.1 | 0.742 | 2.514 | 4.962 | 35.2 |
| 0.4 mol % Cu | 67.4 | 0.803 | 2.456 | 4.562 | 28.0 |
Antibacterial and antifungal activities of CuO thin films with varying Cu ion concentrations
Number of bacterial colonies expressed as the logarithm of the number of colonies grown on plates in the presence of parent glass or glass coated with various concentrations of Cu
FE-SEM analysis of bacteria and fungi treated with CuO thin film
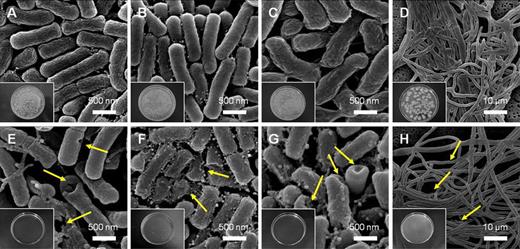
FE-SEM micrographs of untreated bacteria (a–d), and those treated with 0.2 mol % CuO film (e–h) heated to 200 °C for 10 min: a and e Escherichia coli; b and f Staphylococcus aureus; c and g Campylobacter jejuni cells; d and h Penicillium funiculosum cell. The lower left shows photographs of bacterial colonies, which were quantified as the number of colonies present on each plate
Evaluation of Cu ion cytotoxicity and elution
Cytotoxicity was evaluated to test the safety of Cu ions by using NZW rabbits as an experimental model. NZW rabbits tend to show sensitivity toward test materials. The cytotoxicity of CuO thin films was determined based on PII results (Table 4). For CuO film-coated materials to be considered safe, the PII must be in the nonirritant range. In this study, the PII was calculated to be 0.0, which is within this range. After 24 and 72 h of CuO thin film exposure (Fig. 1a, b), mortality, weight fluctuations, and other effects were evaluated. After the test areas were exposed, no skin irritation such as red spots or edema was observed in the intact and abraded sites. No animals showed abnormal symptoms such as skin tinning, inflammation and skin rash during this study. Based on these results, the CuO thin films were determined to be noncytotoxic.
Cytotoxicity test results for 0.2 mol % CuO thin film
| Change | Erythema and eschar | Edema | ||||||
|---|---|---|---|---|---|---|---|---|
| Phasesa | Intact | Abraded | Intact | Abraded | ||||
| 24 h | 72 h | 24 h | 72 h | 24 h | 72 h | 24 h | 72 h | |
| Animal number | ||||||||
| 1 | 0 | 0 | 0 | 0 | 0 | 0 | 0 | 0 |
| 2 | 0 | 0 | 0 | 0 | 0 | 0 | 0 | 0 |
| 3 | 0 | 0 | 0 | 0 | 0 | 0 | 0 | 0 |
| 4 | 0 | 0 | 0 | 0 | 0 | 0 | 0 | 0 |
| 5 | 0 | 0 | 0 | 0 | 0 | 0 | 0 | 0 |
| 6 | 0 | 0 | 0 | 0 | 0 | 0 | 0 | 0 |
| Sum | 0 | 0 | 0 | 0 | 0 | 0 | 0 | 0 |
| Mean | 0.0 | 0.0 | 0.0 | 0.0 | 0.0 | 0.0 | 0.0 | 0.0 |
| Sum of means | 0.0 | |||||||
| P. I. I | 0.0 | |||||||
aTime after topical application
Concentration of eluted Cu ions from CuO thin films deposited on glass at 100 °C determined at various elution times (1–24 h) with inductively coupled plasma
| Specimen | Concentration of eluted Cu ions (μg L−1) | 100 % eluted Cu ions (μg L−1)a | |||
|---|---|---|---|---|---|
| 1 h | 6 h | 12 h | 24 h | ||
| 0.2 mol % Cu | 0.010 | 0.011 | 0.012 | 0.014 | 0.150 |
| 0.3 mol % Cu | 0.013 | 0.014 | 0.017 | 0.019 | 0.262 |
| 0.4 mol % Cu | 0.021 | 0.025 | 0.029 | 0.036 | 0.415 |
aThe 100 % dissolved Cu concentration in the water with various CuO thin films (0.2–0.4 mol %) was calculated. The amount of Cu in solution for the deposited CuO films on the glass substrate was calculated using the thickness of CuO film and glass area (10 × 10 mm2)
Characteristics of CuO thin films after an elution test at 100 °C for 24 h
| Specimen | Chemical composition (wt %) | Roughness (nm) | Contact angle (°) | |||||
|---|---|---|---|---|---|---|---|---|
| O | Si | Cu | R a | R q | R t | |||
| 0.4 mol % Cu | 58.95 | 14.41 | 26.64 | 0.301 | 0.760 | 34.29 | 62.1 | |
| Specimen | Chemical composition (wt %) | Roughness (nm) | Contact angle (°) | |||||
|---|---|---|---|---|---|---|---|---|
| O | Si | Cu | R a | R q | R t | |||
| 0.4 mol % Cu | 58.95 | 14.41 | 26.64 | 0.301 | 0.760 | 34.29 | 62.1 | |
Characteristics of the 0.4 mol % CuO thin film after an elution test at 100 °C for 24 h: a surface morphology (inset shows the thickness of the CuO film), b atomic force microscopy image, c water contact angle
Optical and mechanical properties of CuO thin film
Transmittance of light through the parent glass and glass coated with various CuO thin film concentrations: a parent glass; b 0.2 mol % Cu; c 0.3 mol % Cu; d 0.4 mol % Cu coated glass
Discussion
Cu ions have well-known antibacterial activity, but their cytotoxicity has been examined in only a few studies. Therefore, in this study, we sought to confirm the antibacterial and antifungal properties of CuO thin films as a function of their concentration and roughness and evaluate their cytotoxicity and elution behavior. In addition, the light transmittance was measured to confirm whether CuO thin films could be applied to display devices.
In a preliminary experiment [13], the thickness of the 0.2 mol % CuO thin film increased from 31 to 91 nm when the spinning speed was decreased from 5000 to 1000 rpm. An inverse relationship between film thickness and transmittance is often observed; however, the durability of the film’s antibacterial activity is relative to its thickness. Therefore, a spin speed of 3000 rpm was selected, because those two factors (durability and transmittance) should both be considered. Therefore, the CuO thin film produced from Cu-sol concentrations of 0.2, 0.3, and 0.4 mol % was then produced with thicknesses of 55, 64, and 76 nm, respectively. XRD analysis showed the CuO thin film had a monoclinic structure, without an impurity peak. When the concentration of Cu-sol was increased from 0.2 to 0.4 mol %, the interplanar spacing of the deposited CuO film increased, from 0.237 to 0.259 Å, and the diffraction plane of the main peak was changed from (111) to (−111). We attribute this to the fact that the interplanar spacing of the CuO film widened with increasing CuO crystalline size when the initial Cu-sol concentration was increased. As a result, the thickness of the CuO thin film increased proportionally with the Cu-sol concentration.
When the Cu concentration increased (Fig. 3e−h), the R a value increased slightly from 0.199 nm (parent glass) to 0.306 nm (0.4 mol % CuO thin film). Although this difference in roughness value appears slight, many reports have highlighted the influence of subnano scale roughness (smooth surface) on antibacterial activity [25, 28]. On the contrary, the R t value increased substantially from 11.86 (parent glass) to 37.80 nm (0.4 mol % CuO thin film), which was approximately 2.2 times higher, although the thickness of CuO film was thin. To confirm the effect of roughness further, we measured the CA values of the CuO films, which increased from 47.3° (parent glass) to 67.4° (0.4 mol % CuO thin film) with increasing Cu concentration. Giljean et al. [9] have described the relationship between R a and CA and confirmed that CA increases when the surface becomes rough due to low surface energy. The antimicrobial effects of Cu ions were related to their combination with active oxygen. The combination of Cu+ and OH− (active oxygen) ions destroys the membranes and DNA of microbes by interacting with proteins containing –CH and –SH groups. Therefore, the antibacterial and antifungal activities increased when the concentration of Cu-sol was increased from 0.2 to 0.4 mol %, because the increase in Cu-sol concentration increased the roughness of the CuO film, increasing the contact surface between Cu ions and microbes. Interestingly, at 0.2 mol % Cu, the number S. aureus colonies (0.922 ± 0.091 log CFU mL−1) was slightly higher than that of E. coli (0.581 ± 0.098 log CFU mL−1) and C. jejuni (0.606 ± 0.081 log CFU mL−1). Therefore, CuO thin film had greater antibacterial activity towards Gram-negative bacteria such as E. coli and C. jejuni than on Gram-positive bacteria such as S. aureus. This is because Gram-positive bacteria have cell walls with a relatively thicker peptidoglycan layer. These observations are in accordance with the positive effect theory reported by Akira et al. [24].
The toxicity of Cu ions was determined by performing experiments on an animal model. The Cu ions were found to be noncytotoxic. When the nanoscale Cu ions are eluted from the CuO thin film, bacterial cell walls can be destroyed by the cation effect. However, during the cytotoxicity test, CuO thin film was found to be non-cytotoxic to the epidermis and dermis within the 24–72 h treatment period. Although the test site was large (2.5 × 2.5 cm2), the minimum concentration of eluted Cu ions (0.014–0.036 μg L−1) at the antimicrobial concentration (0.2–0.4 mol %) was controlled by heating to 200 °C for 10 min. The concentration of eluted Cu ions is related to the diffusion process, and is directly proportional to concentration, temperature, humidity, and maintenance time. The quantity of eluted ions increased proportionately with increasing Cu-sol concentration and heating time. Cu ions were eluted at 0.036 μg L−1 from 0.4 mol % CuO thin film, which was within the acceptable elution range for ICP analysis. In addition, the calculated 100 % dissolved Cu concentration in water with various CuO thin films (0.2, 0.3, and 0.4 mol % Cu) was approximately 0.150, 0.262, and 0.415 μg L−1, respectively (Table 5). The dissolved Cu concentrations during the elution test (100 °C for 24 h) with various CuO thin films (0.2–0.4 mol % Cu) were 9.3, 7.2, and 8.7 % of the total (100 % dissolved Cu concentration), respectively. Therefore, we confirmed the chemical stability of CuO thin films under extreme conditions (100 °C, 24 h) during the elution test. Based on the results of the cytotoxicity and elution tests, we conclude that the CuO thin films manufactured at various concentrations were non-irritating, chemical stability, and satisfied the WHO elution guidelines (2.0 mg L−1) for drinking water.
Conclusions
To summarize, CuO thin films with different concentrations and roughness values were generated using a sol–gel method, and the antimicrobial (bacteria and fungi) activities, cytotoxicity, and elution behavior were examined using E. coli, S. aureus, C. jejuni and P. funiculosum. The CuO thin films showed excellent antimicrobial activities (99.9 %) at Cu concentrations greater than 0.2 mol % Cu, and that the antimicrobial activity of the CuO thin films was related to their concentrations and roughness values, which affected the contact surface between the Cu ions and microbes. The cytotoxicity tests demonstrated that the CuO thin film was noncytotoxic. The quantity of eluted Cu ions was 0.014 μg L−1 from 0.2 mol % CuO thin film, which satisfies the drinking water elution guidelines of the WHO. The transmittance of light through 0.2 mol % CuO film-deposited glass was 90.9 %. The antimicrobial activity, cytotoxicity, elution, and transmittance of CuO-deposited glass suggest that Cu ions have valuable applications in various fields, including in the manufacturing of mobile phones, touch panels, and electrical appliances.
Acknowledgments
The authors would like to thank Prof. Kwang-Mahn Kim and Dr. Yu-Ri Choi from the Yonsei University College of Dentistry for their technical assistance.
Conflict of interest
The authors declare that they have no conflict of interest.
