-
PDF
- Split View
-
Views
-
Cite
Cite
Xianghui Jia, Na Wei, Tianyv Wang, Haoyong Wang, Use of an EZ-Tn5-based random mutagenesis system to create a Zymomonas mobilis with significant tolerance to heat stress and malnutrition, Journal of Industrial Microbiology and Biotechnology, Volume 40, Issue 8, 1 August 2013, Pages 811–822, https://doi.org/10.1007/s10295-013-1287-1
Close - Share Icon Share
Abstract
During ethanol production, the fermentation cells are always exposed to stresses like high temperature and low nutritional conditions, which affect their growth and productivity. Stress-tolerant strains with high ethanol yield are highly desirable. Therefore, a recombinant Zymomonas mobilis (Z. mobilis) designated as HYM was constructed by integrating three genes (yfdZ, metB, and Pfu-sHSP) into the genome of Z. mobilis CP4 (CP4) via Tn5 transposon in the present study. The yfdZ and metB genes from E. coli were used to decrease the nutritional requirement. The small heat shock protein gene (Pfu-sHSP) from Pyrococcus furiosus (P. furiosus) was used to increase the heat tolerance. The genomic integration of three genes confers on Z. mobilis the ability to grow in simple chemical defined medium without the addition of amino acid. The HYM not only demonstrated the high tolerance to unfavorable lower nutrition stresses but also the capability of converting glucose to ethanol with high yield at higher temperature. What is more, these genetic characteristics were stable up to 100 generations on nonselective medium. The effects of glucose concentration, fermentation temperature, and initial pH on ethanol production of the mutant strain HYM were optimized using a Box–Behnken design (BBD) experiment. The integration of three genes led to a significant increase in ethanol production by 9 % compared with its original Z. mobilis counterpart. The maximum ethanol production of HYM was as high as 105 g/l.
Xianghui Jia, Na Wei, and Tianyv Wang contributed equally to this work.
Introduction
Among various ethanol-producing microbes, the Gram-negative bacterium Z. mobilis is an efficient ethanol producer with favorable features that are at least equal to those from the more familiar brewer’s yeast [9, 10]. Ethanol production at high temperature has received much attention because fermentation processes conducted at elevated temperatures will significantly reduce cooling costs and improve simultaneous saccharification, fermentation, distillation, and suitability for use in tropical countries. However, the temperatures suitable for Z. mobilis are relatively low (25–32 °C). Z. mobilis is unable to produce ethanol effectively under high temperature (above 38 °C) [2]. Creation of the heat-resistant strains will be of great value for the ethanol industry, while screens for recombinant Z. mobilis mutants able to produce ethanol efficiently at high temperature have never been performed before.
The hyperthermophilic archaeon P. furiosus expresses a small, α-crystallin-like protein in response to extreme temperatures above 103 °C. This small heat shock protein (Pfu-sHSP) gives cellular protection from extremely high temperatures [7, 8] like the α-crystallin eye lens proteins, acts as molecular chaperones, and prevents aggregation of denatured proteins under heat stress. It can prevent E. coli cellular proteins from aggregation above 100 °C, and can significantly enhance the viability of mesophilic organisms such as E. coli under lethal temperatures [7]. The introduction of gene Pfu-sHSP might be able to protect the mesophilic enzymes of Z. mobilis from aggregating at elevated temperature to increase ethanol production under heat stress.
The growth of Z. mobilis usually requires complex rich medium containing yeast extract, and has long been known to require lysine and methionine [1, 12]. The whole-genome sequencing has revealed the specific reasons for these deficiencies. The only genes missing for lysine and methionine synthesis are yfdZ and metB, respectively [4, 6, 12]. The yfdZ and metB genes encode a PLP-dependent aminotransferase and a PLP (pyridoxal phosphate)-dependent cystathionine gamma-synthase, respectively. As the Z. mobilis suffered from malnutrition may not be able to maintain its normal ability to produce ethanol, which is common at the end of a batch, and rich medium will significantly increase the cost of ethanol production, it is very important to introduce yfdZ and metB genes into Z. mobilis to lower this organism’s nutritional requirements.
Because antibiotic resistance markers are generally perceived as undesirable for industrial application, Tn5 transposition mutagenesis in Z. mobilis was used in this research to overcome the instability limitations of foreign plasmids exhibited under both selective and non-selective conditions. Tn5 transposition is a bacterial genetic element which can mediate genome DNA rearrangements and integration of foreign DNA via a cut-and-paste mechanism. The only macromolecular components required for this process are the transposase; the transposon, which can presumably be any sequence that is defined by two specific inverted 19-bp sequences; and the target DNA into which the insertions are made [14].
In this study, the DNA integration into the genome of CP4 was mediated by Tn5 transposon. Pfu-sHSP, yfdZ, and metB genes were used for construction of a variant of Z. mobilis HYM having lower nutritional requirements and could be cultured in higher temperature. The optimal fermentation conditions of glucose concentration, temperature, and initial pH for maximum ethanol production of the HYM were quantified from the Box–Behnken design using response surface methodology. The study showed the stable integration of three genes listed above leaded to a significant improvement in the tolerance to heat stress and malnutrition stress, also led to a maximal 9 % increment in ethanol production than its original counterpart CP4 under optimize condition.
Materials and methods
Bacterial strains and cultural conditions
The bacterial strains and plasmids used are listed in Table 1. The E. coli K12 MG1655 was from the American Type Culture Collection (ATCC) and was grown on Luria-Bertani (LB). P. furious strain was from ATCC and its genome DNA was used as template for PCR amplification of the Pfu-sHSP gene. Z. mobilis ATCC 31821 (CP4) was from ATCC, and was used as the template for PCR amplification of the promoter of glyceraldehyde-3-phosphate dehydrogenase (PGAP) and enolase (PENO).
Bacterial strains and plasmids used in this study
| Strains . | Containing genes . | Source . |
|---|---|---|
| E. coli K12 MG1655 | yfdZ, metB | ATCC 47076 |
| P. furious | Pfu-Shsp | ATCC 43587 |
| Z. mobilis CP4(CP4) | Wild-type Z. mobilis | ATCC 31821 |
| Z. mobilis HYM (HYM) | yfdZ, metB, Pfu-Shsp | This study |
| Plasmids | ||
| pTN-HMY | Pfu-sHSP, metB, yfdZ | This study |
yfdZ and metB genes were used for self-synthesizing lysine and methionine
Pfu-sHSP gene was used for increasing the resistance to heat stresses
Z. mobilis strains were cultivated anaerobically in RM medium (10 g/l yeast extract, 1 g/l KH2PO4, 1 g/l carbamide, 0.5 g/l MgSO4·6H2O), supplemented with different amounts of glucose (as indicated) as carbon source. For the inoculum preparation, a single colony was added to a test tube containing 5 ml RM medium and cultured anaerobically at 30 °C until it reached late exponential or early stationary phase. A 1/100 dilution was added into the pre-warmed RM medium (10 ml culture into 1,000 ml RM), which was then cultured anaerobically at 30 °C with shaking at 150 rpm for approximately 12 h, or until an OD of 2–3 at 600 nm was reached. The optical density was measured with a spectrophotometer at 600 nm. Fermentation medium and fermentation products from filter-sterilized cell-free spent medium were analyzed by gas chromatography for ethanol determinations. The reducing glucose concentration was determined using the DNS method [3, 13].
Construction of Tn5 transposon vector and transposome preparation
Promoter PGAP/NEO was a fusion of two strong constitutive promoters of Z. mobilis, glyceraldehyde-3-phosphate dehydrogenase promoter (PGAP) and 2-phosphoglycerate dehydratase promoter (PNEO) [1, 2]. Promoter PGAP DNA fragment was amplified from CP4 chromosomal with the primer pair: 5′ ctcgagGTTCGATCAACAACCCGA and 5′ ggatccCTAACTTATTAAGTAGCTA; promoter PNEO was amplified with the primer pair: 5′ agatctCTCCAGTTACTCAATACG and 5′ gaattcAACCTTTCTTAAAATCTT. After the PGAP DNA was digested with BamHI and the PNEO DNA was digested with BglII, two DNA fragments were mixed, and incubated with T4 DNA ligase for an additional 12 h at 18 °C to form the fusion PGAP/NEO Promoter. The fusion promoter was PCR amplified with primer: 5′ ctcgagGTTCGATCAACAACCCGA and 5′ gaattcAACCTTTCTTAAAATCTT.
The yfdZ gene was amplified from E. coli K-12 chromosomal with the primer pair: 5′ gaattcATGGCTGACACTCGCCCT and 5′ gtcgacTTATTCCGCGTTTTCGTG. After the digestion by EcoRI, this 1.3-kb DNA fragment was ligated with the EcoRI fragment of PGAP/NEO to form the Z. mobilis expressible PGAP/NEO-yfdZ operon. The metB gene was amplified from E. coli K-12 chromosomal with the primer pair: 5′gaattcATGACGCGTAAACAGGC and 5′ gtcgacTTAC CCCTTGTTTGCAGC. After the digestion by EcoRI, this 1.17-kb DNA fragment was ligated with the EcoRI fragment of PGAP/NEO to form the Z. mobilis expressible PGAP/NEO-metB operon. The Pfu-sHSP gene was amplified from P. furious chromosomal with the primer pair: 5′gaattcATGGTGAGGAGAATAAGA and 5′gtcgacTTATTCAACTTTAACTTC. After the digestion by EcoRI, this 0.5-kb DNA fragment was ligated with the EcoRI fragment of PGAP/NEO to form the PGAP/NEO-sHSP operon. After the PGAP/NEO-metB operon was digested with SalI and the PGAP/NEO - yfdZ operon was digested with XhoI, two DNA fragments were ligated to get the PGAP/NEO-metB/yfdZ operon. After PGAP/NEO-metB/yfdZ operon was digested with XhoI and PGAP/NEO-sHSP operon was digested with SalI, two DNA fragments were ligated to result in the PGAP/NEO-sHSP/metB/yfdZ operon, which could be cut out by SalI and XhoI.
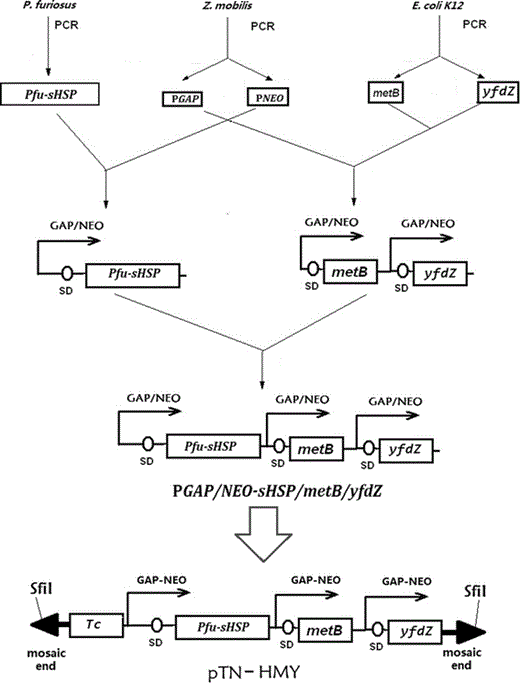
Constructions of Tn5 transposon plasmid pTN-HMY containing a multicistronic operon PGAP/NEO-sHSP/metB/yfdZ. A fusion promoter (fusion of two strong constitutive promoters: PGAP and PNEO from Z. mobilis) was cloned to facilitate the higher level expression of genes under its control. The YfdZ and metB genes were used to decrease nutritional requirements. The Pfu-sHSP gene was used to increase resistance to heat stresses. The tetracycline resistance determinant (TC) was used to allow selection of Z. mobilis transformants after electroporation with the Tn5 transposon pTN-HYM. This plasmid contains the mosaic end (ME) sites, which were specifically recognized by the EZ-Tn5 transposase
Transposome electroporation into CP4
To prepare the transposome, the Tn5 transposon pTN-HYM was digested with SfiI, purified from the agarose gel, and mixed with EZ-Tn5 transposase (Epicentre). The mixture was incubated for 30 min at room temperature to allow stable binding of Tn5 transposase to the Transposon DNA; that mixture was then stored at −20 °C.
After determining that Z. mobilis CP4 was indeed sensitive to tetracycline, fresh electrocompetent cells of CP4 from 400 ml RM medium with an optical density at 600 nm (OD600) as 0.4, were washed twice with equal volumes of ice-cold 10 % glycerol. Cells were suspended again in 400 μl of washing buffer, and aliquots of 100 μl were dispensed into 0.2-mm gapped electroporation cuvettes along with 1 μl of pTN-HYM-Tn5 mixture. Electroporation was performed with a Bio-Rad Gene Pulser Xcell (6.0 ms, 1.5 kV) (Bio-Rad, Hercules, CA, USA). Cells were immediately diluted into 1 ml RM medium and plated onto RM agar supplemented with 30 μg/ml tetracycline.
Isolation and identification
After 2 days of incubation at 30 °C, colonies on tetracycline-containing plates arose only when the electroporation mixtures contained pTN-HYM; not a single colony was observed in the mixtures without the DNA. A total of about 5 × 10² Tc-resistant transformants were obtained in each of three independent transformation experiments from three independent transformations. We picked 100 random colonies and those cells were inoculated in fresh RM liquid medium. To verify the DNA integration, DNA was isolated using the Qiagen DNeasy blood and tissue kit, and Tn5 insertion within the genome were analyzed by PCR. After 2 mg of the isolated DNA sample was digested overnight with EcoRI or BamHI, the digested DNA samples were electrophoresed on a conventional 0.7 % agarose gel and then transferred onto nylon membranes. After hybridization with the metB-specific probe (ATGACGCGTAAACAGGC), Southern blots were developed.
Single mutant colonies were cultured on the selection RM medium contains 230 g/l glucose for 3 days. Strains with the higher ethanol yield were selected for further fermentation research and kept in RM medium with 20 % glycerol at −80 °C. After the selection, one strain, with a higher ethanol yield than its original counterpart CP4, named HYM, was selected. All strains were fermented in the same conditions in triplicate.
Gas chromatography (GC)
Ethanol concentrations in the medium supernatant were determined by flame ionization gas chromatography. Culture samples (1 ml) and standards were prepared by filtration. The samples and standards were quantified by injecting 1 μl of each into an Agilent Technologies model 6890 equipped with a DB-FFAP 30 m × 0.53 mm × 1.5 μm film thickness capillary column (Agilent, Santa Clara, CA, USA). The column operated with an initial temperature of 80 °C and ramping 10 °C to a final temperature of 180 °C, while the detector was at 250 °C and the injector temperature was 200 °C with a post-injection dwell-time of 1 min. The carrier gas was N2 at a constant flow rate of 5 ml/min.
Experimental design for optimization of ethanol production
where x i was dimensionless value of an independent variable, X i was the real value of an independent variable,
where Y i was the predicted response, X 1 , X 2 , X 3 the independent variables, b 0 the offset term, b 1 , b 2 , b 3 the linear effects, b 11 , b 22 , b 33 the squared effects, and b 12 , b 23 , b 13 were interaction terms.
For a verification experiment, the optimized factors were used for the fermentation of ethanol production of HYM to confirm the accuracy of the model for predicting the maximum ethanol production. Additional experiments in sextuplicate using these optimized factors were performed.
Results
Random insertion of PGAP/NEO-sHSP/metB/yfdZ operon
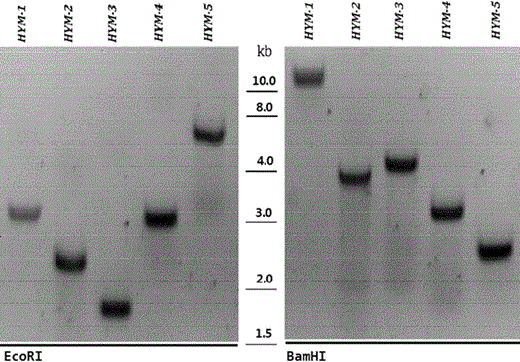
Southern-blot analyses of Z. mobilis mutants obtained after electroporation with EZ-Tn5 transposome. After selection on RM plates containing tetracycline (15 mg/ml), five strains were chosen by random for further verification. Following overnight digestion of the purified DNA with EcoRI or BamHI, the digested DNA samples were electrophoresed on a conventional 0.7 % agarose gel. The separated DNA was then transferred onto a nylon membranes for hybridization with a Dig-labeled metB probe. The Southern blots were developed using reagents from the DIG DNA labeling and detection kit (Roche) according to the manufacturer’s instructions (the size of the DNA fragments, in kilobases (kb), is shown in the middle)
As the majority of the PCR-positive mutants produced more ethanol than CP4, it is hard to say that the insertion of the PGAP/NEO-sHSP/metB/yfdZ operon was not responsible for the improved ethanol production, and because the Z. mobilis with insertion of the operon showed varied ethanol production capability, the improvement was affected by the integration site.
Z. mobilis HYM could grow in simple defined chemical medium
The growth of Z. mobilis has long been known to need the addition of nutrition. Although it possesses a complete set of genes for synthesis of all amino acids but does not have one gene in the lysine (yfdZ) pathway and one gene in the methionine (metB) pathway. To demonstrate the effects of the Tn5 system on the nutritional requirements, one PCR-positive strain HYM was chosen to be cultured in different plates under anaerobic conditions with the original strain CP4 as a control.
There were four types of agar plates in this research. The agar plate provided a solid medium on which Z. mobilis was cultured. Liquid YM medium was mixed with agar and poured into Petri dishes to form the agar plate YM. Plate I was derived from the plate YM without yeast extract. Plate II was derived from plate I by adding various salts (NaCl, CaCl, KCl), which was a common substance for Z. mobilis growth to substitute the yeast extract, and by adding NH4Cl to substitute carbamide. Plate III was derived from plate II with carbamide replaced by NH4Cl. An important distinction between the four growth mediums was that plate YM was the only one with yeast extract. Plates I, II, and III were classified as defined medium with known quantities of all ingredients, while the plate YM as undefined medium with yeast extract, which consists of a mixture of many chemical species in unknown proportions.
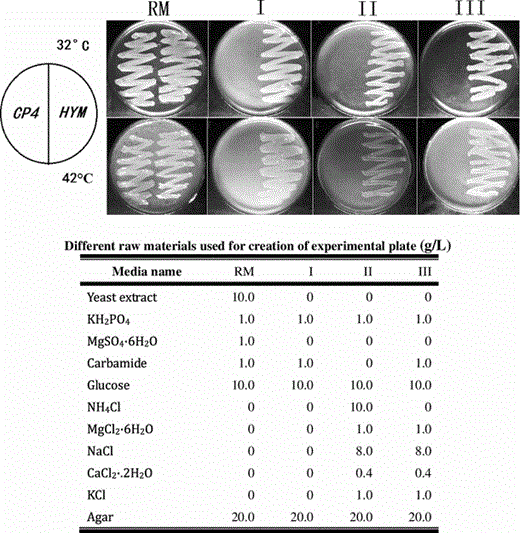
Growth properties of CP4 and HYM on different media at 32 °C (upper) or 42 °C (lower) anaerobically for 3 days. CP4 grows only in media containing yeast extracts (RM), and cannot grow in simple chemical defined media (I, II, III). HYM grows well in simple chemical media without yeast extract (I, II, III)
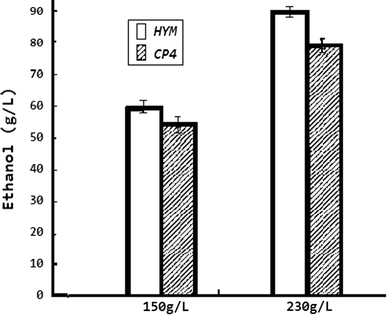
Comparisons of ethanol production with different concentrations of glucose between CP4 and HYM. Cultures were grown in RM medium (10 g/l yeast extract, 1 g KH2PO4, 1 g/l carbamide, 0.5 g/l MgSO4·6H2O) with 230 g/l glucose as the carbon source under anaerobic conditions at 32 °C. All strains were tested by three parallel experiments. After 60-h fermentation, the highest ethanol concentration of HYM was 87.1 g/l with the ethanol yield as 0.38 g/g (ethanol/glucose); while the original strain CP4 was 78.4 g/l with the ethanol yield as 0.34 g/g (ethanol/glucose). The difference of ethanol yield between HYM and CP4 was 11 %
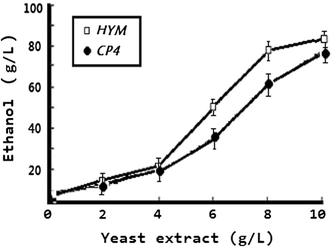
Comparisons of ethanol production between CP4 and HYM in media containing different concentration of yeast extract. Cultures were grown in RM medium without yeast extract (1 g KH2PO4, 1 g/l carbamide, 0.5 g/l MgSO4·6H2O) with 23 % glucose as the carbon source under anaerobic conditions at 32 °C for 60 h, supplemented with different amounts of yeast extract as indicated. All strains were tested by three parallel experiments. The experiment data proved that the yeast extract was still needed for high-level ethanol production, although HYM could grow without yeast extract. However, from the trend lines, we can deduced that in nutrient medium, HYM was more efficient in producing ethanol than CP4
Significant increase in ethanol yield and productivity at high temperature
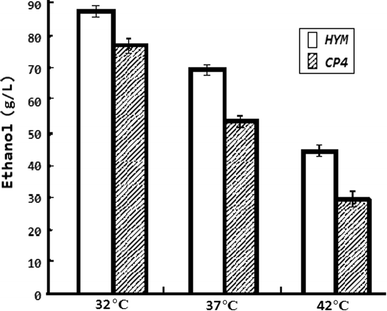
Comparisons of ethanol production between CP4 and HYM at different temperature. Strains were grown in RM medium (10 g/l yeast extract, 1 g KH2PO4, 1 g/l carbamide, 0.5 g/l MgSO4·6H2O) with 23 % glucose as the carbon source under anaerobic conditions. All strains were tested by three parallel experiments. When the temperature reached 42 °C from 32 °C, after 60-h fermentation, the average ethanol concentrations of CP4 and HYM were reduced dramatically. When the temperature was 42 °C, the ethanol yield of HYM based on consumed glucose was 0.19 g/g (ethanol/glucose), significantly different from CP4 (ethanol yield based on consumed glucose was 0.12 g/g). It is apparent that HYM was much less sensitive to high temperatures than CP4
Stability test
HYM strain was selected for further stability testing. Frozen stock culture was transferred into RM medium (10 g/l yeast extract, 1 g KH2PO4, 1 g/l carbamide, 0.5 g/l MgSO4·6H2O) with 230 g/l glucose (RMG). Overnight-grown culture was transferred into an RMG tube containing 10 ml of medium to an initial OD of 0.02 at 600 nm. At the end of 100 generations, the grown culture was also tested for fermentation of glucose in a 100-ml shake flask containing 80 ml of RMG. The strain could ferment glucose both rapidly and efficiently with no obvious difference then they were first been isolated. The PCR reaction also confirmed that the HYM strain was stable up to 100 generations on non-selective medium.
Effects of the single-factor experiments on ethanol production
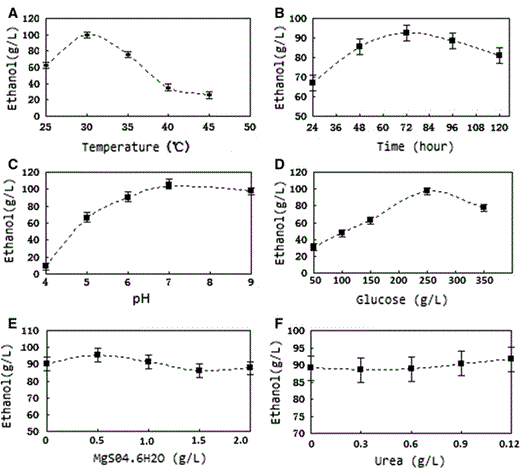
Effect of the single-factor experiments on the ethanol production of HYM. a Effect of fermentation temperature on ethanol production. b Effect of fermentation time on ethanol production. c Effect of initial pH on the ethanol production. d Effect of initial glucose concentration on the ethanol production. e Effect of initial magnesium ions concentration on the ethanol production. f Effect of initial urea concentration on ethanol production
Single-factor analysis of variance
The results of variance analysis for single-factor experiments for HYM were: the fermentation temperature, initial pH, and glucose concentration were all significant to the ethanol production of HYM. Other factors like magnesium ion concentration and urea concentration did not have a significant influence on ethanol production.
Optimization experiments design
The Box-Behnken center design matrix for the experimental design and predicted results for ethanol production
| Run no. . | X 1 . | X 2 . | X 3 . | Ethanol concentration (g/l) . | |
|---|---|---|---|---|---|
| Experimental . | Predicted . | ||||
| 1 | −1 | −1 | 0 | 69.631 | 76.06341 |
| 2 | −1 | 1 | 0 | 58.323 | 61.03391 |
| 3 | 1 | −1 | 0 | 64.674 | 61.96316 |
| 4 | 1 | 1 | 0 | 54.865 | 48.43266 |
| 5 | 0 | −1 | −1 | 64.240 | 63.39041 |
| 6 | 0 | −1 | 1 | 56.729 | 53.85717 |
| 7 | 0 | 1 | −1 | 6.394 | 9.26591 |
| 8 | 0 | 1 | 1 | 78.572 | 39.57717 |
| 9 | −1 | 0 | −1 | 73.088 | 67.50528 |
| 10 | 1 | 0 | −1 | 47.060 | 50.62053 |
| 11 | −1 | 0 | 1 | 97.843 | 94.28254 |
| 12 | 1 | 0 | 1 | 78.883 | 84.46579 |
| 13 | 0 | 0 | 0 | 100.354 | 100.2017 |
| 14 | 0 | 0 | 0 | 99.962 | 100.2017 |
| 15 | 0 | 0 | 0 | 100.289 | 100.2017 |
where X 1 was temperature, X 2 was glucose concentration, and X 3 was initial pH.
The predicted levels of ethanol production using the above equation were given in Table 2. The predicted optimum levels of temperature, glucose concentration, and initial pH were obtained by applying regression analysis to the equation. The predicted and experimental ethanol productions at the optimum levels of fermentation conditions were also determined by using Eq. (3). The maximum ethanol concentration of 104.5 g/l appeared when temperature, glucose concentration, and initial pH were 28.1 °C, 241 g/l, and pH 7.4, respectively.
Response surface analysis
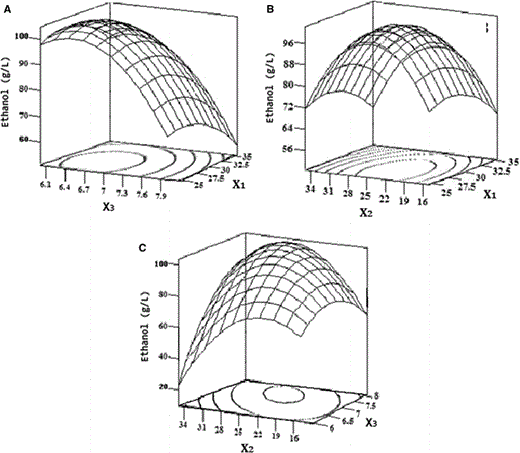
Response surface and contour plot of the effect on the ethanol production. X 1 was temperature, X 2 was glucose concentration (g/l), X 3 was initial pH, and Y was ethanol concentration (g/l). a Responsive surface of Y = f(X 1, X 3). b Responsive surface of Y = f(X 1, X 2). c Responsive surface of Y = f(X 2, X 3)
Optimization of fermentation conditions in HYM
To further validate the model accuracy and effectiveness, ethanol fermentation experiments of Zymomonas mobilis HYM were performed under the best conditions six times, with temperature, glucose concentration, and initial pH being 28.1 °C, 241 g/l, and pH 7.4, respectively. The ethanol concentrations of the six experiments were 106.5, 105.5, 107.0, 103.1, 104.5, and 103.9 g/l, respectively. These six experiments yielded an average maximum ethanol concentration of 105.1 g/l.
Discussion
Ethanol-producing bacteria Z. mobilis have attracted much attention in recent years because their growth rate is substantially higher than that of the Saccharomyces presently used for practical production of fuel alcohol, and with the recent advances in biotechnology, it has the potential to play a key role in making production of ethanol much more economical [5]. In nature, Z. mobilis is found in high sugar-content solutions fermenting sugars to ethanol in a high-yield and high-productivity process. It has several advantages over yeast. Ethanol yield of Z. mobilis is as high as 97 % of theoretical yield when glucose or fructose is the substrate. It has a high specific ethanol productivity that is up to 2.5 times higher than yeast. It can tolerate up to 400 g/l glucose, up to 160 g/l ethanol, and up to 8 g/l acetic acid (at pH 6) [11]. Its ability to grow at lower pH (5.0–5.5) helps to reduce the aseptic requirements for fermentation, thus rendering the fermentation process more economical.
The growth of Z. mobilis has long been known to require lysine, methionine, and the whole-genome sequencing had revealed the specific reasons for these deficiencies. The only genes missing for lysine and methionine synthesis are yfdZ and metB, respectively [6]. Herein for the first time, a variant of Z. mobilis was achieved by genome integration of the bi-cistronic yfdZ and metB genes from E. coli, which lead to the fact that a strain can grow in simple chemical defined medium without the addition of amino acid. Pfu-sHSP is a kind of α-crystallin homologue protein that can act as a molecular chaperone, preventing membrane destabilization or aggregation of denatured proteins under heat and other stress. Therefore it can potentially be used to maintain cell viability under unfavorable conditions, such as heat shock or chemical treatments. Herein, for the first time, we proved that the Pfu-sHSP gene containing Z. mobilis showed a significantly improved tolerance to heat stress.
Although plasmids may be readily maintained in Z. mobilis when cultivated in mono-culture under controlled conditions, they frequently become unstable when grown in the absence of antibiotic selection pressure. Instability may be exacerbated when Z. mobilis has to compete with other organisms in a mixed culture. In addition, antibiotic usage for plasmid maintenance is generally perceived as undesirable for industrial application. Thus, a Tn5-based random mutagenesis system was used in this research to integrate the cloned genes into the Z. mobilis genome where they were maintained at a low natural copy number and were thus not over-expressed, and where, at least theoretically, they should be as stable as genome DNA.
As low-cost industry fermentations may always be carried out in rather poor, toxic, viscous, nutrient-limited mediums, successful fermentations to produce ethanol using Z. mobilis require not only the capability to convert sugar to ethanol with high speed and yield but also the tolerance to stresses such as high-temperature and low-nutritional conditions. These cellular characteristics are important because high temperature in summer and low nutritional concentration at the end of a batch are common in the ethanol industry. In this research, three foreign genes (yfdZ and metB from E. coli, Pfu-sHSP from P. furiosus) were integrated into the genome DNA of CP4 to create the Z. mobilis HYM through Tn5 transposon-mediated transposition. The recombinant strain HYM has the following characteristics listed below at the same time: it can grow in simple chemical defined medium without the addition of amino acid; it can ferment glucose to produce ethanol with high yield; having high tolerance to high temperature and lower nutrient; the high-performance fermentation characteristics were stable up to 100 generations on nonselective medium.
The RSM with BBD was successfully used in this research to determine the importance of factors at different levels and to determine the accurate values of the fermentation conditions for the maximum ethanol production of HYM. The maximum ethanol concentration of HYM was 104.5 g/l when temperature, glucose concentration, and initial pH were 28.1 °C, 241 g/l, and pH 7.4, respectively. Compared with the predicted levels of ethanol concentration was 104.5 g/l by the BBD, the verified value was 105.1 g/l showed that the positive deviation was 0.55 %6. The good agreement between the predicted and experimental results verified the validity of the model and the existence of the optimal point. After the optimization, the ethanol production increased by 6.5 % compared to that without optimization. Theoretically, 100 g of glucose will produce 51.4 g of ethanol and 48.6 g of carbon dioxide. Under the optimized conditions, the ethanol yield of HYM was 0.44 g/g (ethanol/sugar) with a theoretical yield as 85.6 %, which was very close to that of the theoretical value.
Our results demonstrated that HYM can be an alternative cost-effective bio-ethanol producer for ethanol production that is much less sensitive to temperature and nutritional changes.
Acknowledgments
We gratefully acknowledge the financial support from the National Natural Science Foundation of China (NSFC) (Project No. 30870798), Hubei Provincial Innovative Research Team in University (Project No. T200705), and the Scientific Research Key Project of Hubei Provincial Department of Education (Project No. Z200614001). Haoyong Wang also thanks the Scientific Research Foundation for the Returned Overseas Chinese Scholars (Ministry of Personnel, State Education Ministry and Hubei Provincial Department of Personnel).
Conflict of interest
The authors declare that they have no competing interests.


