


Abstract
This work aims to: (1) correlate photochemical activity and productivity, (2) characterize the flow pattern of culture layers and (3) determine a range of biomass densities for high productivity of the freshwater microalga Chlorella spp., grown outdoors in thin-layer cascade units. Biomass density, irradiance inside culture, pigment content and productivity were measured in the microalgae cultures. Chlorophyll-fluorescence quenching was monitored in situ (using saturation-pulse method) to estimate photochemical activities. Photobiochemical activities and growth parameters were studied in cultures of biomass density between 1 and 47 g L−1. Fluorescence measurements showed that diluted cultures (1–2 g DW L−1) experienced significant photostress due to inhibition of electron transport in the PSII complex. The highest photochemical activities were achieved in cultures of 6.5–12.5 g DW L−1, which gave a maximum daylight productivity of up to 55 g dry biomass m−2 day−1. A midday depression of maximum PSII photochemical yield (F v/F m) of 20–30% compared with morning values in these cultures proved to be compatible with well-performing cultures. Lower or higher depression of F v/F m indicated low-light acclimated or photoinhibited cultures, respectively. A hydrodynamic model of the culture demonstrated highly turbulent flow allowing rapid light/dark cycles (with frequency of 0.5 s−1) which possibly match the turnover of the photosynthetic apparatus. These results are important from a biotechnological point of view for optimisation of growth of outdoor microalgae mass cultures under various climatic conditions.
Introduction
Outdoor open ponds, or raceways, represent the most frequently employed technology for mass microalgae cultures due to their low construction cost [1]. In these cultivation units, a culture layer of 15–30 cm is usually adopted, and this determines an areal volume of at least 150–300 L m−2. Such a volume requires the maintenance of a rather low biomass density (approximately 0.5 g DW L−1), which in turn increases the costs of harvesting and pond maintenance. Another important drawback of open ponds is the limited possibility of controlling temperature. This is particularly important for mesophilic organisms such as cyanobacteria with usual temperature optima of around 35°C, a temperature reached in open ponds only in summer for a limited period during the day. By contrast, in open thin-layer systems, microalgal suspension is circulated over a flat surface exposed to solar irradiance [2]. Due to the short optical path (<10 mm), light utilisation is more efficient and high densities of biomass (25–35 g L−1) can be operated. These units are characterized by their high ratio of exposed surface area to total culture volume (S/V of ~100 m−1) and highly turbulent flow, which enables high volumetric and areal productivity compared with that of open ponds (S/V < 10 m−1). Thin-layer cascades are also easily heated up by solar irradiance, but on the other hand they are also spontaneously cooled by water evaporation at higher temperatures.
Declined-surface cultivation cascades, consisting of glass plates covered with baffles supported by a steel structure, were designed in the 1960s by Šetlík et al. [2]. These were later modified to the present thin-layer system [3, 4]. Its short light path in combination with the high cell density and intensive turbulence enables cells to be exposed to intermittent light with short light/dark cycles, thus avoiding over-reduction of photosynthetic electron carriers.
Optimal cultivation conditions and a practical photobioreactor design for mass microalgal cultures have often been determined semi-empirically through long experience, requiring numerous series of experiments. Since the mid-1990s, a significant contribution to microalgal biotechnology has been achieved by the introduction of modern photobiochemical methods, mainly chlorophyll (Chl) fluorescence. Using this method, we can monitor the photosynthetic activity of microalgae cultures in outdoor systems [5–8]. Chl-fluorescence monitoring has proven a suitable technique for measuring photochemical performance, being fast, non-invasive and easy to measure.
At present, basically two Chl-fluorescence approaches are used to monitor photosynthetic efficiency in microalgal mass cultures: fast fluorescence induction kinetics and the saturation-pulse method. Although fluorescence parameters can be measured easily, some problems may arise when they are used to predict changes in photosynthetic performance. Even though the theory is well described at present [9–11], interpretation of fluorescence signals might not be straightforward, particularly when dealing with microalgae [12, 13]. In particular, problems associated with accurate estimation of PSII efficiency and the roles of photochemical and non-photochemical quenching as measured by fluorescence and its relationship with the rates of linear electron flux and CO2 assimilation have to be carefully judged.
The principle of in situ modulated Chl-fluorescence measurement in turbulent microalgal cultures is based on the assumption that signal modulation is two orders of magnitude faster than the suspension movement in a cultivation unit. Some physiologically useful expressions have been derived from saturation-pulse analysis of fluorescence quenching, which allow deep insights into a plant’s capacity to cope with (excess) excitation energy [10, 11, 14–16].
In microalgae biotechnology, the major goal is to achieve higher yields and volumetric productivity. As part of our present studies, we have focussed on the regulation and control of cultivation systems and the diagnostics of microalgae mass cultures from the photosynthetic point of view. We aim to correlate the culture productivity of the freshwater microalga Chlorella grown in outdoor thin-layer cascade units to photochemical activities in order to study the growth physiology of a mass culture. This information is crucial to optimise the productivity of outdoor cultures at different densities.
Materials and methods
Cultivation unit design
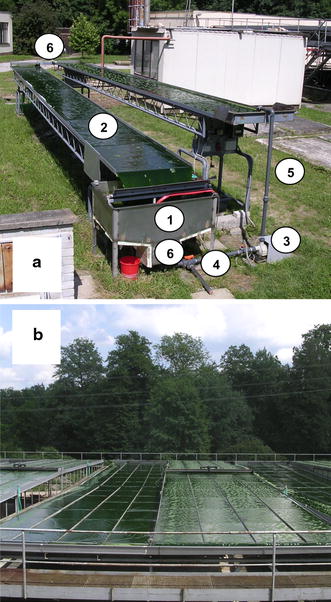
a Outdoor experimental unit for cultivation of microalgae where a thin layer (~6 mm) of microalgal suspension flows along a declined surface (24 m2) with a volume of 170–225 L and surface/volume ratio (S/V) of 100–135 m−1. The unit consists of two declined cultivation lanes made of glass plates supported by scaffolding. It is made up of several parts: (1) retention tank (degasser), (2) inclined cultivation surface, (3) circulation pump, (4) CO2 supply and a three-way valve. The lower end of the upper lane is connected by a trough to the beginning of the lower lane, which is inclined in the opposite direction. The suspension flows into the retention tank (degasser), from where it is pumped by a circulation pump via a riser (5) back to the upper part of the cultivation area, where it is distributed by a perforated tube. Measurement and control sensors (pH, dissolved oxygen, temperature and liquid level) are mounted in the degasser and in the connecting trough (6). The cycle takes about 60–80 s, which can be varied by altering the pump velocity. The suspension can be harvested via a three-way valve (4). The whole system is controlled by computer software which enables regulation of the cultivation process and data acquisition. b Production unit of 224 m2 with working volume of 2.2 m3 and S/V ratio of 102 m−1. This unit is about ten times larger than the experimental unit
The experimental unit consists of two sloped cultivation lanes where the lower end of the upper lane is connected by a trough to the beginning of the lower lane, which is declined in the opposite direction (Fig. 1a). The suspension flows into a retention tank (degasser), from where it is circulated by a pump via a riser (a return pipe) to the upper part of the cultivation area. Special software (based on LabView, National Instruments) has been designed to enable automatic control and data acquisition of the culture parameters in the experimental unit. The culture’s behaviour was monitored by temperature, pH and dissolved oxygen concentration sensors. CO2 supply was controlled by an electronic valve according to pH. The construction of the degasser (retention tank) enabled adjustment of the dark volume of the culture to increase the exposed surface-to-total volume (S/V) ratio of the unit.
The production unit area of 224 m2 (S/V = 102 m−1) is about ten times larger than the experimental unit. It consists of two symmetrical halves, each consisting of four lanes running parallelly back and forth for 14 m (Fig. 1b).
Organism and culture conditions
The experiments were carried out with the microalga Chlorella spp. from the culture collection of the Laboratory of Algal Biotechnology at the Institute of Microbiology (Třeboň, Czech Republic). Its laboratory growth optimum is about 30°C, but it is able to grow at up to 35–37°C without appreciable reduction of productivity. Most of the measurements were carried out between 07:00 and 19:00 h (GMT) on clear and sunny days with stable irradiance through the day in June and July. The daily cultivation period was determined by switching the circulation system on/off. Overnight (dark period), or under unfavourable weather conditions, the culture suspension was kept in the retention tank and mixed by air bubbling. The cultures were grown photoautotrophically in a mineral medium in a fed-batch regime [4]. Nutrients were supplied twice a day according to culture consumption. pH was maintained at the optimal value of 7.6 ± 0.2 by automatic injection of pure CO2, or controlled manually in the range 7.4–7.9. The temperature ranged between 22°C and 36°C. In the morning (08:00 h) the irradiance intensity was about 0.4 mmol photon m−2 s−1, reaching up to 2 mmol photon m−2 s−1 at midday (13:00 h).
At the start of the experiment, the cultures were diluted with fresh medium to the required biomass density. The dissolved oxygen concentration of about 12 mg L−1 was measured at 08:00 h, while it peaked at 25–30 mg L−1 around midday.
Hydrodynamic characterization of suspension flow in cascades
To analyze the fluid pattern in a cascade cultivation system which consists of a series of flat plates, it is necessary to consider parameters such as the film (layer) thickness s, the speed u of the suspension flow, and the Reynolds number N r in various situations.
Schematic diagram of the flow pattern on the inclined surface of the cascade cultivation system. The system is modelled as a layer of fluid moving on a plane surface in a stationary regime with two main (horizontal) directions labelled x and y, and the third orthogonal axis z being neglected
In fluid mechanics, the Reynolds number N r is a dimensionless number that gives a measure of the ratio of inertial forces to viscous forces and consequently quantifies the relative importance of these two types of forces for given flow conditions.
Analytical procedures
The dry weight (DW) of the microalgae culture was measured for triplicate 2-mL samples by drying the biomass obtained by centrifugation of culture in pre-weighed Eppendorf tubes. Pigment content (Chl a and b, total carotenoids) was determined spectrophotometrically in 80% acetone [19]. The amounts of individual carotenoids were assessed by high-performance liquid chromatography (HPLC) using a procedure of Gilmore and Yamamoto [20] with modified elution gradient (the methanol/n-hexane ratio of solvent B was changed from 4:1 to 4.5:1), isocratic elution with solvent B prolonged from 4.5 to 7.5 min, and a chromatography column thermostated at 20°C.
Chl-fluorescence measurements
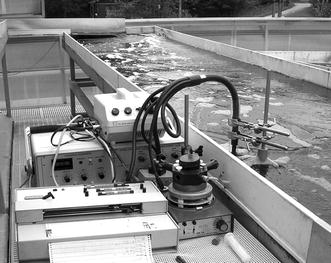
In situ monitoring of Chl-fluorescence quenching using a fibre-optic guide and a pulse-amplitude-modulation fluorometer (PAM 101-103, H. Walz) connected to a recorder in the outdoor cascade units. The fibre-optics (angle to the sun being about 60°) was protected within a glass test tube and submerged about 3 mm into the microalgal suspension. Dark-adapted samples were measured in a stirred, temperature-controlled cuvette of the emitter-detector unit ED-101US (H. Walz, Germany) coupled to the fluorometer
Simultaneously, the polyphasic kinetics of Chl-fluorescence induction was monitored using a dual-modulation fluorometer (FL-2000, Photon Systems Instruments Ltd., Brno, Czech Republic) during the first second of illumination of the dark-adapted culture samples (diluted to concentration of 0.2 g biomass L−1). The so-called OJIP test was used to evaluate photosynthetic activity [11].
Light, pH and temperature measurements
Photosynthetically active radiation (PAR) was measured as 15-s average values using either the US-SQS/B spherical micro quantum sensor (watertight scalar irradiance; H. Walz, Germany) or the LI-190SA quantum sensor (cosine-corrected up to 80° angle of incidence) coupled to the LI-250 light meter (Li-Cor, USA). A pH/Oxi340i meter and electrodes (WTW, Germany) were used to control temperature, pH and dissolved oxygen concentration; otherwise these variables were recorded automatically by sensors.
The series of experiments was repeated over several days, and one typical experiment was taken for presentation of data in the figures. Optical density of all cultures was measured in a 1-cm cuvette using microalgal samples diluted to the absorbance value of 0.10–0.15.
Data statistical analysis
The analysis of biomass productivity variance was performed in the cultures grown at various biomass concentrations, and the mean separation was done by Tukey’s test, using one-way analysis of variance (ANOVA; Statigraph version 5.1, Manugistis Inc.).
Results
Diel changes of chlorophyll, carotenoids and zeaxanthin content and the Car/Chl ratio in Chlorella cultures grown in outdoor cascade units at various biomass densities
| Time [hh:mm] | Biomass concentration [g L−1] | Carotenoids [mg L−1] | Chlorophyll a + b [mg L−1] | Car/Chl ratio | Zeaxanthin [% of total carotenoids] |
|---|---|---|---|---|---|
| 08:00 | 1.2 | 6 | 39 | 0.16 | 0.1 |
| 10:00 | 1.8 | 11 | 51 | 0.21 | 2.8 |
| 13:00 | 2.5 | 15 | 62 | 0.25 | 3.0 |
| 18:00 | 3.9 | 19 | 90 | 0.21 | 0.4 |
| 07:30 | 2.3 | 12 | 81 | 0.15 | 0.1 |
| 13:00 | 4.7 | 25 | 121 | 0.21 | 0.8 |
| 18:00 | 6.7 | 34 | 201 | 0.17 | 0.4 |
| 07:30 | 6.0 | 24 | 161 | 0.15 | – |
| 13:00 | 9.1 | 43 | 252 | 0.17 | 0.4 |
| 18:00 | 12.4 | 57 | 355 | 0.16 | – |
The relationship between optical density and biomass concentration (triangles), chlorophyll content (circles) and cell number (squares) measured in Chlorella cultures of various biomass densities. All points represent a mean of three measurements. The relationship between optical density and the three variables was linear according to regression equations: y = 1.0287 × x (R 2 = 0.997) for biomass concentration; y = 28.9 × x (R 2 = 0.997) for chlorophyll content; y = 0.0304 × 10¹² × x (R 2 = 0.990) for cell number. These are represented by the common parametric function y = K × 1.0071 × OD (SD from the average is also included). The corresponding K values are: K = 1.0287 g L−1 for biomass, K = 28.9 mg L−1 for chlorophyll content and K = 0.0302 × 10¹² cells L−1 for cell count. Per gram of dry weight, the Chlorella cultures contain ~30 × 1012 cells and ~28 mg chlorophyll a + b. The conversion coefficient between optical density (OD750) and dry weight is about 1.03
Flow pattern in a cascade cultivation system
The calculated values, compared with those measured in situ, showed that the fluid flow in cascades is well represented by the model of a free-surface open channel (Table 2).
Provisional calculations carried out to predict the behaviour of the fluid flow prior to the first installation
| Parameter | Designed | Calculated | Measured |
|---|---|---|---|
| Q [m3 s−1] | 0.0027 | ||
| S 0 | 0.017 | ||
| Z [m] | 1 | ||
| N (glass sheets) | 0.01 | ||
| S [m] | 0.0062 | 0.0060 | |
| U [m s−1] | 0.44 | 0.50 | |
| N r | 4485 | 4940 |
| Parameter | Designed | Calculated | Measured |
|---|---|---|---|
| Q [m3 s−1] | 0.0027 | ||
| S 0 | 0.017 | ||
| Z [m] | 1 | ||
| N (glass sheets) | 0.01 | ||
| S [m] | 0.0062 | 0.0060 | |
| U [m s−1] | 0.44 | 0.50 | |
| N r | 4485 | 4940 |
The parameters and variables are designated as follows: Q—culture flow rate (m3 s−1), S 0—slope of photobioreactor surface (dimensionless), Z—width of photobioreactor lane (m), N—Manning factor (dimensionless), S—thickness of culture layer (m), U—free-surface flow (m s−1), N r—Reynolds number (dimensionless)
The value of the Reynolds number N r was about 4,500, while the value characteristic for laminar flow in open channels is only about 500. As a result, the N r value in our thin-layer cascades was about one-half of that recorded for a fully turbulent flow (N r > 12,500). Nevertheless, the cascade is characterized by a substantially uniform speed profile which can be easily disturbed by inhomogeneities of the flow surface (i.e. roughness of the bottom and side walls and random asperities such as connections between plates). Such an effect is beneficial by increasing the interface for light dilution and liquid–gas exchange surface. Fluid flow perturbations on the surface are responsible for the creation of small localized non-laminar fluid patterns which induce intermittent illumination of cells. As moving waves, they can create thickening of the microalgal culture, which contributes to this effect. These superficial waves have to be investigated to provide an approximate value for the duration of average light/dark (L/D) cycles.
The calculated values describe the speed of the wave as approximately one-half of that of the fluid, which means non-stationary waves in a supercritical fluid flux. Due to fluid film continuity, and to the relative wave speed, the culture moves from a shaded region to a well-illuminated region with a frequency that is easily derived from the ratio of the total L/D changes over the length covered. For a flow speed on the control section of 0.5 m s–1, the theoretical calculations predict a total wavenumber of 2.1 (0.5/0.243), which results in a L/D cycle frequency of 0.476 s−1.
Experimental observations confirmed this calculation, even if a number of unpredicted waves appeared in the proximity of side-wall junctions and plate connections; however, these merely contribute towards increasing the intermittent L/D pattern due to the loss of local laminarity in the transitional fluid behaviour. Moreover, visual observations also confirmed the formation of waves on the lateral walls and at the connections between the bottom glass plates (placed 2-m apart) which act as static mixers, causing rotation of the liquid.
Diel courses of temperature and irradiance
a Diel course of ambient irradiance (measured horizontally with a cosine-corrected sensor) and temperature in a Chlorella culture (biomass density about 10 g L−1). b Diel course of ambient irradiance measured by cosine-corrected (horizontally, 80° angle of incidence) and spherical light sensors (all-direction integrated irradiance). The irradiance impinging on the Chlorella culture (biomass density about 10 g L−1) was also measured using the watertight spherical sensor, which showed the fraction of light penetrating into the microalgae suspension. Since the diameter of this sensor is 3 mm and the depth of the culture was about 6 mm, we were able to measure the surface and bottom half of the culture layer
Diel changes in maximum PSII photochemical yield F v/F m (a), actual photochemical yield ∆F/F m′ (b) and non-photochemical quenching NPQ (c) in Chlorella mass cultures grown at different biomass concentrations (1.2–4, 2.5–6.5, 6.5–13.5, 13.5–18 and >40 g L−1) in outdoor thin-layer cascade units
As an example, measurements of irradiance intensity are shown in a culture with biomass concentration of about 11 g L−1 that had high productivity; this supposed that sunlight in this culture was being used highly efficiently. The diel course of irradiance was measured by using a spherical light sensor (all-direction integrated irradiance) at the layer surface and bottom (Fig. 5b). As the diameter of this sensor is 3 mm and the culture depth was about 6 mm, we could measure the surface and bottom half of the layer. In a highly productive culture, as in this case, the average diel irradiance close to the surface was about 0.4 mmol photon m−2 s−1, while at the bottom it was about 0.15 mmol photon m−2 s−1. This demonstrates that, in the most productive cultures, the cells remained at saturating irradiance (between 10% and 20% of maximum ambient irradiance [21]) for most of the day, except for a few hours during the morning and afternoon. Maxima of about 0.65 and 0.25 mmol photon m−2 s−1 were measured at midday in the surface and bottom layers of this (11 g DW L−1) microalgae culture, respectively.
Diel courses of photobiochemical activity: chlorophyll-fluorescence parameters
To correlate photobiochemical activities with pigment composition and maximum productivities, diel trends of chlorophyll fluorescence were monitored in Chlorella cultures of various biomass concentrations. One of the primary aims of these measurements was to find suitable monitoring parameters calculated from fluorescence quenching analysis to follow the status of the photosynthetic apparatus and its correlation to biomass productivity. In a healthy culture of Chlorella, the morning value of F v/F m was above 0.7. If this morning value (taken under low irradiance at 07:00–08:00 h) was below 0.60, then photobiochemical activity was significantly decreased, the culture was not in good shape, and its growth was unsatisfactory. Diel trends of F v/F m showed that diluted cultures with biomass concentration of 1.2–4 g L−1 were photoinhibited, as evidenced by a dramatic (48%) decrease at midday when compared with the morning values. However, the cultures recovered more than 90% of their initial activity in the afternoon (Fig. 6a). In contrast, at high biomass concentrations (>40 g L−1), the midday depression of F v/F m did not exceed 13%, which illustrates how little the high midday irradiance influences these thick cultures. In the cultures with medium biomass concentrations (2.5–6.5, 6.5–13.5 and 13.5–18 g L−1), the midday decrease of F v/F m ranged from 19% to 26%, and the cultures had also fully recovered by 18:00 h.
The diel courses of ∆F/F m′ (actual quantum PSII yield in the light-adapted state) at various biomass concentrations showed even more differentiated trends (Fig. 6b) than those of F v/F m. In the thick cultures with biomass concentrations over 40 g L−1, ∆F/F m′ dropped by just 12%. In the cultures with medium biomass concentration the midday value of ∆F/F m′ decreased by 20–23%, and the cultures almost fully recovered by 18:00 h. The most diluted culture (biomass concentration 1.2–4 g L−1) suffered significantly from photoinhibitory stress (seen as fluorescence quenching), since even the morning ∆F/F m′ value was only 0.42, which is 30–40% less than in the denser cultures, and it decreased further during the morning hours. However, this low-biomass culture was also able to recover just as with the thicker cultures, reaching a ∆F/F m′ value of 0.58 by 18:00 h (Table 1, Fig. 6b). The course of non-photochemical quenching NPQ in the cultures was inversely related to the changes of ∆F/F m′ (Fig. 6b, c). Interestingly, the most significant increase in NPQ was found in the two most diluted cultures at 10:00 h, after which the values of NPQ decreased as the cultures grew and became acclimated to high irradiance. The peak in NPQ was delayed with increasing concentration of the culture and almost coincided with the peak of light in dense culture (40 g DW L−1).
Rapid Chl-fluorescence induction kinetics of Chlorella cultures measured at midday in cultures of low and optimum biomass density (2.3 versus 6.5 g DW L−1). The curves were double-normalised to F 0 and F m to distinguish differences in the intermediate steps J and I, which represent various reduction states of the PSII electron carriers. Three to five records were averaged to construct each induction curve
Gross (daylight) productivity of Chlorella cultures at various biomass concentration (1.2–4, 2.5–6.5, 6.5–13.5, 13.5–18 and >40 g L−1) in outdoor thin-layer cascade units. Bars denoted by different letters differ significantly at P ≤ 0.01 on one-way ANOVA
Growth curves measured as biomass concentration changes (g L−1) in the experimental (24 m2, S/V ratio = 133 m−1) and production unit (225 m2, S/V ratio = 102 m−1) during a 17-day cultivation cycle
Biomass productivity of experimental (24 m2, S/V ratio = 133 m−1) and production (224 m2, S/V = 102 m−1) units calculated as a mean value for 17-day cultivation cycles in the period from June to September 2007
| Productivity [g DW m−2 day−1] | Production unit, S/V = 102 m−1 | Experimental unit, S/V = 133 m−1 |
|---|---|---|
| Net (24-h) | 14.3 (±4.11) | 18.7 (±5.14) |
| Gross (daylight) | 38.4 (±4.77) | 52.1 (±4.08) |
| Productivity [g DW m−2 day−1] | Production unit, S/V = 102 m−1 | Experimental unit, S/V = 133 m−1 |
|---|---|---|
| Net (24-h) | 14.3 (±4.11) | 18.7 (±5.14) |
| Gross (daylight) | 38.4 (±4.77) | 52.1 (±4.08) |
Standard deviation (SD) is given in parenthesis
Discussion
Maximizing light conversion efficiency in outdoor cultures is one of the key factors for improving the economy of the process. In principle, to reach the highest efficiency of biomass production in a microalgal culture, it is necessary to expose each single microalgal cell to a light intensity just up until the point at which the photosynthesis rate versus light intensity starts to flatten out (0.2–0.4 mmol photon m−2 s−1). This goal is difficult to reach in thick mass cultures because of the self-shading effect of cells. It depends on the culture depth, biomass concentration and mixing rate parameters, all of which are determined by the type of photobioreactor. In the outdoor thin-layer cascade units used in our experiments, microalgae cells can encounter three ranges of intermittent illumination (L/D cycles): (1) high-frequency fluctuations lasting hundreds of milliseconds, which are related to the movement of cells on the illuminated surface, (2) medium-frequency fluctuations of seconds to minutes, mostly related to the alternation between light exposure of the cells on the flat planes and their ‘dark’ stay in the pumps, tubing and retention tanks and (3) low-frequency cycles of hours to days given by clear/cloudy sky shifts and day/night cycles [22, 23].
The high-frequency light fluctuations caused by turbulent movement of cells during the light exposure phase is most desirable. On the one hand, it prevents over-saturation of photosynthesis in surface-exposed cells, and on the other, consumption of energy via respiration in cells located in deeper layers exposed to weak light or complete darkness [26]. In our cascade units, a thin layer of microalgal culture supported by sufficient turbulence represents a suitable system for achieving such a high frequency of intermittent L/D illumination. Wave formations in the culture increase its optical cross-section, favouring dilution of light and thus an increase in the efficiency of light transformation. On the whole, these factors accounted for the relatively high efficiency of light transformation reached in the cascades, which was about 10% (estimated based on visible light and daylight productivity), much higher than that usually achieved in open ponds, i.e. about 3% efficiency based on visible light, and assuming a biomass yield of 15 g m−2 day−1.
Despite the presence of high-frequency intermittent illumination on the planar surfaces of the cascades, a photostress-related decrease in photosynthetic performance could not be completely avoided and was especially apparent in cultures with low biomass concentration (1–4 g L−1). This phenomenon, commonly referred to as ‘photoinhibition’ of photosynthesis, could be illustrated by the light-induced depression in the maximum and actual quantum yield of PSII photochemistry, measured as F v/F m and ∆F/F m′ (Fig. 6a, b), respectively, and by the strong increase in the J-phase of the chlorophyll-fluorescence transient (Fig. 7). This increase is assumed to reflect the inactivation of PSII reaction centres, which is related to over-reduction of quinone electron acceptors (Fig. 7) [11]. In the optimum-density (6.5–18 g biomass L−1) cultures, the highest productivity was correlated with a 25% decrease in the midday maximal PSII photochemical yield (F v/F m or ∆F/F m′) in the dense cultures this decrease was about 10%, which supports the theory that these cultures are shade-adapted and grow at sub-saturating irradiance [8, 21].
Interestingly, in the diluted cultures, the peak of NPQ in particular was reached well before the peak of light intensity (Fig. 6c), demonstrating a necessity to dissipate light in the morning hours when the irradiance was rising steeply and the culture temperature was still sub-optimal [28]. In diluted cultures, the depression in fluorescence parameters was also accompanied, particularly at midday, by the appearance of zeaxanthin (Table 1), an indicator of dissipation of excess light via non-photochemical quenching. In our experiments, the xanthophyll cycle was found to be functional in various green microalgae; however, the content of zeaxanthin normalised to chlorophyll was significantly lower than that reported from higher plants, and its contribution to non-photochemical quenching is not as significant as in higher plants, or it can vary among microalgal species [8].
The positive effect of fast light/dark cycles in hundreds of milliseconds seems to be related to the similar rate of turnover of the photosynthetic apparatus. By contrast, the effect of medium-frequency fluctuations on light transformation efficiency [22, 24, 25] is mostly given by the S/V ratio of the photobioreactor. Comparison of the same type of thin-layer cascades with different S/V ratios demonstrates the importance of this parameter for culture productivity. As expected, higher biomass density at the end of experiment was reached in the experimental unit with the higher S/V ratio compared with that of the production unit (Fig. 9). However, this difference would have only a relative benefit (e.g. by reducing the cost of harvesting), if it were not accompanied by higher biomass productivity (expressed in g m−2 day−1; Table 3). Indeed, over 17 days of cultivation the mean values for productivity were also higher for the experimental unit by about 30%. Such a difference can become significant during large-scale cultivations, and therefore these results point to the importance of maximally reducing the culture volume in the dark part of the photobioreactor, in which cells consume biomass (carbohydrates) by respiration [27].
In conclusion, we can point out some strengths of the thin-layer cascade system for mass culture as compared with open ponds and raceways, as well as some general findings valid for other cultivation units. The thin-layer cascades are beneficial due to the increased interface for light dilution and liquid–gas exchange:
High ratio of exposed surface to total volume (S/V) guarantees high biomass productivity of cascade units, which can be operated up to high biomass density (up to 45 g L−1).
A hydrodynamic model of the culture demonstrated its highly turbulent flow that allows rapid light/dark cycles (with frequency of about 0.5 s−1), which match the turnover of the photosynthetic apparatus.
The decline in the F v/F m value of about 25% at midday represents a useful indicator of highly productive cultures.
Thin-layer cascades bring together some advantages of both open and closed cultivation systems. One can consider these units as a low-cost system that shows promise for such purposes as ample biomass production for biofuel [29].
Acknowledgments
The authors thank Mr. Radek Plch, Ms. Jana Hofhanzlová, Ms. Lada Samcová and Mr. Petr Novotný for technical assistance, Mr. Jan Červený for software set-up, Mr. Pavel Souček for preparation of diagrams, Prof. Josef Komenda for critical discussion, Dr. Steve Ridgill for language corrections, Dr. AnnaRita Leva for statistical analysis and three anonymous reviewers for their constructive remarks. Travel support to G.T. was funded from bilateral scientific agreement between the Italian CNR and the Czech Academy of Sciences. The Czech Science Foundation supported this work through projects 522/06/1090 and 521/09/0656. Partial funding was also provided by project MSM6007665808 of the Ministry of Education and by project AVOZ 50200510 of the Czech Academy of Sciences, and by Italian MIUR (Ministero dell’Istruzione, Università e Ricerca), FISR 2002, prot. N. 1756 828.07.2005, and by the Italian Space Agency (project MoMa contract number I/014/06/0).
References
Masojídek J, Vonshak A, Torzillo G (2009) Chlorophyll fluorescence applications in microalgal mass cultures. In: Suggett DJ, Prášil O, Borowitzka MA (eds) Chlorophyll a fluorescence in aquatic sciences: methods and applications (in press)
- Chl
Chlorophyll
- Car
Carotenoids
- DW
Dry weight
- F 0, F v, F m
Minimum, variable and maximum fluorescence in dark-adapted cultures
- F′, F m′
Actual and maximum level of fluorescence in light-adapted cultures
- F v/F m
Maximum quantum yield of PSII
- ∆F/F m′
Actual quantum yield of PSII
- L/D
Light/dark
- NPQ
Non-photochemical quenching (F m/F m′ − 1)
- N r
Reynolds number
- PSII
Photosystem II
- PQ
Plastoquinone
- Q
Quinone
