


Abstract
Cultivation of extremophile microorganisms has attracted interest due to their ability to accumulate high-value compounds. Chlamydomonas acidophila is an acidophile green microalga isolated by our group from Tinto River, an acidic river that flows down from the mining area in Huelva, Spain. This microalga accumulates high concentrations of lutein, a very well-known natural antioxidant. The aim of this study is to assess use of different carbon sources (CO2, glucose, glycerol, starch, urea, and glycine) for efficient growth of and carotenoid production by C. acidophila. Our results reveal that growth of the microalga on different carbon sources resulted in different algal biomass productivities, urea being as efficient as CO2 when used as sole carbon source (~20 g dry biomass m–2 day–1). Mixotrophic growth on glucose was also efficient in terms of biomass production (~14 g dry biomass m–2 day–1). In terms of carotenoid accumulation, mixotrophic growth on urea resulted in even higher productivity of carotenoids (mainly lutein, probably via α-carotene) than obtained with photoautotrophic cultures (70% versus 65% relative abundance of lutein, respectively). The accumulated lutein concentrations of C. acidophila reported in this work (about 10 g/kg dry weight, produced in batch systems) are among the highest reported for a microalga. Glycerol and glycine seem to enhance β-carotene biosynthesis, and when glycine is used as carbon source, zeaxanthin becomes the most accumulated carotenoid in the microalga. Strategies for production of lutein and zeaxanthin are suggested based on the obtained results.
This article is part of the BioMicroWorld 2009 Special Issue.
Introduction
Cultivation of extremophile microorganisms has attracted interest due to their ability to accumulate high-value compounds, namely metabolites, enzymes, surfactants, etc. [1]. Microalgae can also be found among extremophile microorganisms that grow in, e.g., extreme-pH, high-salinity or high-temperature environments [2]. Moreover, microalgae have been widely recognized as producers of valuable compounds, including carotenoids [3]. The acidic drainages from the mining area in Huelva (Spain) constitute an extreme environment where many extremophile microorganisms (most of them bacteria and green microalgae) are able to obtain metabolic energy from sulfur and iron oxidation. From this low-pH environment, our group isolated the acidophile microalga Chlamydomonas acidophila. The extreme oxidative conditions of such an environment [4] suggest that those microorganisms that grow in the river should express antioxidant mechanisms to defend themselves from oxidative stress. For this reason, our group studied the biotechnological value of C. acidophila for production of antioxidants.
In this regard, C. acidophila accumulates high concentrations of lutein, a very well-known antioxidant also accumulated by other “common” microalgae [5, 6]; this compound has recently attracted interest for use in treatment of oxidative pathologies such as macular degeneration [7, 8]. Lutein is a xanthophyll, an oxygenated carotenoid. Carotenoids are produced through the carotenogenesis pathway, which starts from basic precursors for terpenoids, including piruvate and acetyl-coenzyme A (CoA) [9]. In particular, xanthophylls are synthesized from very basic C5-isoprenoid compounds which first elongate to phytoene (C40) [10, 11] and are further processed to lycopene and cyclic carotenoids including α,β,γ-carotenes (C40) [12]. Carotene oxidation leads to lutein. Some of the organic carbon sources selected to grow C. acidophila cultures are closely related to carotenoid biosynthesis. Both acetate and glycerol are precursors for acetyl-CoA biosynthesis. Glycine, a combined source of carbon and nitrogen, was chosen due to its possible role in zeaxanthin production. Previous research at our laboratory [6] showed that, in C. acidophila, an active xanthophyll cycle seems to operate, which would produce zeaxanthin in photoautotrophic cultures exposed to high-light conditions. In the xanthophyll cycle, zeaxanthin is produced from violaxanthin by the action of violaxanthin de-epoxidase enzyme activity [13, 14], which depends on the presence of reduced glutathione [15]. Glycine is required to synthesize glutathione, and could be expected to be useful as a tool for large-scale production of zeaxanthin.
On the other hand, urea, the other combined C–N source, was also tested to assess biomass and carotenoid productivity of C. acidophila. Urea has been successfully used as nitrogen source for Spirulina platensis cultivation, obtaining similar productivities to those obtained with nitrate as nitrogen source [16, 17]. Moreover, the search for cheaper nitrogen sources such as urea [18] or ammonium salts [19] is particularly attractive from the economic point of view.
The aim of the present work is to determine whether mixotrophic cultivation can be used for enhancement of carotenoid production in C. acidophila and for accumulation of different carotenoids depending on the organic carbon source added to the culture medium. This is the first published report regarding carotenoid accumulation of mixotrophically grown acidophilic green microalgae.
Materials and methods
Microorganism and culture conditions
Chlamydomonas acidophila, the algal material used in this study, was isolated from acidic water of the Tinto River, which runs through a mining area in Huelva (Spain). In this river, pH ranges between 1.7 and 3.1 through the year. An axenic culture of the alga was obtained by streaking it on basal agar medium at pH 2.5. Isolated colonies were transferred from the agar medium to liquid medium, both having the same composition. To prepare agar medium, 300 mL 7% agar and 700 mL modified K9 medium [20] were autoclaved separately and mixed before use. C. acidophila strain was maintained by periodic transfer of colonies into sterile modified K9 medium, adjusted to pH 2.5 using concentrated H2SO4. During microalgal cultivation in liquid medium, pH was monitored and adjusted to 2.5 using diluted NaOH or KOH.
Control cultures were bubbled with air containing 5% (v/v) CO2, whereas the other cultures were incubated in absence of carbon dioxide but in presence of different carbon sources (glucose, glycerol, starch, glycine, and urea). In those cases where CO2 was not supplied to the cultures, use of a 5 M KOH trap for removing CO2 from the air was required. All cultures were grown at 25°C in 1-L batch reactors, and continuously illuminated by fluorescent lamps (Philips TLD, 30 W, 200 μE m−2 s−1 at the surface of the flasks). Irradiance was measured using a Delta OHM photoradiometer (model HD9021).
Specific growth rate calculations
Dry weight measurements
To measure dry weight, 5 mL was taken from each culture, and the liquid medium was removed by means of a vacuum pump using a cellulose acetate filter (weighed before use) with 0.45 μm pore size (Sartorius, Goettingen, Germany), to separate the cells from the medium. The cells were then washed with demineralized water before drying the filters. The filters with the cells were dried at 70°C and weighed after 24 h.
Oxygen evolution
Photosynthetic activity was the biological activity used to test cell viability. For photosynthetic activity determinations, 1 mL microalga suspension was placed into a Clark-type electrode (Hansatech, UK) to measure O2 evolution. Chlorophyll concentrations for these determinations were below 15 μg mL−1 so that self-shading was minimized. Measurements were made at 25°C under saturating but nonphotoinhibitory, white light (600 μE m−2 s−1) emitted by Philips lamps, or in darkness (endogenous respiration).
Analytical determinations
Aliquots (1 mL) of the cultures were spun down for 10 min at 5,000 rpm. The supernatant was discarded, and the obtained pellet was placed in boiling water for 1 min. Afterwards, the pellet was resuspended in a suitable volume of absolute methanol to extract pigments completely. The suspension was shaken vigorously for 1 min and then centrifuged for 10 min at 5,000 rpm. Chlorophyll and total carotenoids concentration were determined spectrophotometrically in the supernatant, by means of the equations proposed in [21] and by high-performance liquid chromatography (HPLC) analysis (see below). Protein content was determined following the Bradford method [22]. The optical density of the cultures was determined at 680 nm by using an Ultrospec 3100 pro UV–Vis spectrophotometer (Biochrom Ltd.).
HPLC analysis of carotenoids
Separation and chromatographic analysis of pigments was performed using a Merck Hitachi HPLC equipped with a UV–Vis detector as described in [23], using an RP-18 column and flow rate of 1 mL min−1. The mobile phase consisted of ethyl acetate (solvent A) and acetonitrile/water (9:1 v/v) (solvent B), and the gradient program applied was: 0–16 min, 0–60% A and 100–40% B; 16–30 min, 60% A and 40% B; 30–35 min, 100% A. Detection of pigments was carried out at 450 nm, and their identification and quantification was achieved by previously running in the HPLC known amounts of pigment standards (calibration curves). The standards were supplied by DHI-Water and Environment (Denmark), including chlorophyll a, chlorophyll b, violaxanthin, zeaxanthin, lutein, and β-carotene of high-purity grade (>99%). From the corresponding calibration curves of the pigment standards, the following factors were obtained and used to calculate carotenoid concentrations in the samples (μg mL−1): chlorophyll a, 5.13 × 10⁻⁶; chlorophyll b, 5.88 × 10⁻⁷; violaxanthin, 3.69 × 10⁻⁷; zeaxanthin, 2.84 × 10⁻⁷; lutein, 3.63 × 10⁻⁷; and β-carotene, 3.09 × 10⁻⁷.
Cell counting
Cell number was determined using an Olympus CX41 microscope, in a Neubauer chamber.
Statistics
Unless otherwise indicated, tables and figures show means and standard deviations of three independent experiments.
Results and discussion
Growth kinetics with different carbon sources
In this part of the work, the efficiency of different energy sources (carbon sources) for growth of C. acidophila was investigated. Use of glucose and starch for mixotrophic growth of microalgae is quite extended [24–27]. Regarding other carbon sources, glycerol and acetate can in addition play the role of natural precursors for terpenoid biosynthesis [25, 28, 29]. Based on this, growth on either glycerol or acetate (heterotrophic growth) could in theory enhance carotenoid accumulation in Chlamydomonas acidophila. However, for massive carotenoid production, heterotrophic growth should be less suitable than photoautotrophic growth, as carotenoids are accessory photosynthetic pigments for which massive synthesis light is usually required [30]. As a consequence, in our experiments, algal growth (even on acetate, photoheterotrophic conditions) was always done by illuminating the cultures, so that the microalga synthesizes carotenoids while growing [25, 31]. Glycine and urea were tested as combined forms of carbon and nitrogen supply. Use of urea as a combined source of nitrogen and carbon has been shown to enhance Spirulina platensis growth [32]. A possible role for urea in carotenoid biosynthesis is also discussed therein.

Time-course biomass evolution of C. acidophila cultures grown on different carbon sources. Several aliquots of C. acidophila cultures were prepared from a standard culture and each was supplemented with one of the following assayed carbon sources: glucose, starch, glycine, urea, glycerol, acetate or CO2 (bubbled in air, 5% v/v), the latter being included in each graph as reference culture
Lag phase initiated 1–2 days after the experiment started, for all of the cultures and whatever carbon source was used. Lag phase duration seemed not to depend on either the type of carbon source or its concentration in the culture medium, although in those cultures grown on urea, lag phase seemed shorter. When compared with growth rates obtained from batch experiments with common microalgae [33], C. acidophila growth rate was found to be slightly slower. Cultures were allowed to grow for sufficient time to allow accurate calculation of growth rates.
As shown in Fig. 1, the end of the exponential growth phase was reached within 150–250 h, whatever the carbon source used. No additional amounts of organic carbon sources were added during growth, as all cultures were run in batch mode. The lowest concentration of each organic nutrient added to the culture media was 5 mM, except for starch (0.5 g L−1). Based on previous experiments (results not shown), this starch concentration added to the cultures was sufficient to allow the cultures to complete growth fully. This is in good agreement with results of other authors [34, 35], who reported 3–5 mM glucose to be carbon saturation conditions for microalgal growth in batch cultures. Starch was the only exception to this empirical rule, since concentrations higher than 2 g L−1 rapidly inhibited microalgal growth. This is in good agreement with [25] for mixotrophic growth of the microalga Phaeodactylum tricornutum. Starch, a common chemical form of carbon reservoir in nature and a suitable raw material for growth of microorganisms, could be used to sustain at least 100 h of growth of C. acidophila at a similar growth rate to that obtained with CO2 as sole carbon source. Addition of more starch could sustain microalgal growth for longer (results not shown). Therefore, starch could also be a suitable carbon source for growing C. acidophila.
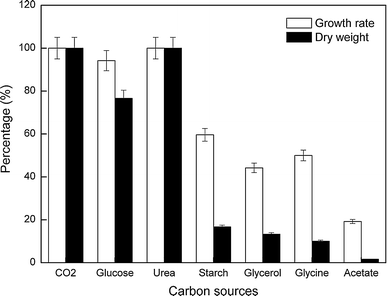
Specific growth rates and maximum dry weight of C. acidophila for the best nutrient concentration of each organic carbon source. Calculated growth rates are expressed as a percentage of the maximum growth rate obtained for those cultures grown on CO2 (100% = 0.5 day−1). Maximum dry weight values are expressed as a percentage of the maximum dry weight obtained for those cultures grown on CO2 (100% = 6 g L−1)
The best results, i.e., highest growth rate and maximum dry weight (~0.5 day−1 and ~6.0 g L−1, respectively), were obtained by cultivating C. acidophila with CO2 (5% v/v in air) or 0.01 M urea as sole carbon source (Fig. 2). Indeed, the time-course growth evolution obtained on 10 mM urea was actually the same as that of control cultures grown with 5% CO2 in air (v/v), although in this case the lag phase almost did not take place. Glucose was the only organic carbon source with which reached biomass concentrations were similar to those obtained by using CO2 or urea as carbon source (Fig. 2). However, C. acidophila growth on glucose only took place as long as glucose concentration remained below 0.01 M. Higher glucose concentrations easily induced bacterial growth in the culture medium with subsequent growth inhibition of C. acidophila.
Chlamydomonas acidophila was also able to grow in the presence of other organic carbon sources including starch, glycerol, and glycine, the latter being a combined source of carbon and nitrogen. As observed in Fig. 2, the amount of biomass produced with glucose and urea was significantly higher than that obtained with any of the other organic carbon sources, by at least a factor of about 4. Among the less productive organic carbon sources (starch, glycerol, and glycine), starch led to the fastest growth (Fig. 2), though the final biomass concentration was similar to that obtained in cultures grown on glycerol or glycine.
Growth of C. acidophila on 5 mM either glycerol or glycine developed much slower (by a factor of 2, Fig. 1) than growth on 5 mM glucose. Growth on higher concentrations of either glycerol or glycine led to even slower growth due to bacterial growth that competed for the carbon source, as reflected in the growth kinetics (Fig. 1). Acetate was also tested as carbon source, but no growth was observed.
Glucose and urea were found to be the carbon sources that enabled C. acidophila to grow as fast as on CO2 (control cultures). Growth rate of C. acidophila on starch was 60% of that obtained with CO2, whereas in the presence of either glycerol, glycine or acetate the growth rate was less than 50% of that obtained with CO2. Dry weight results collected from each best nutrient concentration culture are also shown in Fig. 2.
Biomass productivity for each culture was calculated, and the results are shown in Table 1. Productivity clearly differs depending on the carbon source on which growth was based, and acetate was the only organic carbon source on which no net growth was detected, therefore having negligible productivity. Cultures grown on glucose, urea, starch, glycerol, and glycine developed along the same growth time, but final dry weight (Fig. 2), biomass productivity, and maximum number of cells (Table 1) decreased when a carbon source other than urea or glucose was used, as evidence for the minor affinity of C. acidophila for those substrates.
Maximum cell number, average photosynthetic activity per unit of chlorophyll, and biomass productivity for the best concentration of each carbon source assayed
| Carbon source | CO2 | Glucose | Starch | Glycerol | Glycine | Acetate | Urea |
|---|---|---|---|---|---|---|---|
| Best nutrient concentration | 5% (v/v) in air | 0.005 M | 2 g L−1 | 0.005 M | 0.01 M | 0.05 M | 0.01 M |
| Maximum cell number (n × 108) | 5.4 ± 0.3 | 4.2 ± 0.2 | 0.9 ± 0.1 | 0.7 ± 0.1 | 0.50 ± 0.02 | 0.10 ± 0.01 | 4.9 ± 0.2 |
| Photosynthetic activity (μmol O2 h−1 mg−1 Chl) | 40 ± 2 | 35 ± 2 | 61 ± 3 | 33 ± 2 | 34 ± 2 | 5.0 ± 0.3 | 26 ± 1 |
| Biomass productivity (g m−2 day−1) | 20 ± 1 | 13.9 ± 0.7 | 3.3 ± 0.2 | 2.7 ± 0.1 | 2.1 ± 0.1 | 1.0 ± 0.1 | 20 ± 1 |
The biological state of the cultures growing on the different carbon sources was also assessed and followed through photosynthetic activity. Results of average O2 production rates when the cultures were in mid exponential growth phase are shown in Table 1. Cultures grown on acetate did not yield any measurable photosynthetic activity, in good agreement with the growth results. The rest of the cultures, grown on the best concentration of each nutrient, showed oxygen production rates within the range of expected values for viable cultures (control cultures grown on CO2).
From our results, urea seems to be a suitable and economic alternative to other conventional carbon (mainly CO2) and nitrogen sources (usually nitrate). Urea maintains Chlamydomonas acidophila growth at even higher levels than those obtained with carbon dioxide (5% v/v in air). Therefore, only urea, and to some minor extent glucose, could enable C. acidophila growth at values obtained with CO2 as carbon source. In addition, C. acidophila showed low capacity to make use of glycerol, glycine, and particularly, acetate. The low pH of the culture medium (2.5) modifies the chemical form of glycine and acetate, which become totally protoned. Therefore, both molecules have less polar character, which might make substrate uptake through cell membrane more difficult.
Pigment production
Total carotenoids
In this work we also investigated accumulation of carotenoids by C. acidophila during growth based on different carbon sources. The best concentration of each organic carbon source (glucose, urea, starch, glycerol, glycine, and acetate), as obtained from previous growth experiments, was used to grow C. acidophila and investigate both quantity and type of the accumulated carotenoids. During growth, samples were taken at different times for pigment analysis by HPLC.
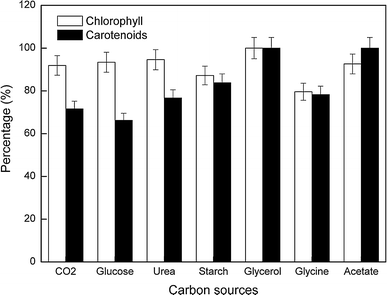
Maximum chlorophyll and carotenoid content of C. acidophila culture grown on each organic carbon source. Each value represents the percentage with respect to the maximum content found in cultures grown on glycerol (100% = 33.6 and 7.4 mg g−1 dry weight for chlorophyll and carotenoids, respectively)
In contrast, the highest carotenoid content was found in cultures grown on glycerol and acetate (100%), which also showed the highest carotenoid-to-chlorophyll ratio and led to the lowest growth. These results are in good agreement with those published in [25] for Phaeodactylum tricornutum that showed maximum pigment production for cultures grown on glycerol or glycine, and the opposite effect for cultures grown on glucose or urea. Regarding use of acetate, cultures grown on acetate oddly showed no growth, meaning that this carbon source was hardly consumed and catabolized. Coherently, the high content of carotenoids per biomass unit in cultures grown on acetate could partly be due to the stress produced by nutrient limitation. In that situation cell metabolism partly diverts carbon flows to biosynthesis of lipids including carotenoids, as described by other authors for several microalgal strains [36, 37]. In particular, lack of carbon has been reported to increase phycocyanin content in the acidophile red microalga Galdieria [27], one of the few examples of mixotrophic growth reported for acidophile microalgae. Obviously, such production of carotenoids per biomass unit in cultures grown on acetate cannot be sustained over time, as there is almost no carbon source (acetate) uptake and therefore the culture becomes nonviable.
The high content of carotenoids per biomass unit in viable C. acidophila cultures grown on glycerol is a consequence of enhanced carotenoid biosynthesis produced by this organic carbon source. In terms of total volume productivity of chlorophyll and carotenoids (mg carotenoids per mL), the best results were found in those cultures grown on glucose, urea, and CO2, as expected. Because of the higher biomass concentration in these cultures, the total amount of chlorophyll and carotenoids (per culture volume unit) was found to be about five- to sixfold the amount in cultures grown on glycerol (Table 2). Therefore, it seems to be clear that carotenoid cell enrichment based on glycerol should always be a second step in the carotenoid production process, just after biomass production on either CO2, urea or glucose.
Maximum chlorophyll content and maximum carotenoids content on culture volume for the best concentration of each carbon source assayed
| Carbon source | CO2 | Glucose | Starch | Glycerol | Glycine | Acetate | Urea |
|---|---|---|---|---|---|---|---|
| Best nutrient concentration | 5% (v/v) in air | 0.005 M | 2 g L−1 | 0.005 M | 0.01 M | 0.05 M | 0.01 M |
| Chlorophyll (mg L−1) | 185.9 ± 9.3 | 144.5 ± 7.2 | 29.3 ± 1.5 | 26.9 ± 1.3 | 15.6 ± 0.8 | 4.8 ± 0.2 | 160.2 ± 8.0 |
| Carotenoids (mg L−1) | 31.6 ± 1.6 | 22.5 ± 1.1 | 6.2 ± 0.3 | 5.9 ± 0.3 | 3.5 ± 0.2 | 1.1 ± 0.1 | 28.6 ± 1.4 |
| Total pigments (mg L−1) | 217.5 ± 10.9 | 167.0 ± 8.3 | 35.5 ± 1.8 | 32.8 ± 1.6 | 19.1 ± 1.0 | 5.9 ± ± 0.3 | 188.8 ± 9.4 |
Specific carotenoids
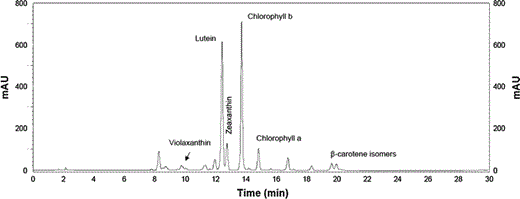
Typical chromatogram from photoautotrophically grown C. acidophila extracts. Peaks for major carotenoids are indicated
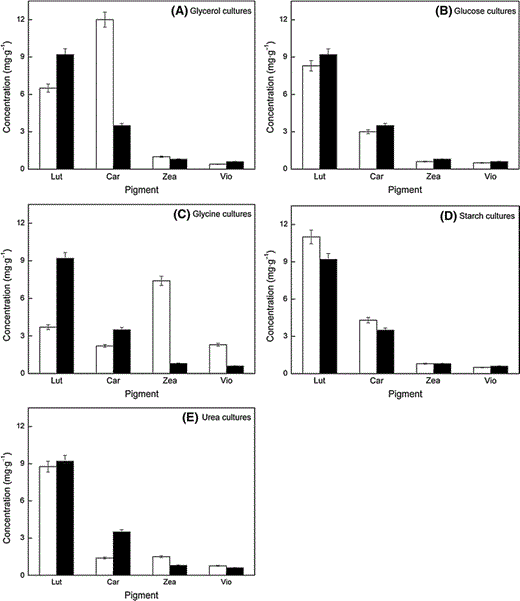
Maximum content of each of the main carotenoids accumulated by C. acidophila grown in culture media with the different carbon sources. Carotenoid contents are given as mg per g of dry biomass. Black bars in each graph represent control cultures. Lut, lutein; car, β-carotene; zea, zeaxanthin; vio, violaxanthin
In contrast and surprisingly, β-carotene was the most abundant carotenoid in cultures grown on glycerol (12 mg g−1, twice the lutein content), and zeaxanthin was the major carotenoid in cultures grown on glycine (7.5 mg g−1, twice the lutein content). When C. acidophila was incubated with glycine as carbon source, both zeaxanthin and violaxanthin content increased surprisingly to about the level of lutein and β-carotene of C. acidophila grown on CO2, whereas lutein and β-carotene content decreased to 3.7 and 2.2 mg g−1. As shown in Table 3, the ratio of lutein + β-carotene to zeaxanthin + violaxanthin (xanthophyll cycle pigments) ranges from 9 to 13 in C. acidophila cultures grown with CO2, glucose, starch or glycerol, whereas it is 0.6 and 4.5 (much lower) in cultures grown on glycine and urea (combined sources of N and C), respectively.
Maximum pigment content (mg g−1 of dry weight), main carotenoids content (relative abundance in dry biomass), and ratio of lutein + β-carotene to xanthophylls cycle pigments (zeaxanthin + violaxanthin), for the best concentration of each carbon source assayed
| Carbon source | Lut (%) | β-car (%) | Zea (%) | Vio (%) | (Lut + β-car)/(Zea + Vio) | Maximum pigment content |
|---|---|---|---|---|---|---|
| CO2 | 65.2 | 24.8 | 5.7 | 4.3 | 9.1 | 14.1 ± 0.7 |
| Glucose | 66.9 | 24.2 | 4.8 | 4.1 | 10.3 | 13.0 ± 0.6 |
| Starch | 66.3 | 25.9 | 4.8 | 3 | 11.8 | 16.6 ± 0.8 |
| Glycerol | 32.7 | 60.3 | 5 | 2 | 13.2 | 19.9 ± 0.9 |
| Glycine | 23.7 | 14.1 | 47.4 | 14.8 | 0.6 | 15.6 ± 0.8 |
| Urea | 70.6 | 11.2 | 12.1 | 6.1 | 4.5 | 12.4 ± 0.6 |
The results obtained from cultures grown on glycine seem to provide evidence that zeaxanthin accumulates inversely to lutein. As explained, among all the xanthophylls, zeaxanthin is the only one that accumulates exclusively under excess light [38]. Furthermore, lutein, the most abundant xanthophyll in the thylakoid membrane, has been shown to be not essential for light-harvesting and photoprotection functions when zeaxanthin is present [39]. However, C. acidophila accumulates large concentrations of lutein that remain constant under high-light conditions [6]. The oxidative conditions of the natural habitat of C. acidophila, i.e., metal ions and high light, might be behind these adaptation mechanisms. Moreover, the accumulated lutein concentrations of C. acidophila reported in this work (about 10 g kg−1 dry weight) are among the largest ever produced with microalgae [40]. This is just an example reinforcing the idea (widely supported by many algal biotechnologists) that nature is a huge larder to search for microalgae with certain biological activities, if that search takes places in a suitable ecological niche which meets specific environmental conditions that induce the desirable metabolic response of the microalga, e.g., lipid synthesis and carotenoid accumulation [5, 41].
The high zeaxanthin and violaxanthin content obtained in cultures grown on glycine deserves special attention. The obtained results would be in good agreement with increased de-epoxidase activity of the xanthophyll biosynthetic pathway in Chlamydomonas acidophila under high light (via lycopene, [39]), which forms zeaxanthin from violaxanthin de-epoxidation. However, it is under relatively low-light conditions (200 μE m−2 s−1) that zeaxanthin accumulates, whereas lutein decreases in the presence of glycine instead of CO2 as carbon source. This is an unexpected result, as zeaxanthin was expected to accumulate only in cells exposed to oxidative conditions (e.g., high light intensity).
Therefore, zeaxanthin accumulation does not occur for light-harvesting functions. Consequently, the zeaxanthin accumulation in cultures grown on glycine could anyhow be explained in terms of how metabolic carbon fluxes are directed depending on the carbon source added. In this sense, glycine supplies carbon for glutathione biosynthesis. The reduced form of glutathione is required for the action of violaxanthin de-epoxidase activity [42]. Therefore, and firstly, glycine should indeed be used as a precursor for reduced ascorbate formation, which is further required for zeaxanthin biosynthesis. This could partly explain the higher content of that xanthophyll pigment per biomass unit (Fig. 5). Secondly, and inferred from results in Figs. 1 and 2, C. acidophila growth on glycine becomes slower. Under such conditions, higher zeaxanthin accumulation occurs and seems to be consistent with the cell’s need for additional antioxidant activity to diminish oxidative stress produced by the apparent carbon limitation for basic metabolic activities [27]. Thirdly, and more interestingly, according to the biosynthesis pathway for carotenoids in microalgae [43], zeaxanthin and violaxanthin are directly formed from lycopene via β-carotene; lycopene can also divert to lutein formation via α-carotene. Thus, zeaxanthin and violaxanthin biosynthesis from β-carotene would be enhanced in C. acidophila grown on glycine, whereas lutein synthesis from α-carotene would be significantly decreased. Growth on glycerol also seems to enhance this pathway via β-carotene (high β-carotene content, low lutein content, compared with photoautotrophic growth), but it does not finally progress towards formation of ketocarotenoids.
From our results, we conclude that use of different carbon sources to grow C. acidophila leads to different biomass productivities, with urea being as efficient as CO2 as sole carbon source. Mixotrophic growth on glucose is also efficient in terms of biomass production, but with slightly less growth than on urea. Use of different organic carbon sources also results in different quantitative and qualitative profiles of accumulated carotenoids. Particularly, mixotrophic growth on urea can yield even higher productivities of carotenoids (mainly lutein, probably via α-carotene) than those obtained from photoautotrophic growth. The accumulated lutein concentrations of C. acidophila reported in this work (about 10 g kg−1 dry weight) are among the highest ever produced and reported for a microalga. Glycerol and glycine seem to enhance the β-carotene biosynthesis pathway. If glycine is used as carbon source, this pathway evolves to yield high zeaxanthin content. These results also suggest that two pathways (via α-carotene and β-carotene) might be operating for carotenoid biosynthesis in acidophile green microalgae. Finally, the results suggest strategies for production of lutein by continuous cultivation of C. acidophila on urea or CO2, and for production of zeaxanthin by two-step semicontinuous processes with C. acidophila, in a first step by growing cultures photoautotrophically, or mixotrophically with urea, for biomass production and, as a second step, by adding only glycine as carbon source for zeaxanthin accumulation.
Acknowledgments
This work has been supported by Ministerio de Educación y Ciencia of Spain (Proyecto AGL2006-12741), Junta de Andalucía (Proyectos de Excelencia, AGR-4337), and Instituto Andaluz de Biotecnología (Programa BIOÁNDALUS).
