


Abstract
Challenges remain in discerning microbiologic etiology and disease severity in childhood pneumonia. Defining host transcriptomic profiles during illness may facilitate improved diagnostic and prognostic approaches.
Using whole blood RNA sequencing from 222 hospitalized children with radiographic pneumonia and 45 age-matched controls, we identified differentially expressed (DE) genes that best identified children according to detected microbial pathogens (viral only vs bacterial only and typical vs atypical bacterial [with or without [±] viral co-detection]) and an ordinal measure of phenotypic severity (moderate, severe, very severe).
Overall, 135 (61%) children had viral-only detections, 15 (7%) had typical bacterial detections (± viral co-detections), and 26 (12%) had atypical bacterial detections (± viral co-detections). Eleven DE genes distinguished between viral-only and bacterial-only detections. Sixteen DE genes distinguished between atypical and typical bacterial detections (± viral co-detections). Nineteen DE genes distinguished between levels of pneumonia severity, including 4 genes also identified in the viral-only versus bacterial-only model (IGHGP, PI3, CD177, RAP1GAP1) and 4 genes from the typical versus atypical bacterial model (PRSS23, IFI27, OLFM4, ABO).
We identified transcriptomic biomarkers associated with microbial detections and phenotypic severity in children hospitalized with pneumonia. These DE genes are promising candidates for validation and translation into diagnostic and prognostic tools.
Pneumonia is a heterogenous disease most often caused by viruses and bacteria. Using state-of-the-art diagnostics, the Etiology of Pneumonia in the Community (EPIC) Study evaluated microbial etiology among >2000 children in the United States (US) hospitalized with radiographic pneumonia, identifying viruses in >70% and bacteria in <20% of participants [1]. Despite the commonality of viral etiologies, most children hospitalized with pneumonia are treated with antibiotics due to limitations of culture-based diagnostics and potential harms associated with missed bacterial disease [2–4]. For similar reasons, empiric antibiotic choices are often broad-spectrum and incongruent with national guideline recommendations [5].
Pneumonia is also one of the most common reasons for hospitalization in US children [6]. In this setting, phenotypic severity varies widely, from moderate disease requiring a short period of observation with few or no complications to very severe disease leading to respiratory failure, shock, and prolonged recovery or death. At the population level, severe or very severe disease is most often associated with bacterial etiologies, though clinical characteristics are usually insufficient to distinguish between microbial causes in individual patients, likely influenced by host genetic diversity and associated responses to disease [7–14].
Evaluating the host responses to disease can complement imperfect microbial diagnostics to inform determinations of etiology, pathogenesis, and prognosis. Herein, we assessed whole blood RNA sequencing (RNA-Seq) among approximately 200 EPIC-enrolled children and a cohort of healthy, age-matched controls to identify transcriptomic biosignatures associated with viral and bacterial causes of pneumonia and phenotypic severity.
MATERIALS AND METHODS
EPIC Pneumonia Cohort
The Centers for Disease Control and Prevention–funded EPIC study was conducted from January 2010 through June 2012 at 3 US children's hospitals, in Memphis, Tennessee; Nashville, Tennessee; and Salt Lake City, Utah [1]. The study enrolled children of all ages with evidence of acute lower respiratory tract infection (ie, abnormal temperature or peripheral white blood cell [WBC] count plus new cough, chest pain, dyspnea, tachypnea, abnormal lung examination, or respiratory failure) plus radiographic evidence of pneumonia as determined by study pediatric radiologists. Children with cystic fibrosis, severe immunosuppression, or a tracheostomy, those recently hospitalized, and those with a clear alternative diagnosis (eg, heart failure) were excluded. For the current analysis (hereafter the EPIC RNA-Seq cohort), we included a cross-sectional sample of EPIC children who were enrolled in Memphis and Nashville between January and June 2012, had diagnostic testing performed for both viral and bacterial pathogens, and had a blood sample collected in RNA stabilization tubes (Tempus tubes, Applied Biosystems) and immediately frozen at −80°C.
Microbial etiology testing for EPIC participants included routine collection and analysis of nasopharyngeal/oropharyngeal samples (polymerase chain reaction [PCR] for 7 respiratory viruses, Mycoplasma pneumoniae, and Chlamydia pneumoniae) and blood samples (blood cultures, PCR for Streptococcus pneumoniae, acute and convalescent serology) at the time of enrollment, along with additional clinical samples (eg, pleural fluid, high-quality endotracheal aspirates [≤10 epithelial cells and ≥25 WBCs per low-power field], and bronchoalveolar lavage) whenever available. Final etiologic classifications assigned in the parent study included viral only (respiratory syncytial virus [RSV], human rhinovirus, human metapneumovirus, adenovirus, parainfluenza virus, influenza, and coronavirus); typical bacterial only (S pneumoniae, Staphylococcus aureus, Streptococcus pyogenes, Haemophilus influenzae); atypical bacterial only (M pneumoniae); and viral–bacterial (any co-detection of virus and bacterial pathogen).
For the current analysis, we first focused on distinguishing between viral and bacterial (typical and atypical) etiologies, excluding viral–bacterial co-detections to approximate signatures suggestive of bacterial pathogenesis and correlative with antibiotic use (yes/no). We next sought to differentiate between typical versus atypical bacterial pathogens, retaining viral–bacterial co-detections to identify signatures that might inform antibiotic selection (eg, β-lactam vs macrolide antibiotics), regardless of the presence or absence of viral co-detections. Finally, we examined signatures associated with an ordinal severity measure based on the most severe outcome experienced during the index hospitalization and classified as moderate (hospitalization without severe or very severe features), severe (intensive care without very severe features), or very severe (invasive mechanical ventilation or shock requiring vasoactive medications) [8].
Healthy, Asymptomatic Control Cohort
To define reference controls for transcriptomic analyses, a prospective cohort of asymptomatic, healthy children, age- and sex-matched to the EPIC RNA-Seq cohort, were enrolled. Children 2 months to <18 years of age undergoing outpatient surgery or procedure under anesthesia were recruited from the Vanderbilt University Medical Center Pediatric Ambulatory Surgery Center between October 2017 and March 2018. Mirroring the EPIC cohort exclusionary criteria, children with known immunologic disorders or cancer, those receiving immunosuppressive medications, and residents of long-term care facilities were excluded. We also excluded those undergoing otolaryngology procedures, those with signs or symptoms of acute illness or recent hospitalization, and those receiving immunizations, systemic corticosteroids, or antibiotics within the preceding 30 days. Following informed consent, a blood sample was collected in RNA stabilization tubes at the time of intravenous line insertion and induction of anesthesia (just prior to the planned procedure). Samples were immediately frozen at −80°C [15, 16]. Caregivers were interviewed at enrollment to collect demographic data and medical history and contacted by telephone 7–14 days later to assess for new signs or symptoms of intercurrent illness. Enrolled participants who were lost to follow-up or developed symptoms within 7 days of enrollment were withdrawn and replaced. Microbial diagnostics were not performed. An enrollment target of 48 control participants was chosen based on sample size estimation needed to identify 80% of differentially expressed (DE) genes between the 2 study groups.
RNA Sequencing
RNA-Seq analysis was performed at the Emory Vaccine and Therapeutics Evaluation Unit’s Systems Biology Core Facility in the Yerkes Genomics Core Laboratory. Total RNA was purified from Tempus Blood RNA Tubes using the Tempus RNA isolation kit (Life Technologies). RNA quality and quantity were assessed using RNA NanoDrop quantification and Agilent Bioanalyzer capillary electrophoresis. Samples with RNA integrity scores <8 were discarded and a replicate aliquot was purified. Globin transcripts were depleted from total RNA using the GlobinClear kit from Life Technologies. To prepare sequencing libraries from globin-depleted RNA, Illumina TruSeq mRNA-stranded kits were used with 250 ng of globin-depleted total RNA as input. External RNA Controls Consortium controls were spiked in each sample to monitor dynamic range of the assay. The quality of the libraries was verified using DNA-1000 Kits (Agilent Bioanalyzer) and quantified using the Qubit 2.0 Fluorometer (Life Technologies). Libraries were clustered and sequenced on an Illumina HiSeq 3000. Sequencing was performed at 100 bp single-end. Eleven samples were multiplexed per Illumina sequencing lane. The target coverage was >25–30 million mapping reads per sample with >91% reads having Q-scores of ≥30. These RNA-Seq workflows were compliant with ENCODE consortium standards (version 2.0, June 2011).
Transcriptomic Data Processing
The latest version of the human reference genome assembly, gene models, and associated gene annotation information were obtained from the ENSEMBL database (version 99). The genomic reference was built by merging all human chromosomes except for X and Y chromosomes to avoid sex-specific effects. Adapter sequences and low-quality 5′ ending sequences were removed from raw sequencing reads using Trimmomatic software (version 0.38) [17]. Quality-filtered reads were then aligned to the reference transcriptome/genome using the latest version of HISAT2 splice-aware sequence aligner (version 2.1.0) [18]. Gene expression quantification was carried out on the gene level using the featureCounts function of Subread software (version 1.6.4) [19]. Trimmed mean of M-values (TMM) normalization was executed as implemented in edgeR (version 3.26.4) [20]. Genes with average expression levels below 2 counts per million (CPM) were considered lowly expressed and were excluded from downstream analyses.
Statistical Analysis
Negative binomial models, as implemented in edgeR, were used to identify significant DE genes in children hospitalized with clinical and radiographic pneumonia as compared to healthy children. For this, separate models were fit for each of the following pneumonia subgroups: (1) typical bacteria (with or without [±] viral co-detections); (2) atypical bacteria (± viral co-detections); (3) viral only; and (4) no identified pathogens. Each model included a fixed effect with 2 factors: age (in months) and sex (2 fixed levels). For each gene and model, statistical significance of the difference in mean gene expression between the respective case subgroup compared to the healthy control group adjusted for age and sex was evaluated using a likelihood ratio test. Genes with an absolute value fold-change ≥1.5 between cases and controls and false discovery rate [FDR]–adjusted P < .05 (p.adjust R method) were considered DE genes [21]. Pathway enrichment analysis to identify significantly enriched KEGG and MSigDB (version 7.1) pathways for each DE and predictive gene set was carried out using the goseq R package (version 1.36.0) [22], correcting for gene length bias and multiple testing (FDR-adjusted P < .05).
Using the DE genes identified above as inputs, lasso-regularized logistic regression models were developed (glmnet R package version 2.0-16) [23] on the TMM-normalized log2 counts per million (LCPM) gene expression profiles to identify transcriptomic signatures that best predicted (1) viral-only versus bacterial-only (typical + atypical) pathogens, and (2) typical versus atypical bacterial pathogens (± viral co-detections). Three-fold repeated cross-validation was used to determine the optimum regularization parameter (λ); the cross-validation was repeated 10 times on different folds sampled using stratified sampling (by etiology), and the λ value that minimized the average out-of-sample model deviance across the repeats was chosen. Weighted least squares was used with each participant weighted by the inverse probability of the etiology group. This strategy accounts for the imbalance in sample size between the etiology groups and allowed for a fixed threshold at 50% predicted probability to be used across all models for classification [24].
To identify DE genes that best predicted the ordinal pneumonia severity measure (moderate, severe, very severe), a third lasso-regularized ordinal regression model was used as implemented in the ordinalNet R package (version 2.9) [25]. A weighted fit was used with each participant weighted by the inverse probability of the severity group. This allowed the fitted model to be used for classification based on the severity level with the highest predicted probability. Three-fold cross validation was used to determine the optimum regularization parameter (λ); the λ value that minimized the average out-of-sample misclassification rate was selected.
RESULTS
Study Population
For the EPIC RNA-Seq cohort, 222 of 229 participants with samples collected were included (mean age, 41 months; Table 1); 7 participants were excluded due to sample processing issues. Any comorbidity was noted in 92 (41%) children; 39% had a history of asthma, and other comorbidities were noted in 3% of participants. Viral-only detections comprised 135 (60.8%) children, typical bacteria (± viral co-detection) in 15 (6.8%), and atypical bacteria (± viral co-detection) in 26 (11.7%); 46 children (20.1%) had no pathogens detected. Distribution of the ordinal severity outcome included 172 children (77%) with moderate disease, 36 (16%) severe, and 14 (6%) very severe.
Characteristics of Study Population
| Characteristic | Pneumonia Cohort | Control Cohort | Overall | |||
|---|---|---|---|---|---|---|
| Virus Only | Typical Bacteriaa | Atypical Bacteriaa | No Detected Pathogen | |||
| (n = 135) | (n = 15) | (n = 26) | (n = 46) | (n = 45) | (n = 267) | |
| Age, mo, mean (SD) | 28 (62) | 20 (21) | 72 (93.2) | 70 (106.8) | 40 (56) | 41 (70.5) |
| Age group | ||||||
| <16 mo | 39 (29) | 6 (40) | 4 (15) | 7 (15) | 11 (24) | 67 (25) |
| 16 to <42 mo | 39 (29) | 6 (40) | 3 (12) | 7 (15) | 12 (27) | 67 (25) |
| 42 to <85 mo | 30 (22) | 2 (13) | 8 (31) | 13 (28) | 11 (24) | 64 (24) |
| 85–216 mo | 27 (20) | 1 (7) | 11 (42) | 19 (41) | 11 (24) | 69 (26) |
| Male sex | 76 (56) | 10 (67) | 14 (54) | 30 (65) | 28 (62) | 158 (59) |
| Hispanic/Latino ethnicity | 19 (14) | 1 (7) | 3 (12) | 5 (11) | 0 (0) | 28 (10) |
| Race | ||||||
| White | 56 (41) | 6 (40) | 19 (73) | 22 (48) | 31 (69) | 134 (50) |
| Black/African American | 73 (54) | 7 (47) | 6 (23) | 21 (46) | 11 (24) | 118 (44) |
| Multiracial | 3 (2) | 2 (13) | 1 (4) | 2 (4) | 3 (7) | 11 (4) |
| Other/unknown | 3 (2) | 0 (0) | 0 (0) | 1 (2) | 0 (0) | 4 (1) |
| Comorbidity | ||||||
| Asthma | 57 (42) | 2 (13) | 8 (31) | 20 (43) | 1 (2) | 88 (33) |
| Other | 2 (1) | 0 (0) | 0 (0) | 5 (11) | 0 (0) | 7 (3) |
| Microbial etiology | ||||||
| Viruses | ||||||
| Human rhinovirus | 61 (45) | 2 (13) | 4 (15) | … | … | 67 (25) |
| RSV | 30 (22) | 3 (20) | 1 (4) | … | … | 34 (13) |
| HMPV | 29 (21) | 1 (7) | 1 (4) | … | … | 31 (12) |
| Adenovirus | 22 (16) | 3 (20) | 0 (0) | … | … | 25 (9) |
| Influenza | 18 (13) | 1 (7) | 1 (4) | … | … | 20 (7) |
| Coronavirus | 10 (7) | 1 (7) | 2 (8) | … | … | 13 (5) |
| Parainfluenza virus | 7 (5) | 4 (27) | 0 (0) | … | … | 11 (4) |
| Typical bacteria | ||||||
| Streptococcus pneumoniae | … | 9 (60) | … | … | … | 9 (3) |
| Staphylococcus aureus | … | 4 (27) | … | … | … | 4 (1) |
| Otherb | … | 2 (13) | … | … | … | 2 (1) |
| Atypical bacteria | ||||||
| Mycoplasma pneumoniae | … | … | 25 (96) | … | … | 25 (9) |
| Chlamydia pneumoniae | … | … | 1 (4) | … | … | 1 (0) |
| Viral–viral or viral–bacterial co-detections | 35 (26) | 10 (67) | 8 (31) | … | … | … |
| Pneumonia severityc | ||||||
| Moderate | 102 (76) | 9 (60) | 23 (88) | 37 (80) | … | 171 (64) |
| Severe | 25 (19) | 2 (13) | 3 (12) | 7 (15) | … | 37 (14) |
| Very severe | 8 (6) | 4 (27) | 0 (0) | 2 (4) | … | 14 (5) |
Data are presented as frequency (%) unless otherwise stated.
Abbreviations: HMPV, human metapneumovirus; RSV, respiratory syncytial virus; SD, standard deviation.
aIncludes virus coinfection.
bTwo participants had other Streptococcus species.
cPneumonia disease severity was defined using an ordinal severity measure based on the most severe outcome experienced during the index hospitalization (see [9]), classified as moderate (hospitalization without severe or very severe features), severe (intensive care without very severe features), or very severe (invasive mechanical ventilation or shock requiring vasoactive medications).
The EPIC RNA-Seq cohort represented 10% of the 2222 children enrolled in the parent EPIC cohort with viral and bacterial testing performed. Characteristics of the parent EPIC cohort, including baseline characteristics (majority <5 years of age; 33% with asthma comorbidity), microbial detections (viruses in 74% and bacteria in 15%), and severity distributions (severe in 14% and very severe in 7%) [1, 8], were similar to the EPIC RNA-Seq cohort. For the asymptomatic control cohort, 45 of 61 enrolled participants were included (mean age, 40 months, Table 1); exclusions included 10 participants who developed respiratory symptoms within 1 week of enrollment and 6 with sample processing issues.
Analysis of DE Genes and Enriched Pathways
As compared to the healthy control cohort, 6049 DE genes were associated with pneumonia, including 3597 upregulated genes and 2452 downregulated genes (Figure 1). Approximately half of all DE genes (n = 3094) were shared across microbial etiologies. Turning next to transcriptomic patterns correlated with microbial etiology, we identified 178 DE genes associated with viral-only detections, 429 associated with typical bacterial detections (± viral co-detection), and 338 with atypical bacterial detections (± viral co-detection). A radar plot summarizing the top KEGG, reactome, and biological process gene ontology pathways associated with each microbial signature is shown in Figure 2.
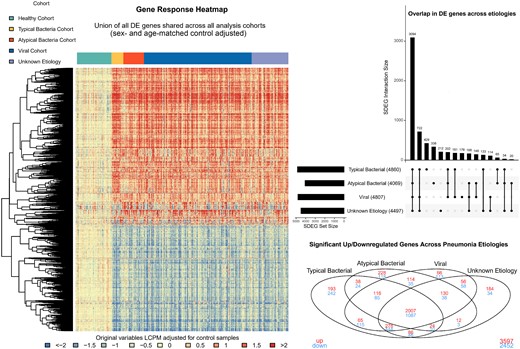
Summary of differentially expressed (DE) genes in children hospitalized with pneumonia vs healthy controls, overall and by pathogen group. The heatmap displays log2 counts per million comparing viral, typical bacterial, atypical bacterial, and unknown pneumonia etiologies to the healthy control cohort, adjusted for sex and age. Rows represent the union of all DE genes shared across the 4 pneumonia groups compared to healthy controls and columns represent individual observations, ordered by etiologic grouping. Blue to red gradient represents low to high z-score values. Dendrograms were obtained using complete linkage clustering of uncentered pairwise Pearson correlation distances between standardized log2-fold changes. The upset plot summarizes the overlap in DE genes between pathogen groups. The horizontal bar plot shows the total number of DE genes for each group and the adjacent filled circles represent unique and overlapping (connected circles) DE genes. The Venn diagram summarizes overlap in DE genes across known pathogen groups and unknown etiologies, with upregulated DE genes represented in red and downregulated DE genes in blue. Abbreviations: DE, differentially expressed; LCPM, log2 counts per million; SDEG, signficant differentially expressed gene.
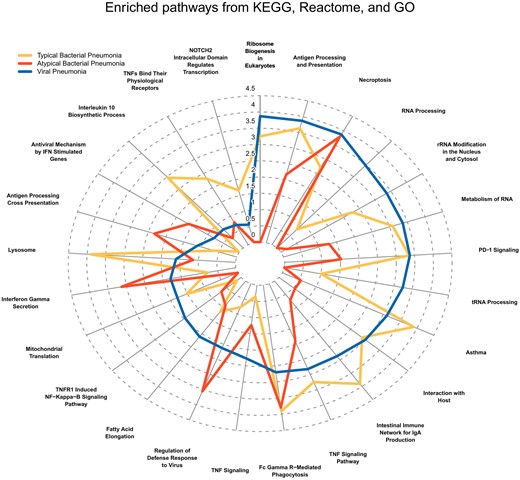
Radar plot displaying the top enriched KEGG, MSigDB Reactome, and MSigDB Gene Ontology (GO) Biological Process gene sets. The top pathways represent those with the greatest difference between etiologies in terms of enrichment score followed by Jaccard index. The distance from the center represents the enrichment score of the differentially expressed genes in the viral pneumonia cohort (blue line), typical bacterial cohort (yellow line), and atypical bacterial cohort (red line). Abbreviations: IFN, interferon; IgA, immunoglobulin A; PD-1, programmed cell death one; rRNA, ribosomal RNA; TNF, tumor necrosis factor; tRNA, transfer RNA.
DE Gene Profiles Predicting Viral Versus Bacterial and Typical Versus Atypical Bacterial Detections
We identified 11 DE genes that best differentiated between viral-only and bacterial-only etiologies: SCARF1, HLA-DRB5, IGLV3-10, CYP27A1, PI3, IGLV10-54, USP18, CD177, RAP1GAP, OTOF, and IGHGP; Figure 3A and 3B, Table 2). Figure 3A also includes boxplots for viral–bacterial co-detections. Though not formally analyzed, the DE genes noted above largely demonstrated “blended” effects in those with co-detections with some expression patterns more like viral signatures and others more similar to bacterial signatures. An additional 16 DE genes best distinguished between typical and atypical bacterial etiologies (± viral co-detections): CFAP58-DT, ENSG00000261804, HLA-DQB2, SH2D1B, IFIT1, HLA-L, RHD, PRSS23, IFI27, OLFM4, CHI3L1, MTND4P12, PLVAP, METTL7B, SIGLEC1, and ABO (Figure 4A and 4B, Table 2).
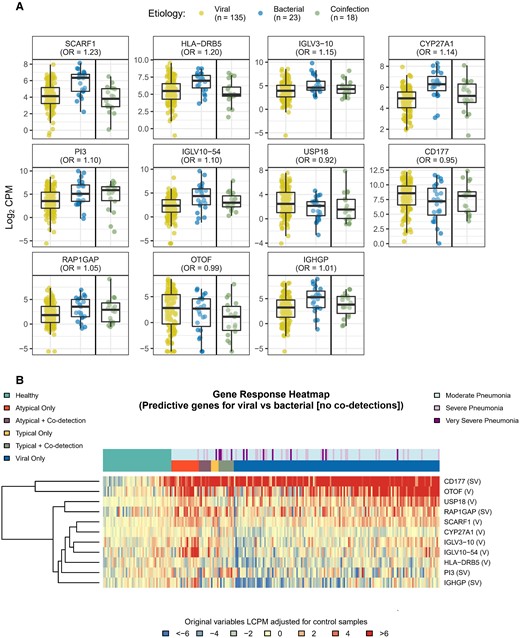
Boxplots (A) and heatmap (B) of differentially expressed (DE) genes predicting viral vs bacterial etiology. To identify gene expression signatures that best predicted viral vs bacterial (without co-detection) infection, a lasso-regularized logistic regression model was fit using the gene expression profiles of the DE genes identified in the typical bacteria, atypical bacterial, and viral-only pathogen cohorts. Box plots and heatmap represent gene expression, quantified as log2 counts per million. Odds ratios in (A) reflect the relative change in odds for viral-only vs bacterial-only etiology associated with a unit change in gene expression. Gene descriptions are listed in Table 2. Abbreviations: CPM, counts per million; LCPM, log2 counts per million; OR, odds ratio.
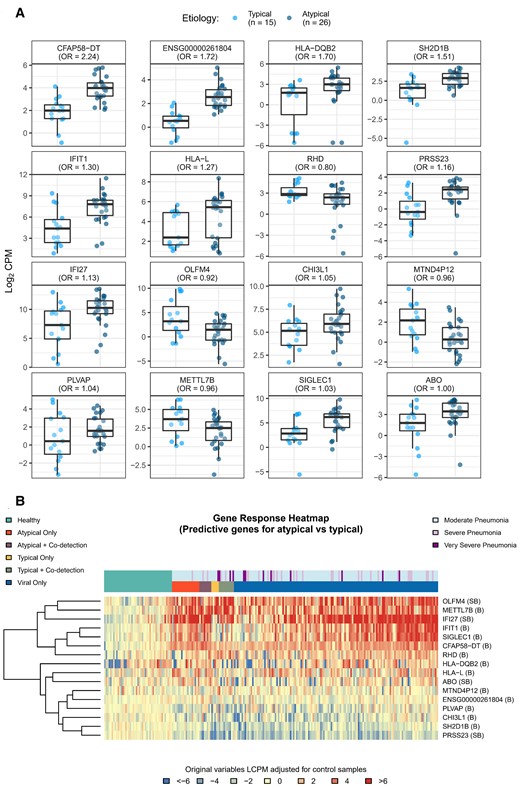
Boxplots (A) and heatmap (B) of differentially expressed (DE) genes predicting typical vs atypical bacterial etiology. To identify gene expression signatures that best predicted typical vs atypical bacterial infection, a lasso-regularized logistic regression model was fit using the gene expression profiles of the DE genes identified in the typical bacteria, atypical bacterial, and viral-only pathogen cohorts. Boxplots and heatmap represent gene expression, quantified as log2 counts per million. Odds ratios reflect the relative change in odds for typical vs atypical bacterial etiology associated with a unit change in gene expression. Gene descriptions are listed in Table 2. Abbreviations: CPM, counts per million; LCPM, log2 counts per million; OR, odds ratio.
Transcriptomic Predictors of Microbial Etiology and Disease Severity in Childhood Pneumonia
| Gene Name | Gene Description | Modela | ||
|---|---|---|---|---|
| Bacteria vs Virus | Atypical vs Typical Bacteria | Ordinal Disease Severity | ||
| Odds Ratio | ||||
| SCARF1 | scavenger receptor class F member 1 [HGNC:16820] | 1.23 | … | … |
| HLA-DRB5 | major histocompatibility complex, class II, DR beta 5 [HGNC:4953] | 1.2 | … | … |
| IGLV3-10 | immunoglobulin lambda variable 3-10 [HGNC:5897] | 1.15 | … | … |
| CYP27A1 | cytochrome P450 family 27 subfamily A member 1 [HGNC:2605] | 1.14 | … | … |
| PI3 | peptidase inhibitor 3 [HGNC:8947] | 1.1 | … | −.89 |
| IGLV10-54 | immunoglobulin lambda variable 10-54 [HGNC:5884] | 1.1 | … | … |
| RAP1GAP | RAP1 GTPase activating protein [HGNC:9858] | 1.05 | … | 1.02 |
| IGHGP | immunoglobulin heavy constant gamma P (non-functional) [HGNC:5529] | 1.01 | … | −.86 |
| OTOF | otoferlin [HGNC:8515] | −.99 | … | … |
| CD177 | CD177 molecule [HGNC:30072] | −.95 | … | 1.03 |
| USP18 | ubiquitin specific peptidase 18 [HGNC:12616] | −.92 | … | … |
| CFAP58-DT | CFAP58 divergent transcript [HGNC:45243] | … | 2.24 | … |
| ENSG00000261804 | novel transcript | … | 1.72 | … |
| HLA-DQB2 | major histocompatibility complex, class II, DQ beta 2 [HGNC:4945] | … | 1.7 | … |
| SH2D1B | SH2 domain containing 1B [HGNC:30416] | … | 1.51 | … |
| IFIT1 | interferon-induced protein with tetratricopeptide repeats 1 [HGNC:5407] | … | 1.3 | … |
| HLA-L | major histocompatibility complex, class I, L (pseudogene) [HGNC:4970] | … | 1.27 | … |
| PRSS23 | serine protease 23 [HGNC:14370] | … | 1.16 | −.74 |
| IFI27 | interferon alpha inducible protein 27 [HGNC:5397] | … | 1.13 | 1.07 |
| CHI3L1 | chitinase 3 like 1 [HGNC:1932] | … | 1.05 | … |
| PLVAP | plasmalemma vesicle–associated protein [HGNC:13635] | … | 1.04 | … |
| SIGLEC1 | sialic acid binding Ig-like lectin 1 [HGNC:11127] | … | 1.03 | … |
| ABO | ABO, alpha 1-3-N-acetylgalactosaminyltransferase and alpha 1-3-galactosyltransferase [HGNC:79] | … | 1 | −.99 |
| METTL7B | methyltransferase-like 7B [HGNC:28276] | … | −.96 | … |
| MTND4P12 | MT-ND4 pseudogene 12 [HGNC:42199] | … | −.96 | … |
| OLFM4 | olfactomedin 4 [HGNC:17190] | … | −.92 | 1.02 |
| RHD | Rh blood group D antigen [HGNC:10009] | … | −.8 | … |
| RN7SL1 | RNA component of signal recognition particle 7SL1 [HGNC:10038] | … | … | 1.38 |
| ENSG00000136315 | novel transcript | … | … | 1.15 |
| ENSG00000254420 | novel transcript | … | … | 1.13 |
| CHIT1 | chitinase 1 [HGNC:1936] | … | … | 1.1 |
| MPO | myeloperoxidase [HGNC:7218] | … | … | 1.07 |
| HP | haptoglobin [HGNC:5141] | … | … | 1.06 |
| PRTN3 | proteinase 3 [ HGNC:9495] | … | … | 1.05 |
| LINC02289 | long intergenic nonprotein coding RNA 2289 [HGNC:53205] | … | … | −.98 |
| TPPP3 | tubulin polymerization promoting protein family member 3 [HGNC:24162] | … | … | −.9 |
| EPHB1 | EPH receptor B1 [HGNC:3392] | … | … | −.87 |
| LILRA4 | leukocyte immunoglobulin-like receptor A4 [HGNC:15503] | … | … | −.82 |
aRegression coefficients, expressed as odds ratios, are shown for the 2 etiology logistic regression models and for the severity ordinal regression model (no pneumonia, moderate, severe, very severe). Bacterial–viral coinfections were excluded from the bacteria versus virus model. The rows highlighted in light gray represent the differentially expressed genes selected for both the severity model and 1 of the 2 etiology models.
DE Gene Profiles Predicting Pneumonia Disease Severity
Nineteen DE genes associated with pneumonia disease severity were selected using a lasso-regularized ordinal regression model: RN7SL1, PRSS23, LILRA4, IGHGP, ENSG00000136315, EPHB1, ENSG00000254420, PI3, TPPP3, CHIT1, IFI27, MPO, HP, PRTN3, CD177, LINC02289, RAP1GAP1, OLFM4, and ABO (Figure 5A and 5B, Table 2). Pathway analysis showed that the neutrophil degranulation and innate immune system reactome pathways were enriched in these 19 predictive genes. Many of these genes are also found in other processes related to innate and adaptive immune response pathways including type I interferons, interferon-induced proteins, neutrophil activation, neutrophil elastase inhibitors, immunoglobulin-like cell surface proteins, and immunoglobulin pseudo-gamma pathways.
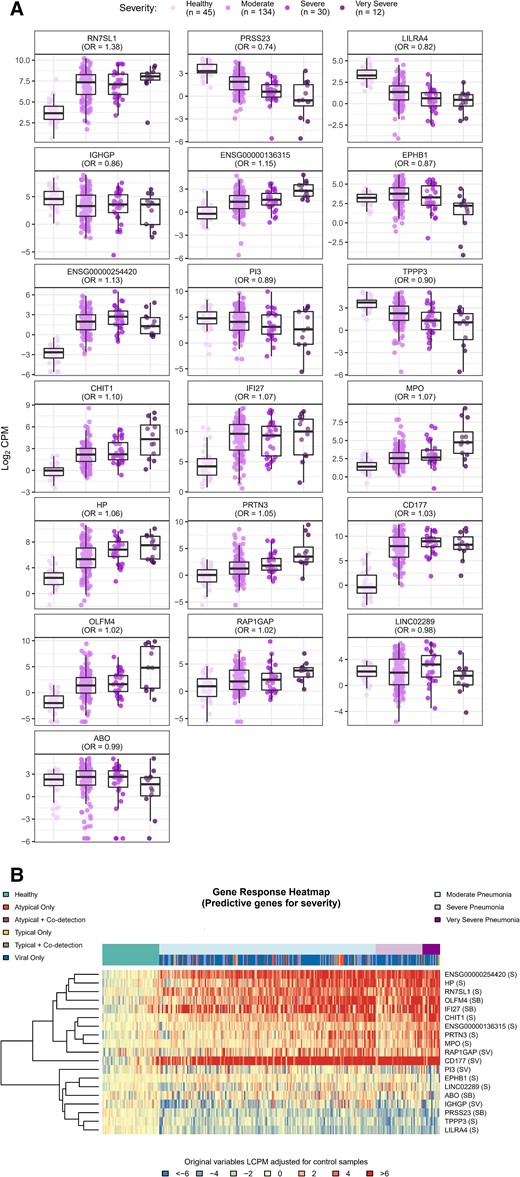
Boxplots (A) and heatmap (B) of differentially expressed genes predicting pneumonia severity. To identify gene expression signatures that best predicted illness severity defined on an ordinal severity scale (very severe, severe, moderate and healthy), a lasso-regularized ordinal regression model was used. Box plots and heatmap represent gene expression, quantified as log2 counts per million. Odds ratios reflect the relative change in odds for a more severe outcome associated with a unit change in gene expression. Gene descriptions are listed in Table 2. Abbreviations: B, gene represented in typical vs atypical bacterial model; CPM, counts per million; LCPM, log2 counts per million; OR, odds ratio; S, gene represented in severity model; V, gene represented in viral vs bacterial model.
DISCUSSION
We identified 6049 DE genes associated with acute pneumonia in children as compared to healthy control participants. More than half of the identified DE genes were shared across all children with pneumonia, suggesting common host response pathways. Approximately 1000 DE genes were attributed to clinically relevant microbial subgroups, including viruses, typical bacteria, and atypical bacteria. Among these, the 10–20 DE genes that best distinguished viral from bacterial detections and typical from atypical bacterial detections, and across varying levels of pneumonia disease severity, were identified. Importantly, most of the DE genes identified in this study are distinct from those identified in previous studies of patients with sepsis [26–28], suggesting that pneumonia-specific signatures could have both diagnostic and prognostic capabilities.
In a study by Tsalik et al, 273 children and adults with acute respiratory infection were evaluated with 71 classifier genes associated with clinician-adjudicated bacterial pneumonia [29]. Two genes from that study, IFIT1 and IFI27, were also identified in our cohort. Both are type 1 interferon-response genes [30], and both have been observed in other studies of acute respiratory illness [16, 31]. Type I interferons impair viral replication and recruit and activate immune cells in the lung [32]. The downregulation of IFIT1 and IFI27 among those with typical bacterial detections and upregulation in those with atypical bacterial detections also suggests that these atypical infections may evoke responses more consistent with viral signatures. The lack of more considerable overlap in identified DE genes may result from differences in the populations studied (eg, age, diagnoses, comorbidities), assays (microarray vs RNA-Seq), etiologic evaluations, or analytic approach and is deserving of further study. We also observed that children with viral–bacterial co-detections largely demonstrated a blending of DE gene expression patterns that sometimes more closely resembled patterns observed in those with viral-only etiologies and others more like bacterial-only etiologies. Further exploration of expression patterns in those with co-detections is warranted to investigate potential signatures unique to co-detections and to determine if viral and bacterial etiologies can be reliably differentiated when both are present.
We identified 19 genes associated with pneumonia severity, including 8 genes identified in 1 of the 2 etiology models. Due to their associations with microbial etiology and phenotypic severity, these 8 genes may be particularly useful candidates for further exploration. IFI27 expression was also associated with increased disease severity in our study, as has been demonstrated in other respiratory infections, including RSV, enterovirus, and coronavirus disease 2019 (COVID-19) [33–35]. Among the 4 DE genes identified in both the viral–bacterial and severity models, RAP1GAP (upregulated in association with bacterial detections and increasing severity) is involved in cell proliferation and differentiation signaling and has been implicated in pulmonary endothelial cell remodeling in mouse models of acute lung injury [36–38]. CD177 (downregulated in association with bacterial detections and upregulated with increasing severity) is primarily expressed on neutrophils and serves as a specific marker for neutrophil adhesion to the endothelium and migration into tissues [39]. Differential expression of CD177 has been associated with COVID-19 illness severity [40], severe influenza [41], and septic shock [42]. Finally, PI3, OLFM4, and ABO have been shown previously to be associated with acute respiratory distress syndrome mortality [43] and RSV disease severity [44, 45] respectively. Each of these genes encodes for proteins with distinct properties ranging from cell growth and cellular differentiation, to neutrophil adhesion and direct antimicrobial activity. Taken together, these data provide insights into the complex, coordinated response to pneumonia in children.
This study must be considered in the context of potential limitations. Typical bacteria were uncommonly detected, and this group may be underestimated due to imperfect diagnostics. Etiology misclassification was minimized by leveraging data from a well-characterized cohort of children hospitalized with pneumonia that included comprehensive viral and bacterial diagnostics. Relatedly, the dominance of viral detections in the cohort may bias the selection of identified DE genes. It is also possible that a small fraction of controls had asymptomatic infections, although children developing symptoms within 1 week of enrollment were excluded. Only 10% of the EPIC cohort was included in the current analysis, and it is possible that the RNA-Seq cohort was sicker (by virtue of having blood samples available) or otherwise differed from the larger EPIC cohort. Notably, however, the RNA-Seq cohort was limited to EPIC participants enrolled in the last 6 months of the study (∼20% of the full study period) and at only 2 of the 3 participating sites. Furthermore, the clinical and demographic features, as well as outcome distributions, were similar between the 2 cohorts, suggesting that sampling bias was likely not a major limitation. While blood samples were collected as early as possible in the EPIC study (often in the emergency department), it is likely that some participants presented at the peak of their illness, suggesting that the identified DE genes associated with severity were correlative rather than predictive of clinical deterioration. The group of children classified as moderate severity (acute care inpatients) was large and likely heterogenous, and outpatients with pneumonia were not enrolled. Finer gradations of severity classifications and inclusion of ambulatory pneumonia cases may have identified other DE genes and enhanced the generalizability of our findings. Additionally, the genes identified for the predictive biomarkers were chosen by lasso regularization, a variable selection technique whereby representative genes are chosen when sets of correlated genes are present. This approach results in more parsimonious models, a potential advantage for future clinical application, but additional genes are likely involved in responses to differing microbial etiologies and phenotypic disease severity in childhood pneumonia.
The differing profiles identified in this study suggest the potential value of host transcriptome analysis to expand our knowledge of pneumonia pathogenesis and the host response. Much more work is needed, however, before considering evaluation of these biosignatures for application in the clinical setting.
Notes
Acknowledgments. The authors thank the children and their families who participated in the study; members of the 16-0036 study team (Julie Anderson, RN; Gayle Johnson, RN, BSN; Shanda Phillips, RN, BSN; Katherine Sokolow, RN, MSN; Sandra Yoder, MT; Deborah Myers, CCRP; and Robert Adkisson, RN); members of the Centers for Disease Control and Prevention (CDC) EPIC Team (Seema Jain, MD; Krow Ampofo, MD; Andy Pavia, MD; and Jody Cockcroft, BS); and the Emory Vaccine and Therapeutics Evaluation Unit administrative and finance core for their support, including Dean Kleinhenz, Hannah Huston, Nadine Rouphael, and Michele Paine McCullough.
Financial support. This work was supported by the Division of Microbiology and Infectious Diseases at the National Institute of Allergy and Infectious Diseases, National Institutes of Health (NIH), under contract numbers HHSN272201300015I (Vanderbilt), HHSN272201300018I (Emory), and R01AI125642 (to D. J. W.). Next generation sequencing services were provided by the Emory National Primate Research Center Genomics Core which is supported in part by NIH P51OD011132 and NIH S10OD026799. The Etiology of Pneumonia in the Community (EPIC) Study was supported by the Influenza Division of the National Center for Immunization and Respiratory Diseases at the CDC.
References
Author notes
Potential conflicts of interest. D. J. W. reports in-kind research support from bioMérieux for unrelated work. C. B. C. reports serving as a consultant to Pfizer, Moderna, GSK, and Vir for unrelated work. K. M. E. has received grant funding from the NIH and the CDC; has served as a consultant to Bionet and IBM; and has been a member of the data safety and monitoring board for Sanofi, X-4 Pharma, Seqirus, Moderna, Pfizer, Merck, Roche, and CEPI. O. R. reports research grant support to his institution from Janssen, Merck, NIH, and the Gates Foundation; and fees for participation in advisory boards from Sanofi Pasteur, Merck, Lilly, Adagios, and Pfizer and for lectures from Pfizer, Sanofi Pasteur, and AstraZeneca. E. J. A. receives compensation from Moderna and has consulted for Pfizer, Sanofi Pasteur, GSK, Janssen, and Medscape; serves on safety monitoring boards for Kentucky BioProcessing and Sanofi Pasteur; and serves on a data adjudication board for WCG and ACI Clinical. His institution receives funds to conduct clinical research, unrelated to this work, from MedImmune, Regeneron, PaxVax, Pfizer, GSK, Merck, Sanofi Pasteur, Janssen, and Micron, and his institution has also received funding from NIH to conduct clinical trials of COVID-19 vaccines. S. R. A. reports research grant support to her institution unrelated to this work from Pfizer, Moderna, Contrafect, and Enanta. All other authors report no potential conflicts.
All authors have submitted the ICMJE Form for Disclosure of Potential Conflicts of Interest. Conflicts that the editors consider relevant to the content of the manuscript have been disclosed.

