


Abstract
Respiratory syncytial virus (RSV) is a leading cause of acute respiratory illness (ARI) in older adults. Optimizing diagnosis could improve understanding of RSV burden.
We enrolled adults ≥50 years of age hospitalized with ARI and adults of any age hospitalized with congestive heart failure or chronic obstructive pulmonary disease exacerbations at 2 hospitals during 2 respiratory seasons (2018–2020). We collected nasopharyngeal (NP) and oropharyngeal (OP) swabs (n = 1558), acute and convalescent sera (n = 568), and expectorated sputum (n = 153) from participants, and recorded standard-of-care (SOC) NP results (n = 805). We measured RSV antibodies by 2 immunoassays and performed BioFire testing on respiratory specimens.
Of 1558 eligible participants, 92 (5.9%) tested positive for RSV by any diagnostic method. Combined NP/OP polymerase chain reaction (PCR) testing yielded 58 positives, while separate NP and OP testing identified 11 additional positives (18.9% increase). Compared to study NP/OP PCR alone, the addition of paired serology increased RSV detection by 42.9% (28 vs 40) among those with both specimen types, while the addition of SOC swab PCR increased RSV detection by 25.9% (47 vs 59).
The addition of paired serology testing, SOC swab results, and separate testing of NP and OP swabs improved RSV diagnostic yield in hospitalized adults.
Acute respiratory illness (ARI), which includes acute upper and lower respiratory tract infections, causes significant morbidity and mortality in the United States and worldwide [1–3]. Respiratory syncytial virus (RSV) is an important cause of ARI and is estimated to cause 146 000–219 000 hospitalizations per year in the United States among adults [1]. RSV-associated hospitalizations in adults occur most commonly in the elderly and in those with congestive heart failure (CHF), chronic obstructive pulmonary disease (COPD), or immunodeficiency [4–11]. Estimates of the RSV-associated hospitalizations in adults vary, but data suggest that up to 10% of adults admitted with ARI during the winter have RSV; the burden of RSV among adults remains underestimated for many reasons, including the infrequency of standard-of-care (SOC) testing [4–6, 12–15].
The diagnosis of RSV has evolved substantially in the past 2 decades with movement away from viral culture and RSV rapid antigen detection to more sensitive nucleic acid amplification tests such as reverse transcription-polymerase chain reaction (RT-PCR) [5, 16–20]. Utilization of molecular assays has the potential to reduce ancillary testing, unnecessary antibiotic use, and the duration of hospital stay and health care expenditures [21]. However, even with sensitive molecular assays, viral infections can be missed due to issues such as the lower sensitivity of multiplexed assays [22], decreased viral load over time [23], type or quality of the specimen [24, 25], and changes in viral sequences that affect primer binding [20, 26, 27]. Serologic studies of acute- and convalescent-phase specimens have detected RSV infections missed by molecular testing [5, 22, 28]. In addition, limited data suggest that sputum specimens may be more sensitive for detection of RSV than upper respiratory specimens [22, 29, 30]. Overall, adding specimen types among adults boosts detection of RSV infection, likely in part due to the lower viral loads in respiratory secretions in this population compared to children [22, 31].
Optimizing the diagnosis of RSV infection in adults would provide a more accurate understanding of the current epidemiology and burden of RSV. This could help inform RSV vaccine clinical trials and assessment of the impact of RSV vaccination, as RSV vaccines have recently received approval by the Federal Drug Administration (FDA), and the Advisory Committee on Immunization Practices now recommends that adults 60-74 years of age who are at increased risk of severe RSV disease and all aged ≥75 years should receive a single dose [32–35]. In this study, we therefore evaluated the potential to improve diagnosis with acute and convalescent serology studies or molecular testing of sputum compared to upper respiratory tract specimens in older adults hospitalized with ARI, or adults with CHF or COPD exacerbations.
METHODS
Enrollment Criteria and Samples
Adult admissions were screened at 2 hospitals (Emory University Hospital and Emory University Hospital Midtown) in Atlanta, Georgia during the respiratory viral seasons from September 2018 to March 2020 to identify those hospitalized with ARI who resided in an 8-county region comprising Georgia Health District 3 (Clayton, Cobb, Dekalb, Douglas, Fulton, Gwinnett, Newton, Rockdale). Adults ≥50 years of age who met the case definition of ARI (any symptom of nasal congestion, rhinorrhea, sore throat, hoarseness, new or increased-from-baseline cough, sputum production, dyspnea, wheezing; or admission with a diagnosis consistent with ARI) and were admitted for inpatient care or observed in the emergency department for ≥24 hours were considered eligible. Additionally, adults ≥18 years of age admitted with CHF or COPD exacerbations were also considered eligible due to the high burden of RSV-associated hospitalizations in adults with these conditions [10, 36, 37]. These hospitalized patients were considered “cases.” Duration of symptoms >14 days and prior enrollment within the preceding 28 days was exclusionary.
Healthy residents of Georgia Health District 3 ≥ 50 years of age were also screened and enrolled as controls between September and April of the 2018–2020 respiratory viral seasons. Exclusionary criteria for the controls included symptoms of ARI, CHF, or COPD within the preceding 14 days or following 7 days of enrollment, acute care hospitalization less than 28 days prior to enrollment, and enrollment in the study during the same respiratory season.
Following informed consent, nasopharyngeal and oropharyngeal (NP/OP) swabs were obtained from all enrolled participants and blood was collected for acute serology. Some participants declined the NP swab, in which case a midturbinate or nasal swab was obtained. Enrolled patients also had SOC results recorded and residual specimens collected when available. A detailed questionnaire was completed, and clinical information was abstracted from the medical record.
Participants were asked to return for convalescent serology within a target window of 21–60 days after admission. If ARI symptoms developed after enrollment, but before or at the time of the follow-up appointment, additional NP/OP swabs were obtained to evaluate for an interval RSV infection. Those with interval RSV infection were excluded from the analysis. In the second season, a cough specimen was obtained for molecular testing of the sputum from a subset of participants. The study was approved by the institutional review board at Emory University.
Laboratory Testing
The BioFire FilmArray Respiratory Viral Panel 2.0 (RVP, “study PCR”) was used to test all study-specific NP, OP, and NP/OP combined specimens and sputum specimens as previously outlined [29, 38]. NP and OP specimens were combined in 1:1 volumetric ratio and analyzed for all participants. If NP/OP results were negative, then the stand-alone NP and OP samples were additionally tested separately. The BioFire RVP assay has a reported sensitivity of 2E-02 50% tissue culture infectious dose (TCID50)/mL for RSV from upper respiratory specimens [39–41]. The assay is not independently validated for sputum. SOC molecular testing included GeneXpert and BioFire RVP, which were ordered at the clinician's discretion in a subset of enrolled patients.
We measured RSV immunoglobulin G (IgG) by 2 separate immunoassays (serology 1, IgG binding to RSV subgroup A plus subgroup B Hep-2 cell lysate by enzyme immunoassay; and serology 2, multiplexed total antibody binding to RSV antigens Ga, Gb, M, and N by Luminex). Acute and convalescent samples were run in the same batch by each method. The serology 1 (enzyme immunoassay) used an equal volume mixture of lysate from RSV A2 (subgroup A strain) and RSV B1 (subgroup B strain) grown in Hep-2 cells as previously described [42]. A reference standard curve for each run was generated with 2-fold serial dilutions of the BEI Resources NR-4021 serum and each plate included low, medium, and negative RSV antibody titer control sera. A horseradish peroxidase-conjugated goat anti-human IgG antibody was used as the secondary antibody. The plates were developed using o-phenylenediamine substrate, and absorbance was read at 490 nm. A serum specimen was considered positive for RSV IgG if the mean of 3 RSV antigen wells (P) was greater than the mean plus 3 standard deviations of 3 control antigen wells (N) and P − N was greater than the analogous value for IgG depleted serum. The antibody titer was estimated from the specimen P − N absorbance by interpolation from the P − N values of the reference standard curve.
The second assay, serology 2, was a Luminex assay based on paramagnetic particles (Luminex Corporation). Recombinant nucleoprotein (N), matrix protein (M), and peptides for G protein A and B (Ga and Gb, respectively) were passively conjugated to microspheres. The assay reference standard was composed of a pool of adult sera that was formulated to give balanced reference curves for each of the 4 antigens. All sample dilutions were performed in a phosphate-buffered saline (PBS) 0.1% tween solution with 0.5% bovine serum albumin (assay buffer), and all microspheres were washed in PBS and 0.5% Tween solution with 0.01% sodium azide. A goat anti-human IgG + IgM + IgA (Southern Biotechnology) was used as the secondary antibody. Assay plates were read on a Bioplex-200 reader. The fluorescence of the phycoerythrin conjugate in standard and samples was used to calculate the concentration of antibody to each of the 4 antigens in arbitrary units/mL.
Statistical Analysis
Participants were considered to have positive PCR results if they had detectable RSV by BioFire testing of either NP specimens alone, OP specimens alone, or combined NP/OP specimens. These results were compared to those of SOC NP PCR testing, BioFire testing of sputum, and acute and convalescent serology via serology 1 and serology 2 to determine the performance characteristics. A ≥ 4-fold rise in IgG or total antibody titer between acute and convalescent sera was considered positive.
Baseline characteristics of the study cohort for both hospitalized adults (cases) and healthy controls (controls) were analyzed using descriptive statistics. Prevalence of RSV detection was calculated within each testing comparison strata and presented with Venn diagrams [43, 44]. The prevalence ratio between PCR detections and overall RSV detections was used to determine the percent increase in case detection by adding the other testing method. Agreement between testing methods was compared by calculating a Cohen kappa statistic (κ). Sensitivity was calculated for each testing method, where a positive by any testing source was considered RSV positive. Statistical analyses were performed using SAS version 9.4 software (SAS Institute).
RESULTS
Characteristics of Cases
Of 3142 eligible patients during the respiratory viral seasons from September 2018 to March 2020, we enrolled 1584 participants, of whom 1558 had NP/OP specimens and were eligible for inclusion in this analysis (cases). Of these, 805 had SOC NP PCR testing results available, 568 had paired acute and convalescent sera (568 analyzed by serology 1 and 270 additionally analyzed by serology 2), and 153 had expectorated sputum specimens (Figure 1). The number of days between the collection of acute and convalescent specimens tested by serology for cases had a median of 30.5 days (interquartile range [IQR], 23–48; range, 9–183 days). The baseline demographic and clinical characteristics of the cohort are shown in Table 1. Overall, 92 (5.9%) cases tested positive for RSV by any diagnostic method. BioFire testing of combined NP/OP specimens (ie, viral transport media from 2 swabs combined and tested) yielded 58 positives, while testing OP and NP separately for those that were negative identified 11 additional positives.
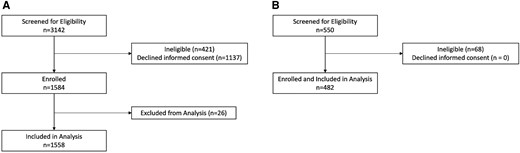
Flowchart of enrolled patients for (A) cases and (B) controls.
Demographics, Diagnosis, and Specimen Types Available From Cases
| Characteristic | Available Testing | ||||
|---|---|---|---|---|---|
| Study PCR | SOC NP PCR | Serology 1 | Serology 2 | Sputum | |
| No. | 1558 | 805 | 568 | 268 | 153 |
| Age, y, median (IQR) | 64 (56–73) | 64 (57–73) | 63 (56–70) | 61 (55–69) | 63 (55–71) |
| Female sex | 863 (55.4) | 466 (57.9) | 324 (57.0) | 159 (59.3) | 80 (52.3) |
| Race | |||||
| White | 376 (24.1) | 232 (28.8) | 142 (25.0) | 80 (29.9) | 32 (20.9) |
| Black/African American | 1083 (69.5) | 514 (63.9) | 394 (69.4) | 172 (64.2) | 111 (72.6) |
| Other, multiple | 68 (4.4) | 37 (4.6) | 21 (3.7) | 10 (3.7) | 9 (5.9) |
| Ethnicity, Hispanic | 31 (2.0) | 22 (2.7) | 11 (1.9) | 6 (2.2) | 1 (0.6) |
| Diagnosis | |||||
| ARI | 757 (48.6) | 514 (63.8) | 288 (50.7) | 131 (48.9) | 64 (41.8) |
| CHF | 490 (31.4) | 120 (14.9) | 161 (28.3) | 76 (28.4) | 43 (28.1) |
| COPD | 311 (20.0) | 171 (21.2) | 119 (21.0) | 61 (22.8) | 46 (30.1) |
| Clinical outcome | |||||
| ICU | 327 (21.0) | 229 (28.4) | 102 (17.9) | 48 (17.8) | 25 (16.1) |
| Length of stay, d (IQR) | 4 (2–7) | 4 (3–7) | 4 (2.5–6) | 4 (3–7) | 3 (2–5) |
| Mechanical ventilation | 59 (3.8) | 42 (5.2) | 7 (1.2) | 1 (0.4) | 2 (1.3) |
| Radiographic pneumonia | 492 (31.6) | 329 (40.9) | 184 (32.4) | 94 (35.1) | 37 (24.2) |
| Death | 53 (3.4) | 37 (4.6) | 5 (0.9) | 1 (0.4) | 2 (1.3) |
| Respiratory samples available | |||||
| Study PCR NP/OP | … | 805 (100.0) | 568 (100.0) | 268 (100) | 153 (100.0) |
| Study PCR, NP alone | 742 (47.6) | 0 (0.0) | 242 (42.6) | 102 (38.1) | 75 (49.0) |
| Study PCR, OP alone | 740 (47.) | 0 (0.0) | 241 (42.4) | 102 (38.1) | 75 (49.0) |
| SOC NP PCR | 805 (51.7) | … | 323 (56.9) | 270 (100.0) | 77 (50.3) |
| Any serology | 568 (36.5) | 323 (40.1) | 568 (100.0) | 268 (100.0) | 57 (37.3) |
| Serology 1 | 568 (36.5) | 323 (40.1) | … | 268 (100.0) | 57 (37.3) |
| Serology 2 | 268 (17.2) | 164 (20.4) | 268 (47.2) | … | 8 (5.2) |
| Sputum PCR | 153 (9.8) | 77 (9.6) | 57 (10.0) | 8 (3.0) | … |
Data are No. (%) except where indicated. Study PCR represents all who had a research specimen (combined NP/OP or stand-alone NP or OP) tested by BioFire respiratory panel. SOC NP PCR represents all who had standard-of-care nucleic acid amplification testing of an NP specimen for RSV. Serology 1 represents IgG binding to RSV lysate as measured by ELISA. Serology 2 represents IgG binding to either RSV F, G, M, or N by multiplexed serology platform. Sputum represents all who had an expectorated sputum sample available for BioFire respiratory panel analysis.
Abbreviations: ARI, acute respiratory infection; CHF, congestive heart failure; COPD, chronic obstructive pulmonary disease; ELISA, enzyme-linked immunosorbent assay; ICU, intensive care unit; IQR, interquartile range; NP, nasopharyngeal; OP, oropharyngeal; SOC, standard-of-care.
Characteristics of Controls
There were 465 contemporaneous control participants enrolled with study NP/OP PCR results available, of whom 341 had paired acute and convalescent sera (341 analyzed by serology 1 and 285 analyzed by serology 2), and 4 had sputum specimens (Supplementary Table 1). The median number of days between the collection of acute and convalescent specimens was 22 (IQR, 21–28; range, 16–60 days). Overall, 8 (1.7%) controls tested positive for RSV by any diagnostic method, where 4 (0.8%) were positive by study NP/OP PCR, 5 (1.5%) were positive by 4-fold increases in serology (2 by serology 1 and 3 by serology 2), and none were positive by sputum PCR.
Serology Versus Study PCR
Of the 568 cases with acute and convalescent serology available for testing and NP/OP specimens available, 40 (7.0%) had either a ≥ 4-fold rise in antibody titer by either serology method or a positive study NP/OP PCR (Table 2 and Supplementary Figure 1). Among these 40 participants, 16 (40.0%) had both a ≥ 4-fold rise and a positive molecular test; 12 (30.0%) had a positive molecular test without a ≥ 4-fold rise; and 12 (30.0%) had a ≥ 4-fold rise without a positive molecular test (Figure 2A). Overall, RSV detections increased 42.9% (40 vs 28) with addition of paired acute and convalescent serology testing over study NP/OP PCR (κ = 0.55; 95% confidence interval [CI], .39–.71), with serology having 60.9% sensitivity (95% CI, 46.8%–75.0%; Table 3) compared to detection by any method. For the 361 participants with acute sera collected ≤5 days from symptom onset, adding serology to study NP/OP specimens increased diagnostic yield by 46.2% (19 vs 13) (κ = 0.58; 95% CI, .35–.80), with 58.3% sensitivity (95% CI, 38.6%–78.0%) (Table 2 and Table 3). For the 207 participants with acute sera collected >5 days from symptom onset, the addition of serology increased case detection by 38.4% (21 vs 15) (κ = 0.52; 95% CI, .29–.75), with 63.6% sensitivity (95% CI, 43.5%–83.7%; Table 2 and Table 3) compared to detection by any method. There were 9 cases who were RSV negative by serology 1, but RSV positive by serology 2. Of these, the antigens detected by serology 2 included 2 Ga, 4 Gb, 5 M, and 2 N. Three participants had multiple antigens detected.
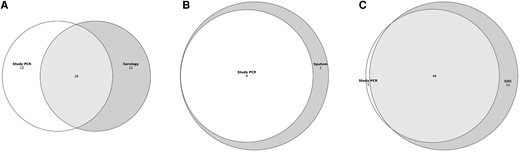
Venn diagrams of RSV diagnostic testing yield for cases with (A) study PCR and 4-fold increases via any serology (κ = 0.55; 95% CI, .39–.71; n = 568); (B) study PCR and sputum PCR (κ = 0.89; 95% CI, .66–1.00; n = 153); and (C) study PCR and SOC NP PCR (κ = 0.87; 95% CI, .80–.94; n = 805). Abbreviations: CI, confidence interval; NP, nasopharyngeal; PCR, polymerase chain reaction; RSV, respiratory syncytial virus; SOC, standard-of-care.
Comparison Between Specimen Type and Testing Results for Cases
| Groups by Available Specimens | No. | Count of Positive Patients by Study PCR | Percentage Positive by Study PCR | Count of Positive by Any Testing Method in Row | Percentage Positive by Any Testing Method in Row | Percent Increase in RSV Detection |
|---|---|---|---|---|---|---|
| 3 specimens | ||||||
| Study PCR, SOC, serology any | 323 | 24 | 7.4 | 37 | 11.5 | 55.4 |
| Study PCR, SOC, serology 1 | 323 | 24 | 7.4 | 33 | 10.2 | 37.8 |
| Study PCR, SOC, serology 2 | 164 | 12 | 7.3 | 18 | 11.0 | 50.7 |
| Study PCR, SOC, sputum | 78 | 3 | 3.9 | 4 | 5.2 | 33.3 |
| Study PCR, serology any, sputum | 57 | 0 | 0.0 | 1 | 1.7 | NA |
| Study PCR, serology 1, sputum | 57 | 0 | 0.0 | 1 | 1.7 | NA |
| Study PCR, serology 2, sputum | 8 | 0 | 0.0 | 0 | 0.0 | NA |
| 2 specimens | ||||||
| Study PCR, SOC | 805 | 47 | 5.8 | 59 | 7.3 | 25.9 |
| Study PCR, serology any | 568 | 28 | 4.9 | 40 | 7.0 | 42.9 |
| Study PCR, serology collected ≤5 d from symptom onset | 361 | 13 | 3.6 | 19 | 5.3 | 46.2 |
| Study PCR, serology collected >5 d from symptom onset | 207 | 15 | 7.3 | 21 | 10.1 | 38.4 |
| Study PCR, serology 1 | 568 | 28 | 4.9 | 31 | 5.5 | 12.2 |
| Study PCR, serology 2 | 268 | 15 | 5.6 | 24 | 9.0 | 60.7 |
| Study PCR, sputum | 153 | 4 | 2.6 | 5 | 3.3 | 26.9 |
| 1 specimen | ||||||
| Study PCR | 1558 | … | … | 69 | 4.4 | … |
| NP/OP | 1558 | … | … | 58 | 3.7 | … |
| NP, previous NP/OP negative only | 742 | … | … | 10 | 1.3 | … |
| OP, previous NP/OP negative only | 740 | … | … | 3 | 0.4 | … |
| SOC NP PCR | 805 | … | … | 58 | 7.2 | … |
| Serology | 568 | … | … | 28 | 4.9 | … |
| Acute specimen collected ≤5 d from symptom onset | 361 | … | … | 14 | 3.9 | … |
| Acute specimen collected >5 d from symptom onset | 207 | … | … | 14 | 6.8 | … |
| Serology 1 | 568 | … | … | 19 | 3.4 | … |
| Serology 2 | 268 | … | … | 16 | 6.0 | … |
| Sputum | 153 | … | … | 5 | 3.3 | … |
Study PCR represents all who had a research specimen (combined NP/OP or stand-alone NP or OP) tested by BioFire respiratory panel. Initially, NP and OP VTM was combined and tested; those that were negative by this approach had NP and OP VTM tested separately. SOC represents all who had standard-of-care nucleic acid amplification testing of an NP specimen for RSV. Serology 1 represents IgG binding to RSV lysate as measured by ELISA. Serology 2 represents IgG binding to either RSV F, G, M, or N by multiplexed serology platform. Sputum represents all who had an expectorated sputum sample available for BioFire respiratory panel analysis. Percent increase in RSV detection represents the percentage increase in detection of RSV using the methods in the row above the BioFire results alone.
Abbreviations: ELISA, enzyme-linked immunosorbent assay; NA, not applicable; NP, nasopharyngeal; OP, oropharyngeal; PCR, polymerase chain reaction; RSV, respiratory syncytial virus; SOC, standard-of-care; VTM, viral transport medium.
Study Specimen Collection, RSV Prevalence Results, and Sensitivity by Specimen Type for Cases
| Study Specimen | No. | % With This Specimen Type | RSV Positive by Specimen, No. (%) | % of All Positives Identified by This Specimen Type (95% CI) | RSV Positive From Any Source Among Patients With Specimen Type, No. | Sensitivitya (95% CI) |
|---|---|---|---|---|---|---|
| Overall | 1558 | 100.0 | 92 (5.9) | … | 92 | … |
| Study PCR | 1558 | 100.0 | 69 (4.4) | 75.0 (66.2–83.8) | 92 | 75.0 (66.2–83.8) |
| NP/OP | 1558 | 100.0 | 58 (3.7) | 63.0 (53.1–72.9) | 92 | 63.0 (53.1–72.9) |
| NP | 742 | 47.6 | 10 (1.4) | 10.9 (4.5–17.3) | 16 | 62.5 (38.8–86.2) |
| OP | 740 | 47.5 | 3 (0.4) | 3.3 (−.4 to 7.0) | 16 | 18.8 (−.3 to 37.9) |
| SOC NP PCR | 805 | 51.7 | 58 (7.2) | 63.0 (53.1–72.9) | 65 | 89.2 (81.7–96.7) |
| Serology | 568 | 36.5 | 28 (4.9) | 30.4 (21.0–39.8) | 46 | 60.9 (46.8–75.0) |
| Acute specimen collected ≤5 d from symptom onset | 361 | 23.2 | 14 (3.9) | 15.2 (7.9–22.5) | 24 | 58.3 (38.6–78.0) |
| Acute specimen collected >5 d from symptom onset | 207 | 13.3 | 14 (6.8) | 15.2 (7.9–22.5) | 22 | 63.6 (43.5–83.7) |
| Serology 1 | 568 | 36.5 | 19 (3.4) | 20.6 (12.3–28.9) | 46 | 41.3 (27.1–55.5) |
| Serology 2 | 268 | 17.2 | 16 (6.0) | 17.4 (9.7–25.1) | 27 | 59.2 (40.7–77.7) |
| Sputum | 153 | 9.8 | 5 (3.3) | 5.4 (.8–10.0) | 5 | 100.0 (100–100) |
Study PCR represents all who had a research specimen (combined NP/OP or stand-alone NP or OP) tested by BioFire respiratory panel. SOC represents all who had SOC nucleic acid amplification testing of an NP specimen for RSV. Serology 1 represents IgG binding to RSV lysate as measured by ELISA. Serology 2 represents IgG binding to either RSV F, G, M, or N by multiplexed serology platform. Sputum represents all who had an expectorated sputum sample available for BioFire respiratory panel analysis.
Abbreviations: ELISA, enzyme-linked immunosorbent assay; IgG, immunoglobulin G; NP, nasopharyngeal; OP, oropharyngeal; PCR, polymerase chain reaction; RSV, respiratory syncytial virus; SOC, standard-of-care.
aSensitivity is limited to those with results with that specimen type, ie, count of positives by that specimen type divided by count of all positives from any source among those with results by that specimen type.
For 341 control participants, the addition of paired serology to study NP/OP PCR increased case detection by 200% (6 vs 2) (κ = 0.28; 95% CI, −.16 to .72), with 83% sensitivity (95% CI, 54%–100%) compared to detection by any method (Supplementary Tables 2 and 3). There were 3 controls who were RSV negative by serology 1, but RSV positive by serology 2. Of these, 2 participants had all 4 antigens detected, while 1 participant was positive by N and M.
Sputum Versus Study NP/OP PCR
Sputum was obtained during the second season (2019–2020) from 153 cases who could provide expectorated specimens. Of these, 5 (3.3%) were positive by sputum BioFire RVP testing: 4 of these cases were also detected by study NP/OP PCR, resulting in strong agreement between testing methods (κ = 0.89; 95% CI, .66–1.00; Table 2, Figure 2B, and Supplementary Figure 2). Only 4 controls were able to provide sputum, and all tested negative for RSV.
Standard-of-Care NP Versus Study NP/OP PCR
Of the 1558 cases with study NP/OP samples available, 805 also had SOC NP PCR results available. SOC specimens were collected a median of 1 day (IQR, 1–6 days) after illness onset, while the study NP/OP samples were collected a median of 2 days (IQR, 1–6 days) after illness onset. Of the 805 participants with both test results available, 58 (7.2%) were positive by SOC testing for RSV, 47 of whom also tested positive by study NP/OP PCR (κ = 0.87; 95% CI, .80–.94). Two participants who tested negative by SOC PCR were positive by study NP/OP PCR (Figure 2C). Overall, SOC NP PCR had 89.2% sensitivity (95% CI, 81.7%–96.7%) for the detection of RSV, while the study NP/OP PCR had 75.0% sensitivity (95% CI, 66.2%–83.8%) compared to detection by any method (Table 2 and Table 3).
Standard-of-Care NP PCR Versus Study NP/OP PCR Versus Serology
Of the cases with 3 specimen types available, 323 had study NP/OP PCR, SOC NP PCR, and any serology results available. The addition of any serology (1 or 2) and SOC testing increased RSV detection by 55.4% (37 vs 24). Of these participants, 164 had sera analyzed by both serology 1 and 2. The addition of serology 1 to study NP/OP PCR and SOC NP PCR increased RSV detection by 37.8% (33 vs 24), while the addition of serology 2 increased RSV detection by 50.7% (18 vs 12).
Of the cases who had sputum samples in addition to study NP/OP PCR and SOC PCR (n = 78), the addition of sputum PCR increased RSV detection by 33.3% and had 100% sensitivity compared to detection by any method (Table 2, Figure 3, and Supplementary Figure 3). Only 31 cases had 4 specimen types available, and of these only 1 had RSV detected.

Relative percent increase in RSV detection in cases by available testing methods. Study PCR represents all who had a research specimen (combined NP/OP or stand-alone NP or OP) tested by BioFire respiratory panel. SOC represents all who had standard-of-care nucleic acid amplification testing of an NP specimen for RSV. Serology 1 represents IgG binding to RSV lysate as measured by enzyme-linked immunosorbent assay. Serology 2 represents IgG binding to either RSV F, G, M, or N by multiplexed serology platform. Sputum represents all who had an expectorated sputum sample available for BioFire respiratory panel analysis. Abbreviations: IgG, immunoglobulin G; NP, nasopharyngeal; OP, oropharyngeal; PCR, polymerase chain reaction; RSV, respiratory syncytial virus; SOC, standard of care.
DISCUSSION
In this prospective surveillance study of older adults with ARI and adults hospitalized with CHF or COPD exacerbations, we compared results of study NP/OP PCR with acute and convalescent serology, sputum PCR, and SOC NP PCR for detecting RSV. We found that the addition of paired acute and convalescent sera with a 4-fold threshold for RSV-binding titer increased detection of RSV infections by 42.9% (40 vs 28 cases) over study NP/OP alone and had 60.9% sensitivity in cases. The addition of multiplexed serology 2, which measured total antibody binding to 4 non-F RSV antigens (Ga, Gb, M, and N) by Luminex, conferred the greatest increase in diagnostic yield. We did not identify a statistically significant difference in the diagnostic yield or sensitivity when comparing early (≤5 days) versus late (>5 days) collection of acute sera from illness onset. Overall, these data indicate that in our study setting, paired acute and convalescent serology significantly improved the diagnostic yield for RSV over standard BioFire testing of NP/OP specimens.
We additionally found that SOC NP swabs had a higher sensitivity than study NP/OP swabs despite the study specimens sampling 2 anatomic sites. This may have been attributable in part to the dilution effect of combining the NP and OP research specimens at a 1:1 volumetric ratio. Alternatively, it may have been due to the earlier collection of SOC specimens by a median of 1 day. RSV viral shedding has been estimated to reach its peak a median of 6.2 days postinfection with a mean duration of 14.1 days [45]. As viral loads in secretions are lower among adults who may present later for care [23], any steps that delay collection or introduce dilution have the potential to reduce diagnostic yield.
We found BioFire analysis of expectorated sputum samples in a subset of participants increased detection of RSV infection by 26.9% (5 vs 4 cases). These findings were limited by the small number of sputum positives, although a recent meta-analysis reported a 52% increase in detection compared to nasal/NP swab based on pooling data from 3 studies [28]. Saliva is a specimen type that is more easily and consistently collected than sputum and similarly increases detection yield, which could be considered as an alternative in future studies [24, 25]. Although testing of multiple sample types increased diagnostic yield of cases, only 8 (1.7%) of contemporaneous healthy controls tested positive for RSV by any diagnostic method, where 4 (0.9%) were positive by study NP/OP PCR and 5 (1.5%) were positive by serology. These results underscore the low but appreciable background detection rate of RSV among asymptomatic adults [5, 15].
Currently, the most utilized methods of RSV diagnosis in the United States include RT-PCR or antigen testing of NP specimens. Serology is not utilized in the clinical setting, partly because the delayed collection of convalescent serum limits clinical applicability during the acute illness. Nevertheless, the added diagnostic value of paired serology could have broad applicability for epidemiologic studies and RSV vaccine clinical trials. In 2023, the FDA approved 2 RSV vaccines for older adults, a maternal RSV vaccine, and a long-acting monoclonal antibody for passive protection of infants [46]. Furthermore, numerous other RSV vaccines and therapeutics are currently undergoing evaluation in phase 2 and 3 clinical trials. Thus, the need to accurately diagnose RSV, both in clinical trials and postlicensure studies, is critical. Optimizing diagnosis through the addition of acute and convalescent serology, especially based on non-F RSV antigens, could provide a more accurate measure of the burden of RSV pre- and postimmunization.
Our data demonstrated moderate concordance between RT-PCR and ≥4-fold rise in antibody titers between acute and convalescent sera, and the added diagnostic yield was similar to observations in previous studies. Data from the Centers for Disease Control and Prevention (CDC) Etiology of Pneumonia in the Community (EPIC) study found that paired acute and convalescent serology improved diagnostic yield of RSV infections by 28.6% in adults 18–65 years and by 50.0% in adults >65 years of age [28]. Furthermore, a recent systematic literature review of diagnostic testing in adults found that the addition of paired serology to NP or nasal swabs increased RSV detection by 34%–64% over NP swab RT-PCR alone [1, 30, 47–49]. Another recently published prospective study found a several-fold increase in detection when adding paired serology to NP swab alone [24]. One difference between our study and others is that our reference was NP/OP swab combined, and only those that tested negative by NP/OP were subsequently tested by stand-alone NP and OP specimens. A recent meta-analysis found that adding OP swabs to NP/nasal swabs boosts RSV detection by 28%, and thus our results may have underestimated the gain from serology versus using nasal/NP swab alone as the reference, which is the method most commonly seen in the literature [31].
Limitations to this study should be considered. Because there is no diagnostic method that reliably detects all RSV infections, there is no diagnostic gold standard to independently determine sensitivity and specificity of the different assays. Additionally, all subjects did not have all specimens available for testing. Only a subset of enrolled individuals returned for convalescent serology, and some of these were delayed due to the onset of the coronavirus disease 2019 (COVID-19) pandemic. Our rate of follow-up, however, was similar to that observed for other studies that included collection of convalescent sera [4, 28]. As vaccination uptake increases among the eligible populations, measurement of non-F antibodies will be necessary to differentiate between vaccine-induced and infection-induced immune responses. While this distinction could not be made using serology 1, serology 2 detected antibody binding to nonvaccine RSV antigens Ga, Gb, M, and N proteins. Such assays may be the preferred method of determining serostatus in future natural infection studies.
In conclusion, adding paired serology increased diagnostic yield over molecular testing of NP/OP swabs alone for RSV. Pooling NP and OP swab media prior to PCR testing reduced RSV detections, likely due to dilution effect. SOC NP swabs identified additional positives over study NP/OP swab testing, potentially due to their earlier collection. Accurately diagnosing RSV is critical to fully understanding the burden of RSV disease and to ascertaining the full potential impact of RSV vaccination.
Supplementary Data
Supplementary materials are available at The Journal of Infectious Diseases online (http://jid.oxfordjournals.org/). Supplementary materials consist of data provided by the author that are published to benefit the reader. The posted materials are not copyedited. The contents of all supplementary data are the sole responsibility of the authors. Questions or messages regarding errors should be addressed to the author.
Notes
Acknowledgments. We thank the patients who consented to participate in this study. We thank the clinical research teams at Emory Hope Clinic and Emory Children's Center-Vaccine Research Clinic, and the nursing staff and physicians of Emory University Hospital (EUH) and Emory University Hospital Midtown (EUHM) for their assistance with this study.
Author contributions. E. J. A., E. B., R. H., Q. L., B. G., D. S., and L. J. A. designed the study. A. T., T. G., G. E., V. P., M. T., O. R., L. S., S. J., H. S., S. G., W. L., K. S., C. C., K. H., and A. C. collected data. E. J. A., A. T., G. E., E. B., C. A. R., and L. J. A. performed primary data analysis. E. J. A., A. T., G. E., and C. A. R drafted the manuscript. All authors provided intellectual contribution and reviewed and approved the final draft of the manuscript.
Financial support. This work was supported by Pfizer and was conducted as a collaboration between Emory University and Pfizer, Inc.
References
Author notes
Potential conflicts of interest. E. J. A. has consulted for Pfizer, Sanofi Pasteur, GSK, Janssen, Moderna, and Medscape; served on a safety monitoring board for Kentucky BioProcessing, Inc and Sanofi Pasteur; served on a data adjudication board for WCG and ACI Clinical; is currently employed by Moderna; and his institution had received funds to conduct clinical research unrelated to this study from MedImmune, Regeneron, PaxVax, Pfizer, GSK, Merck, Sanofi-Pasteur, Janssen, and Micron, and from the National Institutes of Health to conduct clinical trials of COVID-19 vaccines. C. A. R. has received institutional support from ModernaTX, Inc, Pfizer, Inc, BioFire, Inc, GSK, plc, MedImmune, Micron Technology, Inc, Janssen Pharmaceuticals, Merck & Co, Inc, Novavax, PaxVax, Regeneron, Sanofi Pasteur, the Centers for Disease Control and Prevention, and the National Institutes of Health; and is coinventor of patented RSV vaccine technology licensed to Meissa Vaccines, Inc. L. J. A. has done paid consultancies on RSV vaccines for Bavarian Nordic, ClearPath Vaccines Company, Janssen, Pfizer, and ADVI; is a coinventor on several CDC patents on the RSV G protein and its CX3C chemokine motif relative to immune therapy and vaccine development; is coinventor on a patent filing for use of RSV platform VLPs with the F and G proteins for vaccines; and his laboratory is currently receiving funding through Emory University from Pfizer for laboratory studies for RSV surveillance studies in adults, Sciogen for animal studies of RSV vaccines, and Advaccine Pharmaceuticals, Ltd for RSV neutralizing antibody studies. N. R. serves as safety consultant for ICON, CyanVac, and EMMES; serves or has served on the advisory boards for Sanofi, Seqirus, Pfizer, and Moderna; and her institution receives funds to conduct research from Sanofi, Lilly, Merck, Quidel, Immorna, Vaccine Company, and Pfizer. E. B., R. H., Q. L., B. D. G., L. J., D. S., W. K., and S. U. are employees of Pfizer, Inc with stock/stock options or were employees during the conduct of this study. All other authors report no potential conflicts.
All authors have submitted the ICMJE Form for Disclosure of Potential Conflicts of Interest. Conflicts that the editors consider relevant to the content of the manuscript have been disclosed.

