


Abstract
Oral human papillomavirus (HPV) infection and the oral microbiome are associated with oropharyngeal cancer. However, population-based data on the association of oral microbiome with oral HPV infection are limited.
A cross-sectional analysis of 5496 20–59-year-old participants in the 2009–2012 National Health and Nutrition Examination Survey was performed. Associations with oral HPV infection were assessed using multivariable logistic regression for oral microbiome α-diversity (within-sample diversity), and using principal coordinate analysis and permutational multivariate analysis of variance for β-diversity (between-sample heterogeneity).
Overall, for α-diversity, a lower number of observed amplicon sequence variants (adjusted odds ratio [aOR] = 0.996; 95% confidence interval [CI] = .992–.999) and reduced Faith's phylogenetic diversity (aOR = 0.95; 95% CI = .90–.99) were associated with high-risk oral HPV infection. β-diversity showed differentiation of oral microbiome community by high-risk oral HPV infection as measured by Bray-Curtis dissimilarity (R2 = 0.054%; P = .029) and unweighted UniFrac distance (R2 = 0.046%; P = .045). There were differential associations when stratified by sex.
Both oral microbiome α-diversity and β-diversity were marginally associated with oral HPV infection. Longitudinal studies are needed to characterize the role of the microbiome in the natural history of oral HPV infection.
Oropharyngeal cancer (OPC) is a subset of head and neck squamous cell carcinoma (HNSCC) that occurs in the tissues of the oropharynx. Human papillomavirus (HPV) infection is a significant risk factor for OPC [1]. Approximately 70% of OPC are associated with oral HPV infection, and 90% of HPV-positive OPC are related to HPV-16 [2–5]. The burden of HPV-positive OPC has grown in the past few decades. In the United States, the population-level incidence of HPV-positive OPC increased from 0.8 per 100 000 individuals to 2.6 per 100 000 from 1988 to 2004, and continued to rise by 2.5% per year from 2002 to 2012 [6, 7]. By the period of 2013–2014, the estimated incidence of HPV-positive OPC had increased to approximately 4.62 per 100 000 individuals [8].
Oral HPV infection is primarily driven by oral sexual intercourse, and men are more likely to have oral HPV infection than women [9–11]. Most oral HPV infections are cleared by the immune system, but those persisting in the upper respiratory tract epithelia can develop into cancer [12, 13]. Previous studies showed that the environment of the oral cavity may play a role in the etiology of OPC [14]. As an essential component of the oral cavity, the oral microbiome contains more than 700 species of bacteria, some of which cause chronic inflammation in the oral cavity [15, 16]. Chronic inflammation due to the oral microbiome could cause abnormal immune responses and interfere with the clearance of oral HPV infection, thus promoting carcinogenesis [14]. The oral microbiome can also cause periodontal diseases, which are risk factors for both oral HPV infection and HNSCC [17, 18].
While the vaginal microbiome diversity has been shown to be related to genital HPV infection in women [19], evidence for a similar relationship in the oral cavity is limited [20, 21]. A recent cross-sectional study of 495 participants at high risk for oral HPV infection found that the oral microbiome β-diversity differed significantly between people with and without oral HPV infection [22]. To describe the diversity of the oral microbiome by oral HPV infection status in a nationally representative sample, we conducted a cross-sectional analysis of population-based data from the 2009–2012 National Health and Nutrition Examination Surveys (NHANES).
METHODS
Study Design and Population
NHANES is a publicly available national survey conducted continually in the United States by the National Center for Health Statistics (NCHS), Centers for Disease Control and Prevention. It uses a complex, stratified, multistage probability sampling design to collect data from the noninstitutionalized civilian population [23]. NHANES data are compiled into 2-year releases (ie, 2009–2010, 2011–2012). NCHS-provided survey weights account for differential selection and nonresponse probabilities, which allow for the generation of nationally representative estimates. NHANES was approved by the National Center for Health Statistics Institutional Research Ethics Board and informed consent was obtained from participants. This analysis was deemed exempt from review by the Johns Hopkins Institutional Review Board.
NHANES conducts household interviews using a computer-assisted personal interviewing (CAPI) system, and participants are invited to provide additional data at mobile examination centers (MECs). At the MEC, participants respond to additional interviews, receive physical examinations, and provide biological specimens [24]. This study used pooled data from the 2009–2010 and 2011–2012 NHANES, which had unweighted cumulative examination response rates of 77.3% and 69.5%, respectively. Eligibility for our study was determined based on the availability within NAHNES 2009–2012; participants aged 20–59 years who attended the MEC component, that had complete data on the oral microbiome, oral HPV infection, and key covariates of interest were included in this study (ie, complete case analysis; Figure 1).
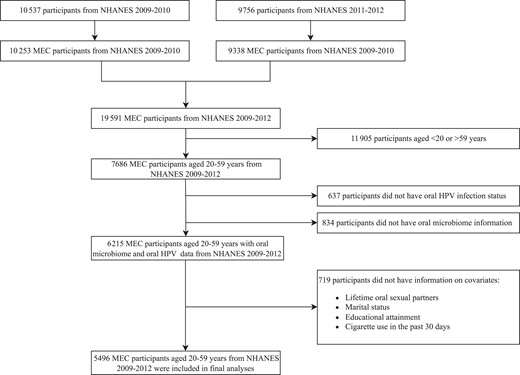
Flow chart of study population selection. We narrowed our study's population age range to 20–59 years to ensure a comprehensive evaluation of all covariates. The oral microbiome data was confined to individuals aged 14–69 years, while the accessible data on oral HPV encompassed ages 18–69 years. Data on the number of sexual partners was limited to ages 18–59 years. As for smoking status, the assessment methods differed significantly between adults over 20 years and those aged 12–19 years. Abbreviations: HPV, human papillomavirus; MEC, mobile examination centers; NHANES, National Health and Nutrition Examination Surveys.
Oral HPV Measures
The oral rinse specimens were collected in the MEC oral health room by a dental examiner from participants aged 14–69 years in NHANES cycles 2009–2010 and 2011–2012 [25]. Samples were then stored at 4°C and shipped to Ohio State University for HPV detection [11]. Polymerase chain reaction (PCR) was performed on the samples, and samples positive for ß-globin were considered of sufficient quality for genotyping. Positive samples were assayed for 37 HPV types by the Roche Linear Array HPV Genotyping Test [26]. The primary outcome was the detection of any of the 37 genotypes of oral HPV infection. Detection of any high-risk oral HPV infection (types 16, 18, 31, 33, 35, 39, 45, 51, 52, 56, 58, 59, 68, 73, or 82) and HPV-16/18 were also assessed as secondary outcomes [27].
Oral Microbiome Measures
The laboratory methods, and bioinformatics procedures for the NHANES oral microbiome data were detailed in the Oral Microbiome Data Document available on the NHANES website [28]. Oral rinse samples were processed and sequenced at the University of California Knight Laboratory, San Diego, CA. Sequencing of the V4 region of the 16S ribosomal RNA gene was conducted using DNA extracted from oral rinse samples and processed by QIIME [29, 30]. Amplicon sequence variants (ASVs) were generated by DADA2 for 10 442 samples, resulting in 41 378 ASVs [31]. All taxa without a phylum level identification (2750 operational taxonomic units) were removed from the analysis.
α- and β-diversity describe the variation of species within sample and between sample, respectively. α-diversity pertains to the diversity of the microbiome on a local scale (eg, within a person), elucidating the overall number and/or variety of species within each individual (richness and evenness). β-diversity, however, shows the dissimilarity in microbiome composition through pairwise comparisons (eg, between persons).
The α-diversity in this study included 4 metrics, with observed ASVs measuring richness, the Shannon-Weiner index and the inverse Simpson index measuring richness and evenness, and Faith's phylogenetic diversity measuring within-sample phylogenetic diversity. All measures of α-diversity were calculated using postrarefaction data (random subsampling without replacement) of 2000 to 10 000 reads per sample, replicated 10 times. In this study, we used the 10 000-read subsampled datasets and used the mean of the 10 subsamples [28]. β-diversity included 2 metrics: Bray-Curtis dissimilarity, which measures pairwise dissimilarity between microbiota using bacteria (taxonomic) counts, and UniFrac distance, which measures the phylogenetic distance between microbiota. Both unweighted and weighted UniFrac distance were calculated, with unweighted UniFrac accounting for the taxon presence and absence while weighted UniFrac incorporating taxon abundance as well.
Covariates
Variables that have been shown to be associated with oral HPV infection and may also be related to the oral microbiome were included as covariates [11, 22, 32, 33]. Self-reported sociodemographic covariates included participants' age in years, sex, race and ethnicity, educational attainment, and marital status, which were assessed during the household interview via CAPI for adults 20 years and older. Cigarette use in the past 30 days was also collected in the household interview by CAPI for adults 20 years and older. Participants’ number of lifetime oral sexual partners and same-sex behaviors were collected from the sexual behavior questionnaire using an audio-computer-assisted self-interview system. Participants’ human immunodeficiency virus (HIV) infection status was assessed using serum specimens by the synthetic peptide enzyme immunoassay.
Statistical Methods
We pooled data from the 2009–2010 and 2011–2012 NHANES cycles. NCHS-provided MEC survey weights were used to generate nationally representative estimates of the noninstitutionalized US population. To account for any bias due to item nonresponse, we further poststratified the MEC survey weights by age group, sex, race and ethnicity strata. All analyses incorporated the poststratified weights and Taylor series linearization was used to estimate variance.
Summary statistics for sociodemographic and behavioral characteristics were calculated by any oral HPV infection status, and significant differences were assessed by the Rao-Scott corrected Pearson χ2 test. The primary independent variables were the α and β measures of oral microbiome diversity. The summary statistics for α-diversity metrics were examined by demographic and behavioral factors. The prevalence of any oral HPV infection, high-risk HPV infection, and HPV-16/18 infection was calculated with Korn-Graubard 95% confidence intervals (CI). Univariable and multivariable logistic regressions were employed to characterize the association between each α-diversity measure and oral HPV infection separately. In multivariable models, we adjusted for participants’ age in years, sex, race and ethnicity, educational attainment, marital status, number of lifetime oral sexual partners, and cigarette smoking in the past 30 days. For β-diversity, the principal coordinate analyses (PCoA) of each β-diversity matrix were conducted using the wcmdscale function incorporating survey weights to visualize the distribution of the oral microbiome community by HPV infection status. Weighted multivariate analysis was performed using the fast.adonis [34] function to evaluate the variability (R2) attributed to HPV status, and its confidence interval was estimated by Bootstrap. HPV infection status was permuted (n = 1000) in weighted permutational multivariate analysis of variance (PERMANOVA) using fast. adonis to test for significant differences in the β-diversity metrics by oral HPV infection status. We further performed within-group permutations to investigate the impact of sampling weights on permutations, where all subjects were classified into 20 groups by sampling weights. Both univariable and multivariable analyses were performed, with multivariable models adjusting for participants’ age in years, sex, race and ethnicity, educational attainment, marital status, number of lifetime oral sexual partners, and cigarette smoking in the past 30 days.
Subgroup analyses were performed stratified by sex due to sex differences in the epidemiology of oral HPV infection and hypotheses regarding sex differences in the natural history of oral HPV infection [35, 36]. Sensitivity analyses were also conducted among HIV-negative participants and male participants who never had sex with men.
All P values < .05 were considered statistically significant. We did not adjust for multiple comparisons, given the hypothesis-generating design of this study. All data were analyzed using R 4.2.0 (R core team, 2022) and Stata/SE, version 15 (StataCorp).
RESULTS
Characteristics of the Study Population
There were 19 591 participants in 2009–2012 who attended the MEC (10 253 from 2009–2010 and 9338 from 2011–2012), 7686 of whom were between the ages of 20 and 59 years. Of these, 6215 had data on HPV infection status and oral microbiome α- and β-diversity at the rarefaction of 10 000. After excluding those who had missing data on key covariates, 5496 participants were included in this study, representing 165 566 408 individuals aged 20–59 years in the US population (Figure 1). Of note, female participants were more likely to be excluded than male participants (Supplementary Table 1).
Among adults aged 20–59 years in 2009–2012, the prevalence of any oral HPV infection, high-risk HPV infection, and HPV-16/18 infection was 7.2% (95% CI = 6.4%–8.1%), 3.8% (95% CI = 3.2%–4.5%), and 1.3% (95% CI = .9%–1.7%), respectively. Males had a higher prevalence of any oral HPV infection than females (11.4% vs 3.1%; Supplementary Table 2). Participants with any oral HPV were also more likely to have lower educational attainment, have more lifetime oral sex partners, and smoked more cigarettes in the past 30 days (Table 1). The average number of observed ASVs was 130 (95% CI, 127–132) in oral rinse samples. The mean of Faith's phylogenetic diversity, Shannon-Weiner index, and inverse Simpson index was 14.47 (standard deviation [SD] = 0.09), 4.61 (SD = 0.02), and 13.01 (SD = 0.15), separately. Variations in oral microbiome α-diversity were observed across different subpopulations. Generally, specific groups such as males, younger participants, those with either no or more than 10 lifetime oral sexual partners, and current smokers consuming less than 10 cigarettes daily exhibited a higher oral microbiome α-diversity (Supplementary Table 3).
Characteristics of Adults Aged 20–59 Years Included in Study Analysis, by Oral Human Papillomavirus Status, National Health and Nutrition Examination Survey 2009–2012
| Characteristics | Overall (n = 5496) | Any Oral HPV Negative (n = 5066) | Any Oral HPV Positive (n = 430) | P Valuea |
|---|---|---|---|---|
| Sex | <.001 | |||
| Male | 2781 (49.2) | 2447 (47.0) | 334 (77.9) | |
| Female | 2715 (50.8) | 2619 (53.0) | 96 (22.1) | |
| Age group, y | .025 | |||
| 20–29 | 1481 (25.3) | 1387 (25.6) | 94 (21.4) | |
| 30–39 | 1342 (23.7) | 1241 (24.0) | 101 (21.0) | |
| 40–49 | 1388 (25.9) | 1293 (26.1) | 95 (23.5) | |
| 50–59 | 1285 (25.1) | 1145 (24.4) | 140 (34.2) | |
| Race and ethnicity | .031 | |||
| Mexican American | 911 (9.6) | 846 (9.7) | 65 (8.9) | |
| Other Hispanic | 535 (6.5) | 493 (6.5) | 42 (6.7) | |
| Non-Hispanic white | 2182 (63.5) | 2021 (63.7) | 161 (61.0) | |
| Non-Hispanic black | 1239 (12.3) | 1111 (11.9) | 128 (17.5) | |
| Other race/multiracial | 629 (8.1) | 595 (8.3) | 34 (6.0) | |
| Educational attainment | .001 | |||
| Less than high school | 1198 (15.6) | 1093 (15.5) | 105 (16.9) | |
| High school or equivalent | 1210 (20.9) | 1082 (20.3) | 128 (28.5) | |
| Some college or AA degree | 1703 (31.9) | 1571 (31.8) | 132 (33.9) | |
| College graduate or above | 1385 (31.5) | 1320 (32.4) | 65 (20.7) | |
| Marital status | .102 | |||
| Never married | 1489 (24.2) | 1373 (23.9) | 116 (28.1) | |
| Married/living with partner | 3186 (61.7) | 2959 (62.3) | 227 (54.2) | |
| Widowed/divorced/separated | 821 (14.1) | 734 (13.9) | 87 (17.7) | |
| Number of lifetime oral sexual partners | <.001 | |||
| 0 | 1053 (14.0) | 1007 (14.4) | 46 (8.3) | |
| 1 | 1066 (19.7) | 1024 (20.6) | 42 (7.9) | |
| 2–5 | 2194 (41.4) | 2032 (42.1) | 162 (33.1) | |
| 6–10 | 599 (12.8) | 536 (12.5) | 63 (16.8) | |
| 11–20 | 333 (6.9) | 278 (6.1) | 55 (18.0) | |
| >20 | 251 (5.2) | 189 (4.4) | 62 (15.9) | |
| Past 30-day cigarette smoking | <.001 | |||
| Never/former | 4124 (77.0) | 3880 (78.5) | 244 (57.9) | |
| Current, < 10 cigarettes/day | 834 (13.0) | 733 (12.3) | 101 (22.2) | |
| Current, 11–20 cigarettes/day | 417 (7.6) | 354 (7.1) | 63 (14.5) | |
| Current, > 20 cigarettes/day | 121 (2.3) | 99 (2.1) | 22 (5.4) | |
| HIV status | <.001 | |||
| Negative | 5192 (99.6) | 4806 (99.7) | 386 (98.5) | |
| Positive | 34 (0.4) | 24 (0.3) | 10 (1.5) | |
| Men who have sex with men | .868 | |||
| Never | 2641 (94.9) | 2330 (94.9) | 311 (94.7) | |
| Ever | 134 (5.1) | 112 (5.1) | 22 (5.3) | |
Data are No. of observations (%). Percentages are within-column proportions applying poststratification weight.
Abbreviations: AA, associate in arts; HIV, human immunodeficiency virus; HPV, human papillomavirus.
aP values are based on the Rao-Scott adjusted Pearson χ2 tests comparing people with any oral HPV and without.
α-Diversity and Oral HPV Infection
Supplementary Figure 1 illustrates the distribution of 4 α-diversity metrics by HPV infection status. In univariable models, only the inverse Simpson index was detected to be positively associated with the infection of any oral HPV (odds ratio [OR], 1.02; 95% CI = 1.00–1.03) among the overall population (Table 2). In multivariable models, there was no significant association detected between oral microbiome α-diversity and the infection of any oral HPV, and HPV-16/18. However, a lower number of observed ASVs (adjusted odds ratio [aOR] = 0.996; 95%CI = .992–.999) and Faith's Phylogenetic Diversity (aOR = 0.95; 95% CI = .90–.99) were associated with higher odds of high-risk oral HPV infection (Table 3).
Univariable Association Between Oral Microbiome α-diversity and Oral HPV Infection Among 20–59 Year Olds, National Health and Nutrition Examination Survey, 2009–2012
| Population | Observed ASVs | Faith's Phylogenetic Diversity | Shannon-Weiner Index | Inverse Simpson Index | ||||
|---|---|---|---|---|---|---|---|---|
| OR (95% CI) | P Value | OR (95% CI) | P Value | OR (95% CI) | P Value | OR (95% CI) | P Value | |
| Any oral HPV | ||||||||
| Overall | 1.002 (.999–1.004) | .192 | 1.01 (.98–1.04) | .429 | 1.04 (.86–1.25) | .677 | 1.016 (1.001–1.031) | .034 |
| Male | .999 (.997–1.009) | .523 | .98 (.95–1.01) | .162 | 0.93 (.75–1.15) | .469 | 1.002 (.982–1.022) | .863 |
| Female | 1.004 (.999–1.009) | .093 | 1.06 (.98–1.14) | .143 | 1.05 (.68–1.62) | .826 | 1.028 (.982–1.075) | .233 |
| High-risk oral HPV | ||||||||
| Overall | 0.998 (.995–1.002) | .364 | 0.98 (.94–1.02) | .273 | 0.89 (.68–1.18) | .425 | 1.009 (.985–1.034) | .140 |
| Male | 0.996 (.993–.999) | .024 | 0.95 (.91–.98) | .004 | 0.81 (.60–1.10) | .168 | 0.997 (.968–1.027) | .815 |
| Female | 1.001 (.992–1.011) | .810 | 1.01 (.89–1.16) | .842 | 0.82 (.45–1.47) | .488 | 1.007 (.935–1.084) | .851 |
| Oral HPV-16/18 | ||||||||
| Overall | 1.002 (.994–1.009) | .633 | 1.04 (.95–1.14) | .404 | 0.91(.56–1.46) | .678 | 0.988 (.947–1.032) | .586 |
| Male | 0.999 (.990–1.007) | .780 | 1.01 (.90–1.13) | .903 | 0.78 (.46–1.33) | .353 | 0.964 (.912–1.019) | .185 |
| Female | 1.008 (.996–1.020) | .203 | 1.09 (.94–1.27) | .255 | 1.14 (.40–3.25) | .805 | 1.039 (.947–1.140) | .402 |
Values in bold are statistically significant at the P < .05 level. Abbreviations: ASVs, amplicon sequence variants; CI, confidence interval; HPV, human papillomavirus; OR, odds ratio.
Multivariable Association Between Oral Microbiome α-diversity and Oral HPV Infection Among 20–59 Year Olds, National Health and Nutrition Examination Survey, 2009–2012
| Population | Observed ASVs | Faith's Phylogenetic Diversity | Shannon-Weiner Index | Inverse Simpson Index | ||||
|---|---|---|---|---|---|---|---|---|
| aOR (95% CI) | P Value | aOR (95% CI) | P Value | aOR (95% CI) | P Value | aOR (95% CI) | P Value | |
| Any oral HPV | ||||||||
| Overall | 0.999 (.996–1.001) | .340 | 0.97 (.94–1.00) | .090 | 0.95 (.80–1.13) | .552 | 1.006 (.989–1.024) | .476 |
| Male | 0.997 (.994–1.000) | .049 | 0.95 (.92–.98) | .001 | 0.92 (.75–1.12) | .369 | 1.001 (.980–1.023) | .918 |
| Female | 1.004 (.998–1.001) | .216 | 1.05 (.96–1.14) | .284 | 1.05 (.67–1.64) | .830 | 1.024 (.976–1.074) | .332 |
| High-risk oral HPV | ||||||||
| Overall | 0.996 (.992–.999) | .046 | 0.95 (.90–.99) | .016 | 0.86 (.69–1.06) | .160 | 1.001 (.977–1.026) | .929 |
| Male | 0.995 (.991–.999) | .007 | 0.93 (.89–.97) | .001 | 0.86 (.69–1.07) | .164 | 1.001 (.976–1.028) | .911 |
| Female | 1.009 (.990–1.012) | .874 | 1.02 (.89–1.16) | .795 | 0.91 (.50–1.63) | .734 | 1.007 (.937–1.081) | .847 |
| Oral HPV-16/18 | ||||||||
| Overall | 1.001 (.993–1.009) | .816 | 1.02 (.92–1.14) | .661 | 0.93 (.57–1.52) | .774 | 0.987 (.941–1.035) | .580 |
| Male | 0.999 (.989–1.009) | .829 | 1.00 (.88–1.15) | .968 | 0.87 (.49–1.56) | .629 | 0.973 (.921–1.028) | .322 |
| Female | 1.009 (.990–1.029) | .347 | 1.10 (.85–1.35) | .371 | 1.39 (.54–3.55) | .480 | 1.050 (.967–1.140) | .234 |
Values in bold are statistically significant at the P < .05 level. Abbreviations: aOR, adjusted odds ratio; ASVs, amplicon sequence variants; CI, confidence interval; HPV, human papillomavirus.
Among males, we observed that decreasing observed ASVs and Faith's phylogenetic diversity were associated with higher odds of any oral HPV infection (aOR = 0.997, 95% CI = .994–1.000; aOR = 0.95, 95% CI = .92–.98), as well as high-risk oral HPV infection (aOR = 0.995, 95% CI = .991–.999; aOR = 0.93, 95% CI = .89–.97) There was no association detected between oral HPV infection and oral microbiome α-diversity among females (Table 3).
β-Diversity and Oral HPV Infection
In the overall population, PCoA analysis showed a shift in the microbiome community centroids when comparing each β-diversity metric by any oral HPV infection status (Figure 2). Using univariable PERMANOVA, oral microbiome β-diversity as assessed by Bray-Curtis dissimilarity, unweighted UniFrac distance, and weighted UniFrac distance all differed by any oral HPV infection and high-risk HPV infection (Supplementary Table 4). The associations were also observed among males; however, among females, only Bray-Curtis dissimilarity and unweighted UniFrac distance differed by any oral HPV infection (Supplementary Table 4 and Supplementary Figure 2).
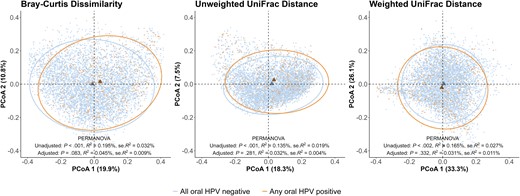
β-diversity of oral microbiome by any oral HPV infection status. The β-diversity (Bray-Curtis dissimilarity, unweighted UniFrac distance, weighted UniFrac distance) by any oral HPV infection using PCoA applying poststratification weights. Each dot represents an individual. The ellipses illustrated the 95% confidence ellipses for any oral HPV negative and positive group; the triangles represent the centroid of individuals for any oral HPV negative and positive group. PERMANOVA results adjusted for age in years, sex, race/ethnicity, educational attainment, marital status, past 30-day cigarette smoking, and number of lifetime oral sexual partners. Abbreviations: HPV, human papillomavirus; PCoA, principal coordinate analysis; PERMANOVA, permutational multivariate analysis of variance; se, standard error.
After adjusting for covariates, Bray-Curtis dissimilarity (R2 = 0.054%; P = .029) and unweighted UniFrac distance (R2 = 0.046%; P = .045) were still significantly associated with high-risk oral HPV infection in the overall population (Supplementary Table 5). Among males, significantly different Bray-Curtis dissimilarity was observed by any oral HPV infection (R2 = 0.107%; P = .025) and high-risk oral HPV infection (R2 = 0.119%; P = .008). We also observed an association between unweighted UniFrac distance and high-risk oral HPV infection (R2 = 0.117%; P = .011). There was no significant association detected between oral microbiome β-diversity and oral HPV infection among females in multivariable PERMANOVA.
Sensitivity Analyses
Analyses were repeated after excluding participants with HIV or those who had no data on HIV infection status. The negative association between Faith's phylogenetic diversity and any oral HPV or high-risk oral HPV infection persisted among male participants. The results for β-diversity were also similar to the primary analyses (Supplementary Tables 6–9 and Supplementary Figure 3). We also repeated the analyses among male participants who never had sex with men, and differences were detected in Faith's phylogenetic diversity and Bray-Curtis dissimilarity by any or high-risk HPV infection (Supplementary Tables 10–13 and Supplementary Figure 4).
DISCUSSION
The nationally representative data presented in this study demonstrated associations between the diversity of oral microbiome and oral HPV infection. A lower within-person α-diversity, as measured by the number of observed ASVs and Faith's phylogenetic diversity, was associated with any oral HPV or high-risk oral HPV infection among males in adjusted analyses. This suggests that lower richness and phylogenetic diversity of the oral microbiome may be associated with oral HPV infection, and the association differs by sex. Furthermore, the between-person β-diversity suggests that differences in oral microbiome communities may be associated with any oral HPV or high-risk HPV infection among males.
Few studies have focused on the independent association between oral microbiome diversity and oral HPV infection, and the previous findings are disparate. For example, a cohort study among 39 pregnant women in Finland found that oral HPV infection was associated with higher α-diversity, as measured by the Chao 1 index [21], while a repeat analysis of 35 infants from the same cohort found a negative association between oral microbiome richness and oral HPV infection using the samples collected 2 months after birth [20], similar to our findings from this study. Additionally, an analysis of 13 patients with OPC also found a reduced oral microbiome richness among patients having oral HPV infection [37]. In contrast to these studies with differing directions of association, recent studies of 495 adult men and women at high risk for oral HPV infection and of middle-aged men found no difference in α-diversity by any oral HPV infection [22, 38]. It is important to note that these results were either assessed among specific populations or used measures different from those in this study, which may explain the inconsistency. Also, we incorporated the phylogenetic information by Faith's phylogenetic diversity and detected a significant association.
For β-diversity, we found that by both Bray-Curtis dissimilarity and unweighted UniFrac distance, the composition of the oral microbiome community significantly differed among males with and without any or high-risk oral HPV infection. The previous study of 495 participants found a significant association between β-diversity and any oral HPV infection by Bray-Curtis dissimilarity and weighted UniFrac distance, without sex-specific analyses [22]. Additionally, our study found a significant difference in unweighted UniFrac distance by oral HPV status, which has not been shown in previous studies on the oral cavity, although it has been shown in studies of the cervicovaginal microbiome [39]. While β-diversity measures were statistically different by oral HPV infection status using PERMANOVA, the R2 were small, and the distributions of oral microbiome composition were largely overlapped in PCoA plots. One explanation could be that the large sample size of our study population provided enough power to detect small differences in oral microbiomes that are driven by the abundance of a few taxa. For example, previous studies observed that the abundance of specific bacterial families, including Actinomycetaceae, Veillonellaceae, Campylobacteraceae, and Gemellaceae in the oral cavity was associated with oral HPV infection, as well as HNSCC, but not necessarily in the same direction [22, 40, 41].
The prevalence of oral HPV infection and OPC is much higher among males, and the reasons why are still under investigation [35, 36]. Our study yielded different associations between oral microbiome α-diversity and oral HPV infection by sex. The number of observed ASVs and Faith's phylogenetic diversity exhibited a negative relationship with any or high-risk oral HPV infection solely among males, while no such association was observed among females. Similarly, we only detected the heterogeneity in β-diversity by oral HPV infection among males. Previous research has consistently reported a higher prevalence of oral HPV among males, with oral sexual behavior playing an important role in this observed difference [42]. Additionally, the composition patterns of the oral microbiome have been shown to be different by sex, but the reason remains elusive [43, 44]. Taken together, these findings are consistent with the hypothesis that the composition of the oral microbiome may mediate the natural history of oral HPV infection among males.
This study has limitations. First, limited by the publicly available data by NHANES, we could not compare the composition of the oral microbiome at the species level, which could be meaningful for identifying the association of specific species comprising the oral microbiome and oral HPV infection. Second, this study is cross-sectional, and no temporality between the oral microbiome composition and oral HPV status can be established, precluding causal conclusions. Third, residual confounding may exist by factors like oral hygiene or periodontal diseases, and the effect of cancer treatments among HPV-positive cancer patients [45]. Social desirability and recall bias regarding self-reported sexual behavior may also be a limitation. Lastly, we excluded approximately 28% of participants due to missing data on key variables, which could introduce selection bias. However, the use of poststratification weights may compensate for this concern [46].
This study also has several strengths. The present study is the largest population-based study of oral microbiome diversity and oral HPV infection. Our study assessed the estimates separately among female and male participants, which could provide clues to the different natural history of OPC by sex. In addition, several measures of α and β-diversity were leveraged in this study and could elaborate on the association between oral microbiome composition and oral HPV infection status from different perspectives.
In conclusion, the findings in this study suggest an association between oral microbiome diversity and oral HPV infection on a population level, which could lead to a greater understanding of the natural history of oral HPV infection and disease progression. Continued efforts are needed to examine the potential causal relationship, and identify specific bacterial families or pathways driving the process.
Supplementary Data
Supplementary materials are available at The Journal of Infectious Diseases online (http://jid.oxfordjournals.org/). Supplementary materials consist of data provided by the author that are published to benefit the reader. The posted materials are not copyedited. The contents of all supplementary data are the sole responsibility of the authors. Questions or messages regarding errors should be addressed to the author.
Notes
Author contributions. X. F., E. U. P., J. L. W., M. K. G., and A. A. R. T. conceived and designed the study. S. L., X. Z., J. S., N. Z., D. E. P., and C. M. L. conducted statistical methods and analysis, and verification of data. All authors participated in the interpretation of data and revising of the manuscript, and had final responsibility for the decision to submit for publication.
Acknowledgment. The authors are grateful to the study staff and participants.
Disclaimer. The conclusions reached by the authors do not represent the opinions or stances of the Centers for Disease Control and Prevention, who are only responsible for data collection. The funders had no role in study design, data collection and analysis, decision to publish, or preparation of the manuscript.
Data availability. Data are available at https://wwwn.cdc.gov/Nchs/Nhanes/omp/, https://wwwn.cdc.gov/nchs/nhanes/continuousnhanes/default.aspx?BeginYear = 2009, and https://wwwn.cdc.gov/nchs/nhanes/continuousnhanes/default.aspx?BeginYear = 2011.
Financial support. This work was supported by the National Institute of Diabetes and Digestive and Kidney Diseases (grant number R01DK131926 to A. A. R. T.); the National Institute of Allergy and Infectious Diseases (grant number T32AI102623 to E. U. P.); the National Institute on Drug Abuse (grant number F31DA054849 to E. U. P.); and the Division of Intramural Research, National Institute of Allergy and Infectious Diseases (to T. C. Q.).
References
Author notes
M. K. G. and A. A. R. T. are joint senior authors.
Potential conflicts of interest. All authors: No reported conflicts. All authors have submitted the ICMJE Form for Disclosure of Potential Conflicts of Interest. Conflicts that the editors consider relevant to the content of the manuscript have been disclosed.

