


Abstract
Socioeconomic deprivation may predispose individuals to respiratory tract infections. We estimated RSV-associated hospitalizations by socioeconomic deprivation in Scotland.
Using national routine health care records and virological surveillance from 2010 to 2016, we used a time-series linear regression model and a direct measurement based on ICD-10 coded diagnoses to estimate RSV-associated hospitalizations by Scottish Index of Multiple Deprivation (SIMD) quintile and age in comparison to influenza-associated hospitalizations.
We estimated an annual average rate per 1000 people of 0.76 (95% CI: 0.43–0.90) in the least deprived group to 1.51 (1.03–1.79) for the most deprived group using model-based approach. The rate ratio (RR) was 1.96 (1.23–3.25), 1.60 (1.0–2.66), 1.35 (0.85–2.25), and 1.12 (0.7–1.85) in the 1st to 4th quintile versus the least deprived group. The pattern of RSV-associated hospitalization rates variation with SIMD was most pronounced in children 0-2y. The ICD-10 approach provided much lower rates than the model-based approach but yielded similar RR estimates between SIMD. Influenza-associated hospitalization rate generally increased with higher deprivation levels among individuals 1y+.
Higher RSV and influenza hospitalization rates are related to higher deprivation levels. Differences between deprivation levels are most pronounced in infants and young children for RSV, and are more apparent among individuals 1y+ for influenza.
Respiratory syncytial virus (RSV) is a common cause of respiratory infections, causing substantial hospitalizations and deaths, especially in young children and older people [1, 2]. We estimated that globally in 2019 there were 33 million episodes and 3.6 million hospitalizations of RSV-associated acute lower respiratory infections in children younger than 5 years [3]. We have previously reported that there are about 245 000 [4] and 160 000 [5] RSV-associated hospitalizations annually in children under 5 years old and adults above 18 years, respectively, in the European Union plus Norway and the United Kingdom. About 75% of hospitalizations in children under 5 years occur in infants (aged below 1 year) [4], while about 92% of hospitalizations in adults occur in those above 65 years [5].
Studies suggest that socioeconomic status [6, 7] is one of the key risk factors for respiratory infections, and the higher risks are not only restricted to low-income countries but are also present in poor and disadvantaged populations within the middle- and high-income countries [8]. Lewis et al identified variations in the seasonality of bronchiolitis hospitalizations by socioeconomic level in England such that increased deprivation was found to be associated with less seasonal variation and a slightly delayed epidemic peak [9]. A study conducted in England showed that the risk of bronchiolitis hospitalization was 38% greater for infants of the most deprived socioeconomic group at peak admission week compared with the least deprived group [9]. Hungerford et al found that among adults, hospitalizations for influenza-associated illnesses were more frequent in the most socioeconomically deprived areas compared with the least deprived areas in northwest England whereas, the rates in children were more homogenous across the socioeconomic strata [10].
Understanding the burden of RSV-associated illnesses, especially severe illnesses by deprivation levels, would be useful for recommendations, guidance, and decisions on RSV immunization strategies. In this regard, we aimed to estimate the average annual number and rates of RSV-associated respiratory tract infection (RTI) hospitalizations and influenza-associated RTI hospitalizations in children and adults based on socioeconomic status using the Scottish Index of Multiple Deprivation (SIMD).
METHODS
Study Design and Population
The study design and data source have been described previously [11]. Briefly, we conducted a retrospective analysis of RSV-associated and influenza-associated RTI hospitalizations using Scottish national hospital registries during 6 consecutive epidemiological years (2010–2016). An epidemiological year included the period from week 40 of one year to week 39 of the next year. The study population included individuals hospitalized with RTI and recorded in the Scottish Morbidity Record 01 (SMR01), a Scottish national health care registry. Ethics approval to use the Scottish data was granted by Public Benefit and Privacy Panel for Health and Social Care (HSC-PBPP).
Case Definitions
As done previously [11, 12], we defined the incidence of RTI hospitalizations based on the International Classification of Diseases-10th edition (ICD-10) diagnosis codes (Supplementary Table 1). RTI hospitalization was defined as a hospital episode with any mention of RTI in the diagnosis codes either as a main or secondary diagnosis. RSV-RTI admission was RTI admission with any mention of an RSV ICD-10 diagnosis code indicating RSV either as a main or secondary diagnosis (Supplementary Table 1). Influenza-associated RTI hospitalization was RTI admission with any mention of influenza ICD-10 diagnosis code indicating influenza either as a main or secondary diagnosis (Supplementary Table 1).
Virological Surveillance Data Sources
The Electronic Communication of Surveillance in Scotland system captures laboratory results from all diagnostic and reference laboratories in Scotland. All positive RSV and influenza test results are included, although there is no denominator information on the tested population. Reliable data on RSV-positive confirmations are available from 2009 onwards [12, 13].
Scottish Index of Multiple Deprivation
The SIMD is the Scottish Government's tool for identifying the concentration of deprivation across Scotland. It is derived from a weighted score of over 30 indicators in 7 different domains, including income, employment, health, education, skills and training, geographic access to services, crime, and housing (Supplementary Table 2) [14, 15]. The SIMD is a relative measure of deprivation across 6976 small areas termed data zones. SIMD quintile was recorded in the SMR01, and each quintile consisted of 20% of the data zones from the most deprived to the least deprived level [14].
Statistical Analyses
We estimated incidence of RSV-associated and influenza-associated RTI hospitalizations using 2 approaches, that is a regression model-based approach and a direct measurement using ICD-10 diagnoses. The use of the 2 approaches allows us to understand the level of underascertainment of RSV across deprivation levels due to the lack of systematic RSV testing and poor sensitivity of RSV-specific ICD-10 codes in routine clinical care practice, and imperfect sensitivity of viral diagnostic tests.
For the model-based approach, we used a multiple linear regression model to estimate the average number of RTI hospitalizations associated with RSV (and influenza viruses) consistent with our recent analyses [11, 16, 17]. The model included a natural cubic spline function for weeks during the study period, the number of RSV-positive tests, and the number of influenza-positive tests. We considered a 0–3-week lag and/or lead for RSV and influenza in each model and tested for the optimal lag and/or lead combination for the 2 predictors simultaneously. Models were fitted separately by age group (0–2 months, 3–5 months, 6–11 months, 1–2 years, 3–4 years, 5–17 years, 18–64 years, 65–74 years, 75–84 years, and 85+ years). The goodness of fit was assessed based on an adjusted R2 and Akaike Information Criterion (AIC). We estimated the annual number and rates of RSV-associated (and influenza-associated) RTI hospitalizations based on model coefficients for RSV (and influenza), the number of RSV-positive tests (and influenza-positive tests), and Scottish population statistics by SIMD and age [18]. The 95% confidence intervals (CIs) were estimated using a 52-week–block bootstrap with 1000 replicates.
For the direct measurement approach, we estimated RSV-associated (and influenza-associated) RTI hospitalizations based on ICD-10 diagnoses, by counting hospital episodes of ICD-10 coded RSV-associated (and influenza-associated) RTI [12]. Then we estimated annual rates of RSV-associated (and influenza-associated) RTI hospitalization and 95% confidence intervals [CIs] from the Poisson distribution, based on Scottish population statistics by SIMD and age [18].
We then estimated rate ratios (RRs) of RSV-associated RTI hospitalization and the 95% uncertainty range (UR) between the SIMD levels by age group. As previously done [19], the 95% UR of RR were derived using 1000 samples from log-normal distributions of RSV-associated RTI hospitalization rates, with the 2.5th percentile and the 97.5th percentile as the lower and the upper bound.
Sensitivity Analyses
We conducted the following sensitivity analyses to assess the robustness of estimates of RSV-associated RTI hospitalization: (1) using the negative binomial regression to model the RTI hospitalization counts whilst accounting for overdispersion in data; (2) adding an interaction term between influenza-positive tests and season (2010–2011 season; other seasons) to the main models to account for potential differences in testing practices and influenza epidemiology in the 2010–2011 season compared to other seasons; and (3) adding time series of rhinovirus-positive tests to the main models to account for its potential confounding effect.
RESULTS
Regression Model-Based Estimates of RSV-Associated RTI Hospitalization
From 2010 to 2016, the weekly RSV positive tests remained steady, peaking around the same time each year, whereas weekly influenza positive tests were highest in 2010 compared to other years (Supplementary Figure 1). The weekly observed versus fitted RTI hospitalizations generally followed a similar pattern across SIMD levels. Time series of RTI hospitalizations and RSV positive tests are in Supplementary Figure 1.
Using the regression model-based approach, we estimated that the average annual number of RSV-associated RTI hospitalizations ranged from 884 for individuals of all ages in the least deprived group (fifth quintile by SIMD) to 1676 for individuals in the most deprived group (first quintile by SIMD) (Table 1). Estimates of RSV-associated RTI hospitalization rates gradually increased with levels of deprivation in individuals of all ages, with the highest rate of 1.51 (95% CI, 1.03–1.79) per 1000 in the first quintile by SIMD and lowest rate of 0.76 (95% CI, .43–.93) per 1000 in the fifth quintile. A similar pattern of RSV-associated RTI hospitalization rates with SIMD appeared to remain in most of the age groups, except in adults ≥85 years old. Across the SIMD and age groups, infants aged 0–2 months in the first SIMD had the highest RSV-associated RTI hospitalization rate of 75.77 (95% CI, 65.24–82.13) per 1000 infants per year. Details on model structures by SIMD and age groups are in Supplementary Table 3.
Model-Based Estimates of Annual Average Number and Rate of Respiratory Syncytial Virus–Associated Respiratory Tract Infection Hospital Admission During 2010–2016, by Age Group and SIMD in Scotlanda
| SIMD Quintiles | |||||
|---|---|---|---|---|---|
| 1st Quintile | 2nd Quintile | 3rd Quintile | 4th Quintile | 5th Quintile | |
| Overall | |||||
| Cases | 1676 | 1368 | 1167 | 968 | 884 |
| Rate (95% CI) | 1.51 (1.03–1.79) | 1.22 (.68–1.52) | 1.06 (.72–1.26) | 0.86 (.55–1.02) | 0.76 (.43–.9) |
| 0–2 mo | |||||
| Cases | 270 | 185 | 147 | 140 | 115 |
| Rate (95% CI) | 75.77 (65.24–82.13) | 60.07 (49.81–66.99) | 56.37 (47.07–62.47) | 52.37 (45.74–56.84) | 42.39 (33.54–46.85) |
| 3–5 mo | |||||
| Cases | 203 | 151 | 122 | 97 | 73 |
| Rate (95% CI) | 56.13 (47.83–62.25) | 49.8 (36.88–57.41) | 46.84 (40.28–51.01) | 36.56 (31.93–42.08) | 27.2 (22.9–30.16) |
| 6–11 mo | |||||
| Cases | 211 | 156 | 116 | 123 | 93 |
| Rate (95% CI) | 29.49 (23.63–33.73) | 25.73 (18.97–31.03) | 21.29 (10.89–25.43) | 22.85 (17.01–26.77) | 17.24 (13.74–19.51) |
| 1–2 y | |||||
| Cases | 327 | 222 | 184 | 177 | 164 |
| Rate (95% CI) | 11.56 (7.82–13.45) | 9.11 (6.1–10.81) | 8.34 (5.44–9.93) | 7.6 (5.02–10.05) | 7.07 (3.64–9.09) |
| 3–4 y | |||||
| Cases | 78 | 94 | 61 | 45 | 43 |
| Rate (95% CI) | 2.63 (.73–3.86) | 3.8(1.97–4.78) | 2.65 (.98–3.23) | 1.82 (.7–2.82) | 1.72 (.72–2.38) |
| 5–17 y | |||||
| Cases | 84 | 53 | 63 | 55 | 59 |
| Rate (95% CI) | 0.53 (.27–.75) | 0.31(.09–.46) | 0.44 (.27–.57) | 0.35 (.15–.48) | 0.33 (.17–.45) |
| 18–64 y | |||||
| Cases | 158 | 151 | 158 | 86 | 86 |
| Rate (95% CI) | 0.21 (−.02 to .36) | 0.21(.09–.32) | 0.24(.11–.36) | 0.11(.01–.22) | 0.12 (.06–.18) |
| 65–74 y | |||||
| Cases | 108 | 120 | 90 | 85 | 78 |
| Rate (95% CI) | 1.17 (.45–1.78) | 1.08 (.58–1.42) | 0.79 (.24–1.09) | 0.71 (.25–.97) | 0.7 (.3–.9) |
| 75–84 y | |||||
| Cases | 258 | 212 | 199 | 150 | 131 |
| Rate (95% CI) | 4.15 (2.37–5.35) | 2.94 (.98–4.11) | 2.84(1.74–3.46) | 2.21 (.96–2.72) | 1.92 (.92–2.47) |
| 85 y+ | |||||
| Cases | 162 | 208 | 155 | 167 | 200 |
| Rate (95% CI) | 7.07 (1.6–9.86) | 8.06(4.71–10.68) | 5.52 (1.43–7.84) | 6.78 (2.44–8.9) | 8.22 (4.92–10.42) |
Abbreviations: CI, confidence interval; SIMD, Scottish Index of Multiple Deprivation.
aThe SIMD is derived based on 7 different domains, including income, employment, health, education, skills and training, geographic access to services, crime, and housing, with the fifth quintile indicating the least deprived groups in Scotland.
Estimates of ICD-10 Coded RSV-Associated RTI Hospitalization
We found a lower average annual number and rate of ICD-10 coded RSV-associated RTI hospitalizations compared to the model-based estimates, across SIMD and age groups (Table 1 and Table 2). Similar to the model-based estimates, RSV-RTI hospitalization estimates based on ICD-10 diagnoses generally increased with levels of deprivation. As shown in Table 2, we estimated that the average annual number of RSV-coded RTI hospitalizations ranged from 242 for individuals of all ages in the fifth quintile of SIMD to 498 for individuals in the first quintile of SIMD. Individuals in the first quintile and fifth quintile of SIMD had the highest and lowest RSV-coded RTI hospitalization rate, at 0.47 (95% CI, .46–.49) and 0.22 (95% CI, .21–.23) per 1000. By age groups, a similar decreasing pattern of RSV-associated RTI hospitalization rates with SIMD was mainly seen in children under 2 years old. Estimates of RSV-associated RTI hospitalizations in children above 5 years old were mostly too low to allow for comparison, roughly between 0.01 and 0.07 (95% CI, .04–.13) per 1000. Using this approach, infants aged 0–2 months in the first quintile of SIMD, among all the SIMD and age groups, had the highest RSV-associated RTI hospitalization rate of 45.79 (95% CI, 42.96–48.77) per 1000 per year.
Estimates of Annual Average Number and Rate of ICD-10 Coded Respiratory Syncytial Virus–Associated Respiratory Tract Infection Hospital Admission During 2010–2016, by Age Group and SIMD in Scotlanda
| SIMD Quintiles | |||||
|---|---|---|---|---|---|
| 1st Quintile | 2nd Quintile | 3rd Quintile | 4th Quintile | 5th Quintile | |
| Overall | |||||
| Cases | 498 | 378 | 304 | 290 | 242 |
| Rate (95% CI) | 0.47 (.46–.49) | 0.36 (.34–.37) | 0.29 (.27–.3) | 0.27 (.26–.28) | 0.22 (.21–.23) |
| 0–2 mo | |||||
| Cases | 162 | 120 | 98 | 91 | 72 |
| Rate (95% CI) | 45.79 (42.96–48.77) | 40.03 (37.16–43.07) | 37.29 (34.33–40.43) | 34.6 (31.76–37.62) | 27.65 (25.1–30.38) |
| 3–5 mo | |||||
| Cases | 110 | 87 | 66 | 52 | 42 |
| Rate (95% CI) | 30.98 (28.66–33.45) | 29.06 (26.62–31.67) | 25.01 (22.59–27.6) | 19.76 (17.63–22.07) | 15.94 (14.02–18.04) |
| 6–11 mo | |||||
| Cases | 103 | 77 | 63 | 62 | 52 |
| Rate (95% CI) | 14.62 (13.49–15.82) | 12.81 (11.66–14.03) | 12.03(10.84–13.3) | 11.81 (10.64–13.06) | 10.05 (8.97–11.22) |
| 1–2 y | |||||
| Cases | 102 | 75 | 59 | 67 | 60 |
| Rate (95% CI) | 3.66 (3.38–3.96) | 3.14 (2.86–3.45) | 2.79 (2.51–3.09) | 3.06 (2.77–3.38) | 2.73 (2.46–3.03) |
| 3–4 y | |||||
| Cases | 7 | 6 | 5 | 6 | 7 |
| Rate (95% CI) | 0.24 (.17–.33) | 0.25 (.17–.35) | 0.24 (.16–.34) | 0.28 (.19–.38) | 0.31 (.23–.42) |
| 5–17 y | |||||
| Cases | 4 | 4 | 5 | 3 | 2 |
| Rate (95% CI) | 0.02 (.01–.04) | 0.03 (.02–.04) | 0.04 (.03–.05) | 0.02 (.01–.03) | 0.01 (.01–.02) |
| 18–64 y | |||||
| Cases | 6 | 5 | 4 | 4 | 3 |
| Rate (95% CI) | 0.01 (.01–.01) | 0.01 (0–.01) | 0.01 (0–.01) | 0.01 (0–.01) | 0 (0–.01) |
| 65–74 y | |||||
| Cases | 2 | 2 | 2 | 2 | 2 |
| Rate (95% CI) | 0.02 (.01–.04) | 0.02 (.01–.04) | 0.02 (.01–.03) | 0.02 (.01–.04) | 0.02 (.01–.03) |
| 75–84 y | |||||
| Cases | 3 | 3 | 2 | 2 | 2 |
| Rate (95% CI) | 0.04 (.02–.07) | 0.05 (.03–.07) | 0.03 (.02–.05) | 0.03 (.02–.06) | 0.03 (.01–.05) |
| 85 y+ | |||||
| Cases | 0 | 1 | 2 | 1 | 2 |
| Rate (95% CI) | 0.02 (0–.06) | 0.03 (.01–.07) | 0.07 (.03–.13) | 0.05 (.02–.11) | 0.07 (.04–.13) |
Abbreviations: CI, confidence interval; ICD-10, International Classification of Diseases-Tenth Revision; SIMD, Scottish Index of Multiple Deprivation.
aThe SIMD is derived based on 7 different domains, including income, employment, health, education, skills and training, geographic access to services, crime, and housing, with the fifth quintile indicating the least deprived groups in Scotland.
Estimates of Influenza-Associated RTI Hospitalization by SIMD and Age Group
Among infants aged <1 year, there are substantial uncertainties around the estimates of influenza-associated RTI hospitalization rates, and the pattern of influenza hospitalization rate with SIMD was less apparent than for RSV; infants in the fifth quintile had a lower influenza hospitalization rate compared with other SIMD quintiles. For children aged 1–2 years and older and adults, the influenza-associated RTI hospitalization rate generally increased with rising deprivation level, and was highest among those in the first quintile of SIMD (Supplementary Table 4). Across the SIMD quintiles, influenza hospitalization rates were higher among adults aged 85 years and older and infants.
The Ratio of RSV-RTI Hospitalization Rates Between SIMD by Age Group
The two approaches, that is, ICD-10-based and model-based approach, generally yielded comparable RRs of RSV-RTI hospitalizations between SIMD levels, except in individuals aged 5–17 years and ≥85 years (Figure 1). Compared to the fifth quintile of SIMD, the RR estimates showed an increasing pattern with higher deprivation levels in individuals of all ages (Figure 1 and Supplementary Table 5). In detail, the RR was 2.13 (95% CI, 2.0–2.29), 1.62 (95% CI, 1.52–1.74), 1.29 (95% CI, 1.21–1.39), and 1.22 (95% CI, 1.15–1.32) in the first to fourth quintile of SIMD based on the ICD-10 approach, and 1.96 (95% CI, 1.23–3.25), 1.60 (95% CI, 1.0–2.66), 1.35 (95% CI, .85–2.25), and 1.12 (95% CI, .7–1.85) using the model-based approach. By age groups, the RR for the first quintile of SIMD (the most deprived) ranged from 0.24 (95% CI, .10–.60) in adults aged ≥85 years to 2.33 (95% CI, 1.22–4.69) in adults aged 18–64 years based on the ICD-10 approach (Supplementary Table 5). The RR for the first quintile of SIMD ranged from 0.96 (95% CI, .60–1.62) in adults aged ≥85 years to 2.08 (95% CI, 1.11–4.13) in adults aged 75–84 years (Supplementary Table 5) using the model-based approach. Using the 2 approaches, we found apparent increasing patterns in RR estimates with higher deprivation levels in children aged 2 years and younger (Figure 1). By contrast, based on the 2 approaches the RR estimates by SIMD overlapped 1 on most of the occasions and were close to 1 (either above or below 1) on several occasions in people 3–84 years old, suggesting no apparent patterns associated with SIMD in these age groups. Lastly, the RR in adults aged ≥85 years was 0.24 (95% CI, .1–.6) and 0.4 (95% CI, .17–1.0) in the first and second quintile of SIMD by the ICD-10 approach, while it overlapped 1 using the model-based approach (Supplementary Table 6).
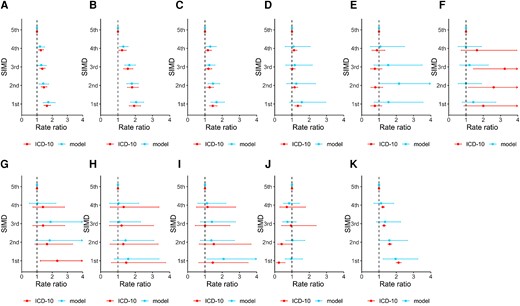
Ratio of RSV-RTI hospitalization rates between SIMD quintiles, by age group. Panels show rate ratios of population of other SIMD levels compared with the least deprived (ie, fifth quintile of SIMD) by age group, that is, 0–2 mo (A), 3–5 mo (B), 6–11 mo (C), 1–2 y (D), 3–4 y (E), 5–17 y (F), 18–64 y (G), 65–74 y (H), 75–84 y (I), ≥ 85 y (J), and all the population (K). Abbreviations: ICD-10, International Classification of Diseases-10th edition; SIMD, Scottish Index of Multiple Deprivation.
Sensitivity Analyses
Estimates from all the sensitivity analyses are presented in Supplementary Table 6. In general, rates of RSV-RTI hospitalizations were comparable across SIMD levels when considering the main models and the sensitivity analyses. The use of negative binomial regression model and addition of rhinovirus yielded slightly higher AIC values with a difference between 6 and 40 compared with the main analyses, suggesting a better model fit of the main models.
DISCUSSION
Using 2 approaches on data from the Scottish national health care data and virological surveillance, we found that the rate of RSV-associated hospitalization was generally higher among individuals in the most deprived groups (first quintile) compared to the least deprived groups (fifth quintile) in Scotland. In the general population, we found the highest average annual number of RSV-associated RTI hospitalization and rate of admission in individuals in the most deprived group. The rate of RSV-associated RTI hospitalization in the most deprived group was about twice as high as the rate of admission in the least deprived group. The differences in hospitalization rates were most pronounced in infants and children aged 1–2 years. Our analysis found that the rates of RSV-associated hospitalization in children younger than 1 year were up to about twice as high in the most deprived groups compared to the least deprived groups. This observation could be related to previously reported risk factors for respiratory infection transmission—family size, crowding, smoking, exposure to industrial pollutants, and inadequate hygiene that are more prevalent among socioeconomically deprived groups [9, 20, 21]. When considering the model-based and ICD-10 RR estimates of RSV-associated RTI hospitalization, we observed a consistently higher risk of admission for children aged 0–2 years in the most deprived groups compared to the least deprived group, while the RR remained similar across the SIMD levels for children aged 3–4 years.
The relationship with deprivation level was strongest in infants and to a lesser extent young children 1–2 years of age. In contrast, the patterns of RSV-associated RTI hospitalization rates with SIMD in older children and adults showed a similar trend but this was less clear. There was no relationship observed in the oldest age group of those ≥85 years of age. Possible explanations for this may be age-group specific and may include for instance relatively small numbers and rates of RSV-associated RTI hospitalizations and confounding effects of other factors distributed between SIMD for 3–4 years old. In adults aged ≥85 years, differences by diagnosis and coding practice between SIMD, and confounding effect of other factors distributed between SIMD may explain this as we estimated RR of 2.0 (95% CI, .88–4.84) in the first quintile of SIMD compared with the fifth quintile of SIMD using the ICD-10 approach.
However, the highest average annual number of RSV-associated RTI hospitalizations (258 cases) in the adult population was seen among those aged 75–84 years in the most deprived group. In the adult age groups in general, although the admission rates varied minimally across the SIMD levels, no large variations were observed suggesting that age, in addition to deprivation level, is a significant determinant of RSV-associated RTI hospitalizations. In the elderly, other coexisting risk factors such as chronic medical conditions may play a more critical role in the risk profiles for RSV hospitalizations.
We observed that similar to RSV, the variation pattern of influenza-associated RTI hospitalization generally increased with deprivation levels among most age groups except in infants. The variation pattern of influenza-associated RTI hospitalization with SIMD were less apparent compared with RSV among infants (Supplementary Table 4). This may be partly related to the substantially lower hospitalization rate and larger uncertainties around the rate estimates of influenza compared with RSV among infants, which made it more difficult to detect differences among deprivation groups. Among adults, the rates of influenza-associated hospitalization were higher in those aged ≥85 years in the most deprived group. Our study period included the 2009 H1N1 pandemic where influenza-associated RTI hospitalizations were potentially disproportionately higher in the less deprived individuals and groups.
Previous research reports that low social class was one of the factors associated with the risk of hospitalization in children with bronchiolitis [22], and children from lower socioeconomic groups were at increased risk of admission to pediatric intensive care for bronchiolitis [23]. Studies suggest that the transmission of RSV may differ due to socially patterned risk factors such as residential overcrowding and family characteristics, which may lead to different patterns of hospitalizations [20, 21].
The SIMD measure is widely used to describe and assess Scottish small-area concentrations of deprivation; however, reports suggest that individuals in certain areas could be missed [24, 25]. For instance, individuals experiencing deprivation may be more dispersed in rural areas, which may lead to greater heterogeneity in this population. The SIMD tends to privilege urban areas of deprivation compared to deprived individuals in more rural areas [24]. It is more sensitive to detecting income and employment-deprived individuals in urban areas compared to remote and rural areas and island local authorities [25]. The percentage of income and employment-deprived individuals missed by the SIMD is greater in remote and rural areas; however, the absolute number of people missed is higher in urban areas due to higher deprivation levels [25].
In this study, we did not have access to the subdomains to explore which domains contribute to the effects we observed. The lower estimates from the ICD-10 direct measurement approach compared to the modelling approach may be explained by the limitations of using ICD-10 codes without laboratory confirmation in respiratory disease classification/diagnosis, especially in adults. This has been also shown in a previous study that emphasized ICD coding insufficiency to enable direct estimation of RSV disease burden [26].
Our study highlights the burden of RSV-associated hospitalization in the overall population and by age group across SIMD levels and demonstrates that children in the most deprived groups may be suffering a higher burden of RSV hospitalizations. It further shows that RSV hospitalization in older adults across deprivation levels may be similar. In addition to the age-specific vulnerability of RSV hospitalization for young children, being in a deprived group may present higher risks of RSV-associated RTI hospitalization. Our study highlights the need to target children in low socioeconomic groups or in the most deprived groups for any future prevention strategies and interventions, especially as RSV vaccines become available. Our results are based on data in a period prior to the coronavirus disease 2019 (COVID-19) pandemic, and how the epidemiology of RSV has changed recently, especially after the COVID-19 pandemic, merits further investigation. We recognize that the inclusion of other countries in our analysis would strengthen our results and make them more generalizable. Despite the potential study limitations, our study highlights the RSV burden in comparison to influenza in a less explored area that may provide relevant evidence for health policy decision making.
CONCLUSION
Our analysis focused on estimating RSV and influenza-associated hospitalization in children and adults based on socioeconomic status using SIMD levels in Scotland. Our results show that RSV hospitalization rates are about twice as much in groups that are most deprived compared to the least deprived group in Scotland. We observed that the deprivation-related disparity in RSV hospitalization rates were more pronounced in children aged 2 years and younger than in other age groups. These results underscore the need to create more awareness of RSV-associated hospitalization among individuals in deprived groups and areas at various levels in the hospital/clinical setup, and it may also be useful to consider this as part of the triage and/or treatment strategy. The results also highlight the importance of prioritizing individuals in deprived areas for future interventions and RSV prevention strategies.
Supplementary Data
Supplementary materials are available at The Journal of Infectious Diseases online. Consisting of data provided by the authors to benefit the reader, the posted materials are not copyedited and are the sole responsibility of the authors, so questions or comments should be addressed to the corresponding author.
Notes
PROMISE investigators. Harish Nair (University of Edinburgh), Hanna Nohynek (Finnish Institute for Health and Welfare, THL), Terho Heikkinen (University of Turku and Turku University Hospital), Anne Teirlinck (Rijksinstituut voor Volksgezondheid en Milieu (National Institute for Public Health and the Environment), RIVM), Louis Bont (University Medical Center Utrecht), Philippe Beutels (University of Antwerp), Peter Openshaw (Imperial College, London), Andrew Pollard (University of Oxford), Alexandro Orrico Sánchez (The Foundation for the Promotion of Health and Biomedical Research of Valencia Region, FISABIO), Veena Kumar (Novavax), Tin Tin Htar (Pfizer), Charlotte Vernhes (Sanofi Pasteur), Gael Dos Santos (GlaxoSmithKline), Jeroen Aerssens (Janssen), Rolf Kramer (Sanofi Pasteur), and Nuria Manchin (TEAMIT Research).
Acknowledgments. We acknowledge the support of the electronic data research and innovation services team at Public Health Scotland for their involvement in obtaining approvals, provisioning, and linking, and the use of the secure analytical platform with the National Safe Haven.
Disclaimer. This article only reflects the authors’ view and the Joint Undertaking is not responsible for any use that may be made of the information it contains herein.
Financial support. This work was supported, as part of PROMISE, by the Innovative Medicines Initiative 2 Joint Undertaking, which receives support from the European Union Horizon 2020 Research and Innovation Programme and European Federation of Pharmaceutical Industries and Associations (grant number 101034339); and Nanjing Medical University Talents Start-up Grants (grant number NMUR20210009).
Supplement sponsorship. This article appears as part of the supplement “Preparing Europe for Introduction of Immunization Against RSV: Bridging the Evidence and Policy Gap.”
References
Author notes
R. O. Y. and F. Z. contributed equally.
Potential conflicts of interest. H. C. reports grants, personal fees, and nonfinancial support from the World Health Organization (WHO); grants and personal fees from Sanofi Pasteur; grants from Bill and Melinda Gates Foundation, outside this work; and is a shareholder in the Journal of Global Health, Ltd. H. N. reports grants from Pfizer and Icosavax; consulting fees from WHO, Pfizer, Bill and Melinda Gates Foundation, Abbvie, and Sanofi, outside this work; and participation on a data safety monitoring board or advisory board of GSK, Sanofi, Merck, WHO, Janssen, Novavax, Resvinet, Icosavax, and Pfizer. X. W. reports grants from GlaxoSmithKline; and consultancy fees from Pfizer, outside the submitted work. All other authors report no potential conflicts.
All authors have submitted the ICMJE Form for Disclosure of Potential Conflicts of Interest. Conflicts that the editors consider relevant to the content of the manuscript have been disclosed.

