


Abstract
We aimed to estimate vaccine effectiveness against infection (VE-infection) and against further transmission (VE-infectiousness) in a household setting during Delta and Omicron. Knowing these effects can aid policy makers in deciding which groups to prioritize for vaccination.
Participants with a positive severe acute respiratory syndrome coronavirus 2 (SARS-CoV-2) test were asked about coronavirus disease 2019 (COVID-19) vaccination status and SARS-CoV-2 testing of their household members 1 month later. VE-infection and VE-infectiousness were estimated using generalized estimating equation logistic regression adjusting for age, vaccination status, calendar week, and household size.
A total of 3399 questionnaires concerning 4105 household members were included. During the Delta period, VE-infection and VE-infectiousness of primary series were 47% (95% confidence interval [CI], −27% to 78%) and 70% (95% CI, 28% to 87%), respectively. During the Omicron period, VE-infection was −36% (95% CI, −88% to 1%) for primary series and −28% (95% CI, −77% to 7%) for booster vaccination. VE-infectiousness was 45% (95% CI, −14% to 74%) for primary series and 64% (95% CI, 31% to 82%) for booster vaccination.
Our study shows that COVID-19 vaccination is effective against infection with SARS-CoV-2 Delta and against infectiousness of SARS-CoV-2 Delta and Omicron. Estimation of VE against infection with SARS-CoV-2 Omicron was limited by several factors. Our results support booster vaccination for those in close contact with vulnerable people to prevent transmission.
Coronavirus disease 2019 (COVID-19) vaccines may contribute to controlling severe acute respiratory syndrome coronavirus 2 (SARS-CoV-2) infections by reducing the susceptibility of an individual of becoming infected and/or by reducing the infectiousness when a vaccinated individual is infected. The reduction in susceptibility afforded by vaccines is referred to as the vaccine effectiveness against infection (VE-infection), and the reduction in infectiousness of an individual once infected as vaccine effectiveness against infectiousness (VE-infectiousness) [1]. In many studies it is difficult to determine VE-infectiousness. Household studies have proven to be excellent tools to study VE against both infection and infectiousness. For policy makers, both VE-infection and VE-infectiousness are relevant. If vaccines only prevent infections through reducing susceptibility, then vaccination of only vulnerable populations such as the elderly or medical risk groups may suffice. However, if vaccines also prevent onward transmission (when infected) by reducing infectiousness, then population-wide vaccination or extending the target group for vaccination, for example to healthcare workers, can have added value to protect those who remain at high risk of severe disease.
The effectiveness of COVID-19 vaccines against infection has been investigated extensively. It has been shown that vaccination substantially reduces the risk of SARS-CoV-2 infections, although the effect differs by variant of concern and protection decreases with increasing time since vaccination [2, 3]. After its emergence in late 2020, the SARS-CoV-2 Delta variant showed increased transmissibility compared to previous variants and quickly became the dominant variant worldwide. The more recent Omicron subvariants are even more transmissible. Recent data have shown that COVID-19 vaccines can reduce the onward transmission of Omicron by infected individuals [4]. It has also been reported that the infectiousness of Omicron is higher than Delta, regardless of vaccination status [5, 6].
In this study we assess the VE-infection and VE-infectiousness of the SARS-CoV-2 Delta and Omicron variants for vaccines authorized in the Netherlands during the second half of 2021 and the first half of 2022.
METHODS
Study Design
VASCO (Vaccine Study COVID-19) is a prospective cohort study of approximately 45 000 community-dwelling Dutch adults between 18 and 85 years of age, which aims to estimate long-term effectiveness of COVID-19 vaccines that have been used in the Dutch national COVID-19 vaccination program [7]. Enrollment of participants took place between 3 May 2021 and 15 December 2021 and participants are followed for 5 years. Participants are followed with monthly questionnaires for COVID-19 vaccination and self-reported positive SARS-CoV-2 tests, and fingerprick samples were requested at baseline and at 6 months and 12 months of follow-up. Participants can report a positive SARS-CoV-2 test (polymerase chain reaction [PCR] or [self-administered] antigen test) directly in a mobile phone application designed for the study, including date and type of test. The study provided antigen self-tests to participants free of charge from April 2022 onward because from that date onward, national test centers no longer offered testing free of charge to the general public. From the end of August 2021, participants who reported a positive SARS-CoV-2 test were asked 1 month after the positive test date to complete an additional questionnaire about their household members. Household member data included age; whether or not they were tested for SARS-CoV-2 in the window period (2 weeks before to 4 weeks after the positive test of the VASCO participant); the date of the test; the result of the test (positive or negative); and the number, dates, and types of COVID-19 vaccinations received. The participant was asked whether the household members gave verbal permission for reporting their data.
Study Period
The study period started on 23 July 2021, which was the date of the first infection of 1 of the participants for which a questionnaire on household members was completed, and ended on 7 August 2022 when the last infection in the household substudy was reported. The study period therefore included the time periods in which the Delta variant and the Omicron BA.1, BA.2, BA.4, and BA.5 subvariants were dominant in the Netherlands [8]. A variant was considered dominant if >90% of the SARS-CoV-2 samples that were sequenced as part of the national pathogen surveillance program detected that variant. The Delta-dominant period was from the start of the study period until 18 December 2021. The Omicron-dominant period was from 11 January 2022 until the end of the study period. The BA1, BA2, and BA4/BA5 subvariant–dominant periods were 9 January–31 January 2022, 20 March–16 May 2022, and 27 June 2022 to the end of the study period, respectively.
Inclusion and Exclusion Criteria
Only households in which the VASCO participant was the index case were included in the current analysis, defined as the participant being the first in the household to test positive according to the questionnaire. Households were excluded if the index case had a previous positive SARS-CoV-2 test before the index case date or if antibodies against the SARS-CoV-2 nucleocapsid protein (anti-N) were present in any blood sample before the index case date. The index case date was defined as the reported date of the positive SARS-CoV-2 test (PCR or antigen [self-]test). Households with co-primary cases (defined as index and household members who tested positive within 1 day) were excluded from the analysis since an index could not be defined. Households in which at least 1 member did not give permission for sharing their data were excluded from the analysis. Household members who did not do a SARS-CoV-2 test in the window period were excluded from the analysis. Information on previous infections from household members was unavailable. A secondary case was defined as a household member who was reported to have had a positive test for SARS-CoV-2 within 2–14 days after the index case date.
Vaccination Status
Vaccination status was determined for both index cases as well as household members on the index case date based on self-reported data. For index cases, additional information on vaccinations until March 2022 was available from the national vaccination register (COVID-vaccination Information and Monitoring System [CIMS]). In the Netherlands, informed consent of the vaccinee is required for a COVID-19 vaccination to be registered in CIMS; this registry is therefore incomplete. Vaccination data from the registry was used, except when no informed consent was given for registration of any of the received vaccines in CIMS or no consent was given for linking study data with CIMS data. If only part of the vaccination data was available in CIMS and/or self-reported, data were combined [9]. A person was considered unvaccinated if no vaccine was registered or reported. A person was considered vaccinated with a primary series if a second dose of Comirnaty (BNT162b2, BioNTech/Pfizer), Spikevax (mRNA-1273, Moderna), or Vaxzevria (ChAdOx1-S, AstraZeneca) was received at least 14 days before the index case date or if a first dose of Jcovden (Ad26.COV2-S [recombinant], Janssen-Cilag) was received at least 28 days before the index case date. A person was considered to be vaccinated with a first booster if a third dose of Comirnaty, Spikevax, or Vaxzevria was received at least 7 days before the index case date. A third dose administered before the start of the booster campaign (18 November 2021) was considered an additional primary series vaccination and was only offered to persons with a severe immunodeficiency; thus, such doses were not considered booster doses. If a person was vaccinated with Jcovden and received a second dose >90 days after the first dose, then this person was considered to be vaccinated with a first booster if the second dose was received at least 7 days before the index case date. The vaccination status for the second booster was the same as for the first booster with an additional vaccination. Index cases or household members who had a vaccination status other than unvaccinated, primary series, or boosted were excluded.
Serology
Fingerprick samples were analyzed with the Elecsys anti-N assays on the Cobas e801 (Roche Diagnostics), which are electrochemiluminescence immunoassays measuring immunoglobulin levels against the SARS-CoV-2 nucleocapsid protein (anti-N antibodies). The qualitative cutoff index was converted to numeric results in Binding Antibody Units (BAU)/mL using batch-specific, linear calibration lines obtained with a dilution range of the National Institute for Biological Standards and Control 20/136 World Health Organization standard. The cutoff for anti-N positivity was set by converting cutoff index 1.0 to corresponding BAU/mL using these calibration lines.
Data Analysis
Characteristics of index cases and household members are presented with frequencies and percentages. The time to secondary infection is calculated as the difference between positive test date of the index and the household member and reported as median and interquartile range (IQR). Secondary attack rates (SARs) are calculated as the proportion of household members who test positive for SARS-CoV-2 after the index case date. SARs are stratified by vaccination status and SARS-CoV-2 variant and compared using χ2 tests. VE-infection during the Delta- and Omicron-dominant periods was estimated using logistic regression with and without adjustment for the age group of the household member (0–17, 18–39, 40–59, ≥60), the age group of the index case (18–39, 40–59, 60–85), calendar week as a categorical variable, vaccination status of the index, and household size. VE-infectiousness during the Delta and Omicron periods was estimated using logistic regression with and without adjustment for age group of the index case (18–39, 40–59, 60–85), age group of the household member (0–17, 18–39, 40–59, ≥60), vaccination status of the household member, calendar week as categorical variable, and household size. Generalized estimating equation models with exchangeable correlation structure were used to account for dependencies within the household. In a sensitivity analysis, we stratified vaccination status based on time since vaccination (<90 days and ≥90 days). In a further sensitivity analysis, households with index cases with a prior infection were included in the analysis to evaluate the impact of prior infection on VE-infectiousness. A third sensitivity analysis explored the impact of age on VE-infection and VE-infectiousness by excluding all household members aged <18 years, since people under 18 are often less vaccinated. In a fourth sensitivity analysis, we reduced the time window for testing of household members to 7 days instead of 14. The results of the sensitivity analyses are presented in the Supplementary Data. All data processing and statistical analyses were done in R version 4.0.2 using package geepack for the VE analyses.
Ethical Statement
The VASCO study protocol was approved by the not-for-profit independent medical ethics committee of the Stichting Beoordeling Ethiek Biomedisch Onderzoek, Assen, the Netherlands (NL76815.056.21) [7]. Written informed consent was obtained from all participants prior to enrollment into the study [7]. The participant should indicate for each household member whether or not they gave permission for sharing of their data. Further details on data management, privacy, and ethics regarding the VASCO study are described by Huiberts et al [7].
RESULTS
For infections reported between 23 July 2021 and 7 August 2022, 13 129 household questionnaires were completed by VASCO participants. Of these, 3399 questionnaires (25.9%) concerning 4105 household members were included in the analysis (Figure 1). The characteristics of index cases and household members are presented in Table 1. The median age of index cases was 61 years (range, 18–85 years). At the index case date, 2% of the index cases were unvaccinated, 10% had completed a primary vaccination series, 76% had received a first booster, and 12% had received a second booster. A total of 4105 household members were included with a median age of 58 years (range, 0–93 years). At the index case date, 11% of the household members was unvaccinated, 25% had completed a primary vaccination series, 55% had received a first booster, and 9% had received a second booster. The median time to secondary infection was 4.5 days (IQR, 3–6 days) during the Delta period and 4.0 days (IQR, 3–6 days) during the Omicron period (Figure 2). The proportion of household members who tested fluctuated per month, with 75%–100% during Delta period and 75%–88% during Omicron period.
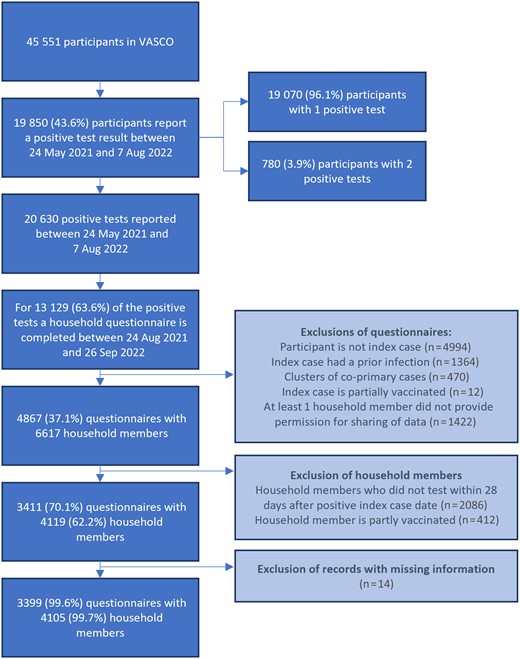
Inclusion and exclusion of questionnaires and household members. Abbreviation: VASCO, Vaccine Study COVID-19.
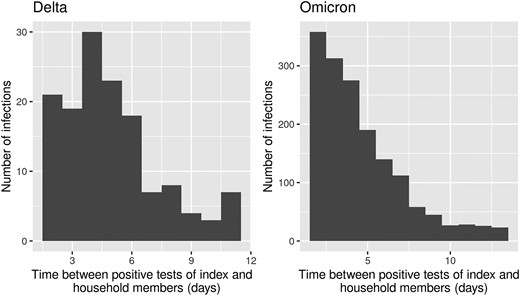
Distribution of time to secondary infection within contributing households.
Characteristics of Index Cases and Household Members
| Characteristic | Index Cases | Household Members |
|---|---|---|
| (n = 3399) | (n = 4105) | |
| Age group, y | ||
| Median (IQR) | 61 (51–65) | 58 (34–65) |
| 0–17 | … | 522 (13) |
| 18–39 | 423 (12) | 656 (16) |
| 40–59 | 1112 (33) | 1023 (25) |
| ≥60 | 1864 (55) | 1904 (46) |
| Sex | ||
| Male | 1304 (38) | NA |
| Female | 2093 (62) | NA |
| Other | 2 (0) | NA |
| COVID-19 vaccination status at index case date | ||
| Not vaccinated | 57 (2) | 464 (11) |
| Primary series | 328 (10) | 1029 (25) |
| Booster 1 | 2593 (76) | 2246 (55) |
| Booster 2 | 421 (12) | 366 (9) |
| COVID-19 case status | ||
| Yes | 3399 (100) | 1802 (44) |
| No | 0 (0) | 2300 (56) |
| Unknown | 0 (0) | 3 (0) |
| No. of household members | ||
| 1 | 2591 (76) | 2591 (63) |
| 2 | 401 (12) | 616 (15) |
| 3 | 316 (9) | 654 (16) |
| 4 | 82 (2) | 206 (5) |
| 5 | 8 (0) | 32 (1) |
| 6 | 1 (0) | 6 (0) |
Data are presented as No. (column %).
Abbreviations: COVID-19, coronavirus disease 2019; IQR, interquartile range; NA, not available.
The overall SAR was almost the same during the Omicron period (43% [95% confidence interval [CI], 41% to 44%]) as during the Delta period (41% [95% CI, 36% to 47%]). The SAR was not significantly different during the Omicron subvariant periods: 40% (95% CI, 33%–47%) during the BA.1 period, 37% during the BA.2 period (95% CI, 34% to 40%), and 44% during the BA.4/5 period (95% CI, 40% to 48%). The SAR in households with unvaccinated index cases was not different during the Delta (55% [95% CI, 38%–72%]) and Omicron periods (57% [95% CI, 43% to 71%]). Although numbers in subgroups are generally low, the SAR showed a decrease in households where the index case had received primary or booster vaccinations, during both the Delta and Omicron periods (Supplementary Table A).
During the Delta-dominant period, the adjusted VE-infection was 47% (95% CI, −27% to 78%) for household members with a primary series. There were not enough household members with booster vaccinations to obtain reliable estimates. During the Omicron period, no direct protection against infection was found as the adjusted VE-infection was −36% (95% CI, −87% to 1%) for household members with a primary series and −28% (95% CI, −77% to 7%) for household members with a first booster vaccination (Table 2 and Supplementary Table B1). VE-infection for the second booster could not be reliably estimated since the majority of unvaccinated individuals were <60 years of age and the majority of individuals with a second booster were >60 years of age, resulting in a faulty comparison.
Vaccine Effectiveness Against Infection
| Variant | Vaccination Status of Household Member | Model 1: VE Adjusted for Calendar Week and Vaccination Status of Index | Model 2: Model 1 + Household Size + Age of Household Member + Age of Index | No. of Household Members |
|---|---|---|---|---|
| Delta | No vaccination | Ref | Ref | 94 |
| Primary series | 24% (−40% to 59%) | 47% (−27% to 78%) | 243 | |
| Omicron | No vaccination | Ref | Ref | 366 |
| Primary series | −41% (−85% to −7%) | −36% (−87% to 1%) | 757 | |
| Booster 1 | −57% (−100% to −23%) | −28% (−77% to 7%) | 2229 |
Impact of the vaccination status of the household member on contracting infection. Values in parentheses indicate the 95% confidence interval.
Abbreviation: VE, vaccine effectiveness.
During the Delta period, the adjusted VE-infectiousness was 70% (95% CI, 28% to 87%) for index cases with a primary series and 93% (95% CI, 56% to 99%) for index cases with a booster vaccination. There were only 12 index cases with a booster during the Delta period and the booster was administered at the end of the Delta period; therefore, this estimate should be interpretated with caution. During the Omicron period the adjusted VE-infectiousness was 45% (95% CI, −14% to 74%) for index cases with a primary series and 64% (95% CI, 31% to 82%) for index cases with a first booster vaccination (Table 3 and Supplementary Table B2).
Vaccine Effectiveness Against Infectiousness
| Variant | Vaccination Status of Index Case | Model 1: VE Adjusted for Calendar Week and Vaccination Status of Household Members | Model 2: Model 1 + Household Size + Age of Household Members + Age of Index | No. of Index Cases |
|---|---|---|---|---|
| Delta | No vaccination | Ref | Ref | 19 |
| Primary series | 42% (−41% to 76%) | 70% (28% to 87%) | 199 | |
| Booster 1 | 74% (−28% to 95%) | 93% (56% to 99%) | 12 | |
| Omicron | No vaccination | Ref | Ref | 37 |
| Primary series | 42% (−21% to 72%) | 45% (−14% to 74%) | 104 | |
| Booster 1 | 62% (28% to 80%) | 64% (31% to 82%) | 2566 |
Impact of the vaccination status of the index case on transmission to household members. Values in parentheses indicate the 95% confidence interval.
Abbreviation: VE, vaccine effectiveness.
In a sensitivity analysis we explored the impact of a prior SARS-CoV-2 infection on VE-infectiousness. This sensitivity analysis did not evaluate VE-infection as information on prior infection among household members was not available. During both the Delta and Omicron periods, we observed a small decrease in the VE-infectiousness when including index cases with a prior infection. VE-infectiousness during Delta was estimated at 61% (95% CI, 3% to 84%) for primary series and 85% (95% CI, 10% to 98%) for first booster vaccination. During Omicron this was 32% (95% CI, −11% to 59%) for primary series and 32% (95% CI, −5% to 57%) for first booster vaccination (Supplementary Table C).
A sensitivity analysis exploring the effect of time since vaccination showed that VE against infection estimates was lower after 3 months since vaccination compared to the first 3 months since vaccination (Tables 4 and 5). A sensitivity analysis exploring the impact of younger household members showed an increase in VE-infectiousness and a decrease in VE-infection (Supplementary Table D1 and D2). Another sensitivity analysis exploring the impact of the time window for testing showed estimates similar to the main analysis (Supplementary Table E1 and E2).
Vaccine Effectiveness Against Infection Stratified by Time Since Vaccination
| Variant | Vaccination Status of Household Member | <3 mo Since Vaccination | >3 mo Since Vaccination | ||
|---|---|---|---|---|---|
| VE Adjusted for Calendar Week and Vaccination Status of Household Member + Household Size + Age of Household Member + Age of Index | No. of Household Members | VE Adjusted for Calendar Week and Vaccination Status of Household Member + Household Size + Age of Household Member + Age of Index | No. of Household Members | ||
| Delta | No vaccination | Ref | 94 | Ref | 94 |
| Primary series | 92% (66% to 98%) | 72 | 12% (−138% to 67%) | 157 | |
| Omicron | No vaccination | Ref | 366 | Ref | 366 |
| Primary series | −28% (−102% to 20%) | 200 | −24% (−78% to 13%) | 557 | |
| Booster 1 | −3% (−51% to 30%) | 1546 | −58% (−138% to −5%) | 683 | |
Impact of the vaccination status of the household member on contracting infection. Values in parentheses indicate the 95% confidence interval.
Abbreviation: VE, vaccine effectiveness.
Vaccine Effectiveness Against Infectiousness Stratified by Time Since Vaccination
| Variant | Vaccination Status of Household Members | <3 mo Since Vaccination | >3 mo Since Vaccination | ||
|---|---|---|---|---|---|
| VE Adjusted for Calendar Week and Vaccination Status of Household Members + Household Size + Age of Household Members + Age of Index | No. of Index Cases | VE Adjusted for Calendar Week and Vaccination Status of Household Members + Household Size + Age of Household Members + Age of Index | No. of Index Cases | ||
| Delta | No vaccination | Ref | 19 | Ref | 19 |
| Primary series | 100% (100% to 100%) | 25 | 72% (89% to 27%) | 173 | |
| Omicron | No vaccination | Ref | 37 | Ref | 37 |
| Primary series | 10% (−251% to 77%) | 12 | 59% (82% to 4%) | 92 | |
| Booster 1 | 63% (81% to 27%) | 1608 | 73% (89% to 35%) | 957 | |
Impact of the vaccination status of the index case on transmission to household members. Values in parentheses indicate the 95% confidence interval.
Abbreviation: VE, vaccine effectiveness.
DISCUSSION
In this prospective cohort study among adults aged 18–85 years, we collected data on infections in household members given infection in the household to estimate VE-infectiousness and VE-infection during the Delta- and Omicron-dominant periods. We found an adjusted VE-infectiousness of 70% and 93% during the Delta period for primary series and first booster, respectively. VE-infectiousness was lower during the Omicron period: 45% and 64% for primary series and first booster, respectively. We found a VE-infection of 47% for primary series during the Delta period. During the Omicron period the VE-infection was −36% and −28% for the primary series and first booster, respectively.
This study shows that COVID-19 vaccination is effective against infectiousness of SARS-CoV-2 Delta and Omicron in household settings for index cases without prior infection, both for indexes vaccinated with a primary series and indexes with a booster, in line with other studies [4, 6]. Another study from the Netherlands, which studied VE of primary vaccination against infectiousness during the Delta period using source and contact tracing data, showed fairly similar results with a VE-infectiousness of 63% (95% CI, 46%–75%) for unvaccinated contacts and 40% (95% CI, 20%–54%) for contacts with a primary series [10]. A study by Jalali et al showed that the risk of onward transmission of a Delta infection to household members was 82% (Relative risk [RR], 0.18 [95% CI, .01–.70]) lower for booster-vaccinated index cases compared to unvaccinated index cases, although no difference was observed for Omicron (RR, 0.99 [95% CI, .68–1.49]) [5]. In contrast, the study by Lyngse et al reported no difference in VE-infectiousness between Delta and Omicron with an overall increased odds ratio of 1.37 (95% CI, 1.27–1.47) for infectiousness of unvaccinated index cases compared to index cases with a primary series [6]. It should be noted that the studies by Jalali et al and Lyngse et al were done in the early Omicron waves and likely concern mostly BA.1 variants, whereas our estimates also include infections with Omicron BA.2 and BA.4/5 variants. Both studies excluded index cases with a prior infection, although this was only based on laboratory-confirmed tests, whereas we also excluded prior infections based on self-tests and presence of SARS-CoV-2 anti-N antibodies. In a sensitivity analysis we included index cases with a prior infection, which led to a decrease in the VE-infectiousness, suggesting that prior infection gives protection against infectiousness, thereby diluting the VE estimates. Earlier reports also showed that index cases with a prior infection had a lower risk of transmitting to close contacts [4].
A lower VE against Omicron infection compared to Delta has been observed in many other studies [5, 6, 11]. However, the estimates we found on VE against Omicron infection are much lower than found in other studies. This could be due to several reasons. First, we could not adjust for prior infections of household members as this information was not available. Prior infections would reduce susceptibility among household members, diluting vaccine effects in our analysis. Second, the VE-infection in this study is in the context of exposure to infection in a household setting. Close contact of long duration in a household setting might have resulted in increased infection risk, even when vaccinated. Symptomatic infection has been linked to increased infectiousness compared to asymptomatic infection [12]. Since the vast majority (96%) of our index cases had a symptomatic infection, this might also have lowered the VE estimates. Third, time since vaccination could have played a role. In a sensitivity analysis, we showed that a large proportion of participants and household members had received their last vaccination >3 months ago, which will have led to a reduction in the VE. Finally, since age was a factor influencing vaccination, we investigated whether this could have impacted our VE estimates. A sensitivity analysis in which household members aged <18 years were excluded resulted in a further reduction of the VE-infection. Therefore, an imbalance of vaccination over age groups does not explain our low estimates of VE-infection.
One of the strengths of this study is that we collected data on a relatively large number of households, which enabled us to estimate VE-infectiousness. Also, we were able to assess VE during the later Omicron wave since participants in VASCO could apply for free-of-charge self-test kits as of April 2022 when national testing was scaled down. Our study also has some limitations. First, differences in testing behavior and moment of testing between vaccinated and unvaccinated index cases and household members may have affected our estimates in both directions. Also, at some times during the study period, there were different quarantine rules for vaccinated and unvaccinated household members, which could have increased differential testing behavior. We tried to limit the effects of testing behavior by only including household members for which it was reported that they did a test, although the number of tests and the timing of testing could have been different. Second, we assumed that all infections that occurred in the household between 2 and 14 days after the index case were caused by the index case, but these infections could have had another origin. Misclassification of infection origin would have resulted in an underestimation of the VE-infectiousness. To minimize this, we used a follow-up period of maximum 14 days. A sensitivity analysis using a follow-up period of maximum 7 days gave similar estimates (Supplementary Table E1 and E2). Third, we did not collect data on the behavioral response of household members following the positive test result of the index case. Potentially, unvaccinated household members may have kept more distance than vaccinated household members, thereby lowering their risk of infection. If this is the case, this would have led to an underestimation of the VE-infectiousness. Fourth, our data are based on self-report, except for the vaccination status of the index case, which was verified by the national vaccination register, which could have resulted in recall bias. However, given the short time between infection of the index date and filling out the questionnaire on household members (median of 32 days) and the impact the event probably had on the household, recall bias is expected to be minimal.
In summary, we showed that COVID-19 vaccination is effective against infection with SARS-CoV-2 Delta and against infectiousness of SARS-CoV-2 Delta and Omicron. Therefore, our results support vaccination, especially for those in close contact with vulnerable people such as healthcare workers, employees in elderly care homes, or people otherwise often in close contact with vulnerable people and persons not eligible for vaccination.
Supplementary Data
Supplementary materials are available at The Journal of Infectious Diseases online. Consisting of data provided by the authors to benefit the reader, the posted materials are not copyedited and are the sole responsibility of the authors, so questions or comments should be addressed to the corresponding author.
Notes
Financial support. This work was supported by the Dutch Ministry of Health, Welfare and Sport.
References
Author notes
Potential conflicts of interest. All authors: No reported conflicts.
All authors have submitted the ICMJE Form for Disclosure of Potential Conflicts of Interest. Conflicts that the editors consider relevant to the content of the manuscript have been disclosed.

