


Abstract
To reduce the risk of pertussis-related morbidity and mortality in early life, an increasing number of countries recommend maternal pertussis vaccination. However, there is limited knowledge about half-lives of vaccine-induced pertussis-specific maternal antibodies, especially in preterm infants, and factors potentially influencing them.
We compared 2 different approaches to provide estimates of the half-lives of pertussis-specific maternal antibodies in infants and explored potential effects on the half-life in 2 studies. In the first approach, we estimated the half-lives per child and used these estimates as responses in linear models. In the second approach, we used linear mixed effect models on a log2 transformed scale of the longitudinal data to use the inverse of the time parameter as an estimate for the half-lives.
Both approaches provided similar results. The identified covariates partly explain differences in half-life estimates. The strongest evidence we observed was a difference between term and preterm infants, with the preterm infants showing a longer half-life. Among others, a longer interval between vaccination and delivery increases the half-life.
Several variables influence the decay speed of maternal antibodies. Both approaches have advantages and disadvantages, while the choice is secondary when assessing the half-life of pertussis-specific antibodies.
NCT02408926 and NCT02511327.
Pertussis, commonly known as whooping cough, is a highly contagious respiratory infectious disease caused by the bacteria Bordetella pertussis [1]. In 2018, the World Health Organization reported more than 151 000 pertussis cases across all age groups globally [2]. However, a study using data from 2014 showed that this number is a strong underestimation of the true burden and estimated that approximately 5.1 million pertussis cases and 85 900 pertussis-related deaths occur yearly in infants younger than 1 year illustrating that infants are at high risk for pertussis-related morbidity and mortality [3–6].
Thus, to better protect these vulnerable infants, pertussis immunization during pregnancy has been introduced in a number of countries worldwide. Immunization with a tetanus, diphtheria, acellular pertussis (Tdap) vaccine during pregnancy increases the titer of disease-specific antibodies in the pregnant woman, which are then transferred across the placenta to the unborn child offering protection against pertussis in the first weeks of life [7]. However, the presence of maternal antibodies at the time of infant immunization can have an inhibitory effect on antibody generation by the infant's immune system [8]. Hence, knowing the persistence of these maternal antibodies by estimating half-lives of the maternally acquired antibodies in newborns is crucial to estimate the optimal time point to start infant vaccination resulting in the least inhibition of the infants' immune response to their own vaccinations.
Previous studies investigating the half-life of maternal antibodies in infants were mainly conducted before the strategy of in-pregnancy immunization was introduced [9, 10]. In these studies, passively acquired maternal antibodies in infants were mainly induced by either natural infection or by vaccination of the mother with whole-cell pertussis (wP)- or acellular pertussis (aP)-containing vaccines in childhood or adolescence [11]. Therefore data are still limited on the half-life, and on the influence of sociodemographic and clinical characteristics on the half-life, of pertussis-specific antibodies in neonates induced by in-pregnancy Tdap vaccination, with individual studies reporting various estimates [12–15]. A recent individual-participant data meta-analysis estimated the half-life for different Tdap-included naturally acquired and vaccine-induced maternal antibodies [12]. The authors found that decay rates varied slightly between the different Tdap-specific antigens resulting in point estimates for the half-lives ranging from 28.7 to 35.1 days. However, this study did not include information on half-lives of maternal antibodies in preterm infants. Because preterm infants are especially vulnerable to pertussis [16–18], it is important to protect them and to research effects of maternal Tdap vaccination on this specific population.
In this article, we compare 2 methods of half-life estimation, focusing on maternal antibodies induced by Tdap vaccination during pregnancy. We compare the data of 2 prospective cohort studies and investigate which covariates have a significant impact on the half-life estimation. With the inclusion of a preterm study group, we are able to discuss for the first time the effect of prematurity on the half-life. Furthermore, we use an approach that takes the weight gain of the infants into account as a surrogate for the increase in blood volume to correct for potential dilution effects.
METHODS
Study Design
Data from 2 prospective cohort studies conducted in Thailand (MATAB 5, ClinicalTrials.gov NCT02408926, April 2015 to September 2016) and Belgium (MATAB 6, ClinicalTrials.gov NCT02511327, May 2015 to June 2017) were used to investigate the half-life of vaccine-induced pertussis-specific maternal antibodies in infants [19, 20]. In both studies, healthy pregnant women received a Tdap vaccine (Boostrix; GlaxoSmithKline Biologicals) between 24 and 36 weeks gestational age (GA). From the Thai cohort, healthy infants born after 36 weeks GA were included in our analysis whereas from the Belgian cohort, both term and preterm (<37 weeks GA) infants were included in our analysis. Different immunoassays were used in the respective studies. In Thailand, immunoglobulin G (IgG) antibody titers against pertussis toxin (PT), filamentous hemagglutinin (FHA), and pertactin (PRN) were analyzed using commercial enzyme-linked immunosorbent assay (ELISA) kits (EUROIMMUN) with a lower limit of detection (LLOD) of <5 international units (IU)/mL. In Belgium, IgG antibody titers against PT, FHA, and PRN were analyzed by an in-house electrochemiluminescent method of Sanofi Pasteur with a LLOD of <2 ELISA units (EU)/mL. Full details on recruitment, data collection, inclusion/exclusion criteria, and laboratory testing can be found in the original articles published on the studies [19, 20]. Ethical approval was obtained and written informed consent was obtained from all participants included in the studies.
An infant was included in the analysis if the measurements for the pertussis-specific antibody titer met the following criteria: (1) both antibody titer at birth (cord, measured in cord blood) and the antibody titer before primary vaccination (prevaccination) were available; (2) at least 1 measurement was above the LLOD; and (3) the measurements indicated a decay, that is, cord measurements were higher than prevaccination measurements. Besides natural infection, there is no logical reason why the antibody titer from cord to prevaccination would increase. If we allowed for increase in antibody titers between cord and prevaccination, the individual half-life would be negative and would therefore result in an underestimation of the half-life for infants showing a decay.
Statistical Analysis
Demographic characteristics are reported as means with standard deviation (SD), medians with interquartile range (IQR), or as absolute and relative frequencies. Laboratory results are reported as geometric mean concentrations (GMCs) with 95% confidence intervals (CI) expressed in IU/mL (MATAB 5) or EU/mL (MATAB 6). Antibody titers below the LLOD were assigned 50% of the LLOD [21].
Because the 2 studies used different immunoassays to measure antibody titers, we performed all analyses on each study separately. We estimated the half-lives of vaccine-induced pertussis-specific maternally acquired antibodies for each antigen separately using 2 types of models (direct approach and indirect approach, see below). We examined the potential influence of the following preselected covariates: study group (term/preterm; only available for MATAB 6), age of the mother at delivery (years), interval between maternal vaccination and delivery (days), sex of the newborn (male/female), breastfeeding at delivery (yes/no), days before or after expected date of delivery, maternal antibody titer at delivery, primiparity (yes/no), change in weight between delivery and primary vaccination (grams), and has a twin (yes/no). Estimates are given for the different levels of included categorical covariates, while included quantitative covariates were set to the mean of the corresponding stratified group.
In the direct approach, we estimated the antibody half-life for each infant assuming an exponential decay with a constant decay-rate:
with and being the antibody titers measured at birth and before primary vaccination and being the time between birth and primary vaccination. Linear regression models (LR) were used to investigate the potential influence of covariates on the half-life. For variable selection, we used backward selection with the Akaike information criteria (AIC). The CIs are given by the build-in R-function using the standard error of the fit [22]. We denoted the half-lives we estimated using this approach as direct estimates.
In the indirect approach, we used a linear mixed effect (LME) model to estimate the decay rate. As a response we used the log2-transformed antibody titers such that a decrease by 1 unit corresponds to halving. With the random effect we adjusted for the different heights in the infant's antibody titer. As a fixed effect we included time and investigated the potential influence of the listed covariates and their interaction term with time, using a 2-stage backward selection with the AIC. The half-life is estimated via the negative inverse value of the coefficient of time and all time-interaction terms:
Let denote the covariates in the model where an interaction term with time exists, the half-life was estimated using the coefficients
We used the delta method to derive CIs [23].
As a sensitivity analysis, we fitted the 2 modelling approaches on weight-adjusted antibody titers, based on an idea used by Hartter et al [24]. The weight-adjusted observed antibody titers are used as a surrogate for the increase in blood volume, that is, to correct for potential dilution effects. The weight-adjusted antibody titer at time t is defined by where denotes the weight of the infant at time t. By the fact that we only had to adjust the prevaccination antibody titer. We referred to the half-lives estimated using the unadjusted approach as biological half-lives and those using the weight-adjusted approach as biochemical half-lives.
All analysis were performed in the statistical software R, version 4.1.3 [22] using the preinstalled functions and the package lmerTest (version 3.1-3) for the LME model [25].
RESULTS
For the analysis we used data from 370 infants; 237 from the Thai study (MATAB 5) and 89 term-born and 44 preterm-born infants from the Belgian study (MATAB 6). More details are given in the flowchart in the Supplementary Material.
Descriptive Analysis
Table 1 gives an overview of the demographic characteristics of all mothers and infants and of the GMCs for all pertussis-specific antigens at all time points in each study group. The MATAB 6 preterm group showed some differences when compared to the other 2 groups: the number of twins was higher (no twins were included in MATAB 5), the GA at delivery was lower compared to term-born infants, the interval between vaccination and delivery was shorter, their birth weight was lower, and their GMCs at delivery were lower compared to MATAB 6 term-born infants. For 1 woman in the MATAB 6 term group, the GA at vaccination and therefore the interval between vaccination and delivery were unknown. For 1 infant in the MATAB 6 term group the change in weight was unknown. For some mothers the antibody titer is missing (5 in MATAB 5, 4 in MATAB 6 term, and 15 in MATAB 6 preterm).
Maternal and Infant Characteristics of all Study Participants Included in the Analysis and Geometric Mean Concentrations
| Characteristic | MATAB 5 | MATAB 6 Term | MATAB 6 Preterm |
|---|---|---|---|
| Women | |||
| No. | 237 | 88 | 34 |
| Mean age at delivery, y (SD) | 29.8 (5.7) | 31.6 (3.9) | 31 (3.9) |
| Median gestational age at delivery, wk (IQR) | 39 (38–39) | 39.9 (39–40.6) | 34.5 (32.9–35.9) |
| Median gestational age at vaccination, wk (IQR) | 30 (29–33) | 29.7 (27.7–31.7) | 27.6 (26.5–29.3) |
| Mean interval between vaccination and delivery, d (SD) | 55.9 (18.1) | 72.2 (25.4) | 42.9 (18.4) |
| Primiparity, No. (%) | |||
| Yes | 94 (39.7) | 38 (43.2) | 13 (38.2) |
| No | 143 (60.3) | 50 (56.8) | 21 (61.8) |
| Infants | |||
| No. | 237 | 89 | 44 |
| Sex, No. (%) | |||
| Male | 122 (51.5) | 39 (43.8) | 23 (52.3) |
| Female | 115 (48.5) | 50 (56.2) | 21 (47.7) |
| Breastfeeding at delivery, No. (%) | |||
| Yes | 236 (99.6) | 79 (88.8) | 40 (90.9) |
| No | 1 (0.4) | 10 (11.2) | 4 (9.1) |
| Twin pregnancy, No. (%) | |||
| Yes | 0 (0.0) | 2 (2.2) | 20 (45.5) |
| No | 237 (100.0) | 87 (97.8) | 24 (54.5) |
| Mean birth weight, g (SD) | 3144.6 (356.2) | 3438.2 (413.5) | 2288.1 (549.4) |
| Mean change weight, g (SD) | 2253.7 (490.8) | 1726.2 (469) | 1737 (410.9) |
| Median days before or after expected date of delivery (IQR) | −7 (−12 to −1) | −1 (−8 to 4) | −37 (−50 to −27) |
| Antibodies GMC (95% CI) | |||
| GMC anti-PT mother at delivery | 44.3 (39.4–49.8) | 61.7 (50.7–75.2) | 61.4 (47.1–79.9) |
| GMC anti-PT cord | 48.7 (43.2–55) | 89.9 (74.6–108.2) | 46.9 (36.1–60.9) |
| GMC anti-PT prevacc | 15.6 (13.9–17.6) | 18.3 (14.9–22.5) | 13.8 (10.3–18.3) |
| GMC anti-PRN mother at delivery | 130.6 (101–168.8) | 268.3 (207.8–346.5) | 214.9 (120.3–384.0) |
| GMC anti-PRN cord | 133.1 (103.3–171.4) | 410.4 (319.8–526.6) | 167.9 (111.6–252.6) |
| GMC anti-PRN prevacc | 41 (32.5–51.7) | 76.8 (58.7–100.5) | 52.9 (35.6–78.4) |
| GMC anti-FHA mother at delivery | 361.2 (313–417) | 247.7 (203.4–301.7) | 172.4 (124.6–238.6) |
| GMC anti-FHA cord | 389 (338.6–446.9) | 394.8 (330–472.3) | 145.2 (109.3–192.9) |
| GMC anti-FHA prevacc | 102.4 (90–116.5) | 80.3 (64.9–99.4) | 48.4 (35.4–66.1) |
GMC was measured in IU/mL for MATAB 5 and EU/mL for MATAB 6.
Abbreviations: cord, measured in cord blood; FHA, filamentous hemagglutinin; GMC, geometric mean concentration; IQR, interquartile range; NA, not available; prevacc, before primary vaccination; PRN, pertactin; PT, pertussis toxin.
Half-life Estimates
The direction of a covariate's effect on the estimated half-life was consistent if included in the model, but not all models included the same covariates (Table 2). A positive effect on the half-life (an increase in the half-life) translates to a slower decay in antibody titers while a negative effect on the half-life (a decrease in the half-life) translates to a faster decay in antibody titers. For MATAB 6, the study group was included in each model, with preterm-born infants showing a higher half-life compared to term-born infants, that is, a slower decay in antibody titers from birth to primary vaccination. Also, a higher maternal antibody titer at delivery in MATAB 5 had a negative effect on the half-life. If included in the model, we observed an increase in the half-life estimates if the newborn was female and/or if the interval between maternal vaccination and delivery was longer, while we observed a decrease in the half-life estimates corresponding to a faster decay in antibody titers from birth to primary vaccination for a higher change in weight, if the newborn was not breastfed or if the women was primiparous. For the detailed model output, see the Supplementary Material.
Effects of Variables on the Half-life in the Respective Model for the Respective Antibody
| Variable | PT | PRN | FHA | |||||||||
|---|---|---|---|---|---|---|---|---|---|---|---|---|
| MATAB 5 | MATAB 6 | MATAB 5 | MATAB 6 | MATAB 5 | MATAB 6 | |||||||
| LME | LR | LME | LR | LME | LR | LME | LR | LME | LR | LME | LR | |
| Study group, terma | − | − | − | − | − | − | ||||||
| IBVD | + | + | + | + | + | |||||||
| AB mother | − | − | − | − | ||||||||
| Change in weight | − | − | − | − | − | |||||||
| Sex, female | + | + | + | |||||||||
| First child, yes | − | |||||||||||
| Breastfeeding at delivery, no | − | − | ||||||||||
+ indicates an increase in the half-life, ie, decreasing the speed of decay, while − indicates a negative effect on the half-life, ie, increasing the speed of decay. For continuous covariates, the effect refers to an increase in the respective variable. For factors, the effect references to the level in parentheses compared to the reference level, eg, the study group term has a negative effect on the half-life compared to the preterm study group. Age of mother at delivery, days before/after expected date of delivery, and being twin were not selected in any of the models.
Abbreviations: AB, antibodies; IBVD, interval between vaccination and delivery; FHA, filamentous hemagglutinin; LR, linear regression model; LME, linear mixed effects model; PRN, pertactin; PT, pertussis toxin.
aOnly available in MATAB 6.
There was an emphasized difference in half-life estimations between term and preterm study groups in MATAB 6 (Table 3). For example, the LME model for PT estimated a half-life of 23.6 days (95% CI, 22.1–25.1) for the term group while 31.7 days (95% CI, 27.1–36.3) for the preterm group. The half-life estimates for PRN and FHA show similar results in the difference between the 2 study groups, but were further stratified due to the inclusion of categorical variables. For example, the LME model for PRN estimated a half-life of 21.9 days (95% CI, 19.9–23.8) for term-born male infants compared to a half-life of 30.1 days (95% CI, 26.3–34.9) for preterm-born male infants. For female infants we estimated a half-life of 24.5 days (95% CI, 22.4–26.6) if term-born compared to 35.3 days (95% CI, 28.2–42.3) for preterm-born female infants. The estimates for FHA are similar using the LME model: 22.6 days (95% CI, 20.5–24.7) for term-born male infants; 32.0 days (95% CI, 26.6–37.4) for preterm-born male infants; 25.3 days (95% CI, 23.0–27.6) for term-born female infants; and 37.6 days (95% CI, 29.5–45.7) for preterm-born female infants. The fitted LR models showed very similar estimates. Throughout both studies, some models showed an influence of sex on the half-life. The half-lives of female infants were approximately 2 days longer compared to male infants in the term study group and around 5 days longer in the preterm study group. The effect of the interval between maternal vaccination and delivery on the half-life for PT was consistent if included in the model, with a longer interval increasing the half-life (Figure 1 A).
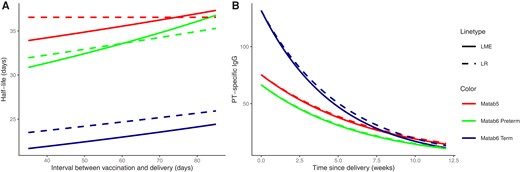
A, Effect of the interval between maternal vaccination and delivery on the half-life estimates of PT antibody. The red dashed line is constant because the LR model for MATAB 5 does not include the interval between vaccination and delivery as a covariate. B, Exponential decay of PT antibody titers over time for the average infant. The dashed line indicates the estimate for the direct approach (LR model) and the solid line for the indirect approach (LME model). Other continuous covariates were set to the mean of the respective study group. Abbreviations: LME, linear mixed effects model; LR, linear regression model; PT, pertussis toxin.
Half-life Estimates and 95% CI (Days) for Different Antibodies, Studies, and Models Stratified by Factors Included in the Model While Using the Mean of the Respective Group for Continuous Covariates
| MATAB 5 | MATAB 6 | ||
|---|---|---|---|
| LME | LR | LME | LR |
| PT | |||
| 35.2 (34.1–36.4) | 36.4 (35.1–37.8) | Term, 23.6 (22.1–25.2) | Term, 25.3 (23.5–27.2) |
| Preterm, 31.7 (27.1–36.4) | Preterm, 32.5 (28.8–36.7) | ||
| PRN | |||
| 34.4 (33.3–35.4) | Male, 34.4 (32.9–36.0) | Term male, 21.9 (19.9–23.8) | Term BF yes, 25.8 (23.5–28.3) |
| Female, 36.2 (34.6–37.9) | Term female, 24.5 (22.4–26.6) | Term BF no, 21.1 (15.8–28.0) | |
| Preterm male, 30.1 (26.3–34.9) | Preterm BF yes, 33.6 (28.9–39.2) | ||
| Preterm female, 35.3 (28.2–42.3) | Preterm BF no, 24.4 (17.6–34.0) | ||
| FHA | |||
| 32.7 (31.6–34.0) | First child, 32.7 (31.4–34.1) | Term male, 22.6 (20.5–24.7) | Term BF yes, 26.9 (24.6–29.5) |
| Not first child, 35.3 (33.6–37.2) | Term female, 25.3 (23.0–27.6) | Term BF no, 20.6 (15.6–27.3) | |
| Preterm male, 32.0 (26.6–37.4) | Preterm BF yes, 35.5 (30.6–41.1) | ||
| Preterm female, 37.6 (29.5–45.7) | Preterm BF no, 25.5 (18.6–35.2) | ||
Abbreviations: CI, confidence interval; BF, breastfeeding; FHA, filamentous hemagglutinin; LR, linear regression model; LME, linear mixed effects model; PRN, pertactin; PT, pertussis toxin.
The exponential decay in anti-PT titers over time for an average infant per study group is shown in Figure 1B. Both model approaches resulted in comparable decay rates, which was an immediate consequence of the close half-life estimates. A faster antibody decay was observed for the MATAB 6 term group compared to the 2 other study groups (MATAB 5, MATAB 6 preterm). However, it seemed that around 9 weeks after delivery, all 3 groups had comparable antibody titers. The corresponding figures for FHA or PRN can be found in the Supplementary Material. In Figure 2 we illustrate the estimated exponential decay of PT antibody titers for both models (LR, LME) for 2 randomly chosen infants starting from their observed cord blood antibody level and taking into account the selected covariates (dashed and solid line). Both models showed minimal differences and came quite close to the observed antibody titer before primary vaccination. By the structure of the LME model, it is possible to predict the pointwise titer levels over time. For the described infants, the dotted line not utilizing the observed cord blood value displays these pointwise predictions.
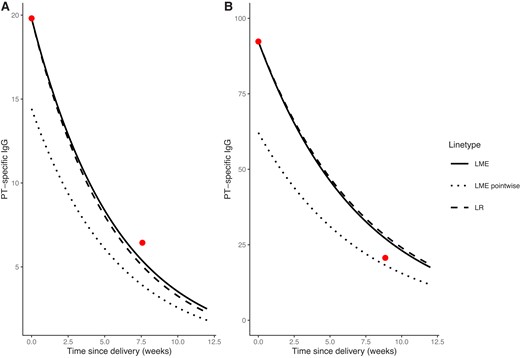
Prediction of decay in PT titer for 2 randomly chosen infants. The dots represent the observed values, the dashed line corresponds to the exponential decay using the half-life estimated by the LR model, the solid line corresponds to the exponential decay using the half-life estimated by the LME model, and the dotted line corresponds to the pointwise prediction using the LME model. A, The infant was part of the preterm study group in MATAB 6. There were 5 days between vaccination and delivery, born 51 days before expected date of delivery, male, breastfed, the first infant, with an increase in weight of 2.3 kg in 7.57 weeks between delivery and primary vaccination. The PT titer of the mother at delivery showed a value of 24.15, the cord PT titer was 19.81, and at the prevaccination time point 6.44. Abbreviations: LME, linear mixed effects model; LR, linear regression model; PT, pertussis toxin. B, The infant was part of MATAB 5, born 5 days before the expected date of delivery with 57 days between vaccination and delivery, was male, breastfed, and not the first infant. The infant increased in weight by 2.475 kg in 8.86 weeks between delivery and primary vaccination. The PT titer of the mother at delivery showed a value of 55.54, the cord PT titer was 92.32, and at the prevaccination time point 20.62.
Weight Adjusted Approach
The sensitivity analysis with weight-adjusted antibody titers confirmed what we observed for the unadjusted estimates. The dilution effect caused by the gain in weight does not fully explain the decay of the antibodies, highlighting that they are metabolized during this period and confirming the appropriateness of using the weight-adjusted approach as sensitivity analysis. All covariates used for the biological half-life and the biochemical half-life are consistent in their effects on the half-life, with one inconsistency observed for the interval between maternal vaccination and delivery in the LME model for FHA, MATAB 5 (Table 4). The biochemical half-life is by structure larger than the biological half-life. The LR model and the LME model gave similar estimates, while the difference in estimates between the term and preterm study groups increased even more compared to the biological half-lives (see Supplementary Material).
Effects of Variables on the Half-life Using the Weight Adjusted Approach, in the Respective Model for the Respective Antibody
| Variable | PT | PRN | FHA | |||||||||
|---|---|---|---|---|---|---|---|---|---|---|---|---|
| MATAB 5 | MATAB 6 | MATAB 5 | MATAB 6 | MATAB 5 | MATAB 6 | |||||||
| LME | LR | LME | LR | LME | LR | LME | LR | LME | LR | LME | LR | |
| Study group, terma | − | − | − | − | − | − | ||||||
| IBVD | + | + | − | |||||||||
| AB mother | − | − | − | − | − | |||||||
| First child, yes | − | − | − | |||||||||
| Age mother at delivery | − | |||||||||||
| Days before or after expected date of delivery | − | |||||||||||
| Sex, female | + | |||||||||||
+ indicates an increase in the half-life, ie, decreasing the speed of decay, while − indicates a negative effect on the half-life, ie, increasing the speed of decay. For continuous covariates the effect references to an increase in the respective variable. For factors, the effect references to the level in parentheses compared to the reference level.
Abbreviations: AB, antibodies; IBVD, Interval between vaccination and delivery; FHA, filamentous hemagglutinin; LR, linear regression model; LME, linear mixed effects model; PRN, pertactin; PT, pertussis toxin.
aOnly available in MATAB 6.
DISCUSSION
In our analysis, both approaches to estimating the half-life of vaccine-induced maternally acquired pertussis-specific antibodies in infants provided similar results, while the half-life estimates differed between the pertussis-specific antibodies. The strongest effect was the difference in half-life estimates in MATAB 6 between the term- and preterm-study group, indicating that term-born infants have a lower half-life and thus a faster decay in antibody titers compared to preterm-born infants (eg, PT with LME model, 23.6 days, 95% CI, 22.1–25.2 for term born; 31.7 days, 95% CI, 27.1–36.4 for preterm born). This difference was observed independent of other included variables, for example, the level of maternal antibodies or choice of model. Across the different antigens and models, we found consistent effects of the covariates examined if they were included in the model. We observed that an increase in the interval between maternal vaccination and delivery has a positive effect on the half-life of maternally acquired antibodies. It is already known from the literature that a longer interval between vaccination and delivery is associated with higher cord blood antibody titers at birth, while its effect on the half-life has not yet been analyzed [19]. We also observed that higher maternal antibody titers at delivery lead to a faster antibody decay in the infant. Because the infant antibody levels at birth correlate with maternal ones [26], the inclusion of the antibody titer of the mother at delivery in the models might be a substitute for the cord blood titer of the infant. IgG catabolism is higher with higher IgG levels and vice versa [27], therefore a higher cord blood titer might result in a faster decay of maternal antibodies in the infant. Our results indicate that a bigger increase in weight decreases the half-life, which might relate to dilution effects, and that female infants have a higher half-life compared to male infants. Sex-based differences in the immune response and persistence have been observed in other studies and other for antigens, mostly in adults, with females generally showing higher antibody responses to vaccination [28, 29]. Moreover, we observed a decreased half-life if the infant was the first born or was not breastfed. The decrease in the half-life for nonbreastfed infants compared to breastfed infants might possibly be related to the transfer of various components such as immunoglobulins through breast milk [30]. The differences between the term-born infants in MATAB 6 (Belgium) and the infants included in MATAB 5 (Thailand), might relate to differences in the maternal vaccination history, sociodemographic differences between the respective countries, and qualitative characteristics of antibodies elicited in pregnant women. Due to the fact that Belgian women are likely to have already received multiple doses of pertussis-containing vaccines in their life, whereas for Thai women it might be their first dose of a pertussis-containing vaccine, the vaccination might induce antibodies with other qualitative characteristics, possibly impacting the half-life of transplacentally transferred maternal antibodies in the infant. Furthermore, antibody levels in women can vary across different countries due to various factors, including differences in exposure to infections such as human immunodeficiency virus (HIV), parasites, or other diseases.
In an individual-participant data meta-analysis, Oguti et al provide overall estimates for the half-life of vaccine-induced pertussis-specific maternal antibodies: for PT of 29.8 days (95% CI, 25.8–35.4), for PRN of 32.8 days (95% CI, 30.8–35.1), and for FHA of 34.9 days (95% CI, 30.8–40.1) [12]. These estimates are comparable to our results, with the MATAB 6 term-born study group showing slightly lower half-lives. In line with the results provided by the individual-participant data meta-analysis, the magnitude of difference for the estimated half-lives for the different antibodies is quite small.
While the direct approach, using a linear model, allows easier interpretation of the potential effects of different covariates on the half-life, the indirect approach, using an LME model, allows prediction of the antibody titers at every time point between delivery and primary vaccination of the newborn without explicitly knowing the cord titer. Both approaches allow modelling of antibody titers assuming an exponential decay with constant decay rate and provide similar results, which indicates that the choice of the estimation approach only slightly influences the estimate itself.
For pertussis there are no correlates of protection known but a higher titer correlates with better protection [31]. However, we can use both modelling approaches to determine the expected time to fall below a preset value. Despite the differences in the 3 study groups regarding half-life estimations, we estimated similar PT antibody levels between weeks 9 to 11 after delivery, which is close to the planned vaccination time in most national vaccination schedules [32].
Several limitations should be mentioned. We only included 2 studies, while there have been more studies conducted dealing with the research question of decay of pertussis-specific antibodies; however, we provided for the first time estimates for the half-life of vaccine-induced maternal antibodies in preterm infants. Furthermore, as all women were vaccinated with the same vaccine, we cannot generalize our results for different vaccines. The 2 studies also differed in the assays used to quantify the antibody titers, while with the LR approach we get rid of the potentially introduced variability due to assays as we used only within-person changes. In our study, we only knew the IgG antibody titer, with no further information on the specific subclasses. Knowing the IgG-subclass distribution would be beneficial for further insight, for example to discuss whether the IgG-subclass distribution contributes to the differences in half-life. The sample sizes for the preterm study group and some stratifications are very small, which is reflected in the width of the CIs given with the point estimates. We should therefore be caution when generalizing about the kinetics in infants. Additionally, the way we treated samples below the LLOD might introduce a bias in the estimates, while there were only few samples below the LLOD.
When determining the optimal start of an immunization program in infants after maternal vaccination, the decay of maternal antibodies should be considered, in addition to other important aspects. Individual vaccination schedules are difficult to implement, especially because there are other, unanalyzed and important antigens (tetanus, diphtheria) included in vaccines and changing the vaccination schedule might not be feasible or safe. The 2 approaches we took to determine the half-life and explore potential factors influencing the half-life only showed marginal differences, with both having advantages and disadvantages. Preterm-born infants, which usually start with a lower antibody titer compared to term-born infants, showed a decreased decay speed compared to term-born infants.
Supplementary Data
Supplementary materials are available at The Journal of Infectious Diseases online. Consisting of data provided by the authors to benefit the reader, the posted materials are not copyedited and are the sole responsibility of the authors, so questions or comments should be addressed to the corresponding author.
Notes
Acknowledgments. The authors thank all participating women and children for providing their blood samples.
Financial support. This work was supported by a bilateral project of the Austrian Science Fund (grant number I 6376-B) and the Research Foundation—Flanders (FWO; grant number G004723N). MATAB 5 was supported by the Thrasher Research Fund (grant number EWAT 12348); MATAB 6 was supported by the FWO (grant number G064015N). An unrestricted grant from Sanofi Pasteur was received for the laboratory analysis of the samples. Funding to pay the Open Access publication charges for this article was provided by Austrian Academic Library Consortium (Kooperation E-Medien Österreich).
References
Author notes
Presented in part: 31st International Biometric Conference, July 2022, Riga, Latvia.
Potential conflicts of interest. All authors: No reported conflicts. All authors have submitted the ICMJE Form for Disclosure of Potential Conflicts of Interest. Conflicts that the editors consider relevant to the content of the manuscript have been disclosed.

