


Abstract
Severe acute respiratory syndrome coronavirus 2 (SARS-CoV-2) polymerase chain reaction (PCR) on nasopharyngeal swab (NPS), remains the most reliable and practical test to diagnose coronavirus disease 2019 (COVID-19). Current literature is sparse regarding the rates of discordance between NPS and bronchoalveolar lavage (BAL) in patients with cancer.
We conducted a retrospective cohort study of adult patients with cancer who had BAL samples tested for SARS-CoV-2 at a comprehensive cancer center. Patients without NPS PCR for SARS-CoV-2 before BAL were excluded.
In a cohort of 345 patients, 12% and 17% tested positive for SARS-CoV-2 on NPS and BAL, respectively. There was a 6.3% NPS−/BAL+ discordance rate and a 9.5% NPS+/BAL− discordance rate. Patients with lymphoma (adjusted odds ratio [aOR] = 4.06; P = .007) and Hispanic patients (aOR = 3.76; P = .009) were more likely to have NPS−/BAL+ discordance on multivariate analysis. Among patients with NPS− /BAL− for SARS-CoV-2, an alternate infectious (23%) and a noninfectious etiology (16%) were identified in BAL.
Our discordance rates between NPS and BAL were sufficient to recommend BAL in certain patients with cancer with a high clinical suspicion of COVID-19. BAL has value in identifying alternative etiologies of illness in patients with suspected or confirmed COVID-19.
Severe acute respiratory syndrome coronavirus 2 (SARS-CoV-2) polymerase chain reaction (PCR) on nasopharyngeal swab (NPS) remains the most sensitive and specific of the widely available tests used for diagnosing coronavirus disease 2019 (COVID-19) [1]. However, missed cases of COVID-19 as a result of discordance between NPS and bronchoalveolar lavage (BAL) remain a concern, as failure to accurately diagnose active infection may result in unexpected transmission in a hospital setting and can delay therapy in high-risk patients. Repeated NPS testing for COVID-19, however, results in the increased and prolonged use of isolation resources, including personal protective equipment, valuable laboratory resources, and patient inconvenience in the form of repeat swabbing and potential harm from the psychological aspects of isolation without enhancing the positive predictive value [2].
Currently, the Infectious Disease Society of America guidelines recommend testing lower respiratory specimens in patients with a negative SARS-CoV-2 PCR from an upper respiratory specimen and high clinical suspicion for COVID-19 on the basis of a compatible clinical syndrome [3]. These recommendations are based on findings from earlier studies that showed a significant increase in yield when comparing BAL specimens to NPS specimens, especially in patients for whom clinical suspicion for COVID-19 was high [4–7]. However, there was significant heterogeneity in these studies, both in the study design and BAL yield and the rates of discordance between BAL and NPS PCR results.
Patients with cancer are at high risk for COVID-19 and poor clinical outcomes, dependent on the underlying cancer type and degree of immunosuppression [8]; thus, establishing an accurate diagnosis in this patient population is paramount. The dynamics of viral replication are unknown in the setting of heterogeneous cancer therapies, ranging from radiation therapy and cytotoxic chemotherapy to chimeric antigen receptor T-cell therapy [8]. Patients with hematologic malignancies and COVID-19 may have prolonged SARS CoV-2 shedding and prolonged disease courses for over 2 months from the initial positive tests [9–11]. One retrospective cohort study showed an association between hematologic malignancy and prolonged shedding; however, viral cultures were not obtained to assess for an actively replicating virus, nor were BAL results reported [12]. It is unclear to what degree the prolonged NPS PCR positivity was due to the shedding of nonreplicating virus versus active ongoing viral replication with lower respiratory tract involvement. However, there is evidence that patients with severe disease and those who are immunocompromised shed replicative-competent virus for longer periods of time [13, 14].
Little is currently known about the yield of BAL for diagnosing SARS-CoV-2 lower respiratory tract infection, specifically in patients with cancer. Given this lack of knowledge, we determined the rate of discordance of NPS and BAL and the utility of BAL by performing a retrospective analysis of patients who had undergone both NPS and BAL PCR for SARS CoV-2 at a comprehensive cancer center. Our primary hypothesis was that there are identifiable risk factors that predispose to NPS-BAL discordance, and that BAL is warranted for certain high-risk patients. We also hypothesized that BAL is useful for identifying infectious and noninfectious conditions that can mimic COVID-19.
METHODS
Study Design
A single-center, retrospective cohort study was performed at The University of Texas MD Anderson Cancer center, a 743-bed tertiary cancer center, from 1 April 2020 through 30 June 2021. The study was approved by the institutional review board, and a waiver of informed consent was granted.
We included all patients with a BAL sample that had been submitted for SARS-CoV-2 PCR testing during the study period identified from our microbiology laboratory database. We excluded patients <18 years of age, those with no active or prior cancer diagnosis, and those without NPS PCR for SARS-CoV-2 obtained before BAL. A subanalysis was performed to exclude patients who did not have an NPS within 14 days prior to BAL, even if the prior NPS was positive. BAL was performed according to a standardized protocol at our institution, which has been previously reported [15]. One difference is that patients requiring more than 5 L/minute oxygen including intubated patients underwent BAL at the discretion of the treating team. The decision to perform BAL was contingent on a sufficient level of illness to warrant evaluation and underlying predisposition to progression of the illness, as well as some degree of diagnostic uncertainty. As this study was retrospective it played no role in the decision to perform BAL.
We collected patient data from the electronic medical record via chart review and automated data retrieval via the Data-Driven Determinants for COVID-19 Oncology Discovered (D3CODE) protocol. Collected data included baseline demographics (age, sex, race, and comorbidities); cancer type and status (active vs remission); cancer treatments; clinical features (including presenting symptoms, timing of symptom onset, and pneumonia severity score at the time of BAL); radiological findings; laboratory, BAL (cell count/differential and cytology), vaccination status, and all microbiological test results; COVID-19–directed therapies; and outcomes data, (including intensive care unit admission and 30-day all-cause mortality rate).
SARS-CoV-2 testing on NP swabs was performed using 1 of 2 assays, the Cobas SARS-CoV-2 test performed on the Cobas 6800 (Roche Diagnostics) or the Abbott SARS-CoV-2 assay performed on the m2000. Both assays are real-time PCR assays intended for the qualitative detection of viral RNA in NPS specimens. BAL fluid specimens were sent to Eurofins Viracor (Lenexa, KS) for SARS-CoV-2 testing using a dual-target, Diatherix TEM-PCR assay, which is a real-time PCR assays intended for the qualitative detection of viral RNA in lower respiratory specimens.
Definitions
Neutropenia was defined as an absolute neutrophil count <500 cells/µL, and lymphopenia was defined as an absolute lymphocyte count <200 cells/µL. Steroid use was defined as the use of ≥ 20 mg (or equivalent dose) of prednisone or equivalent daily for ≥21 days in the 30 days preceding the COVID-19 diagnosis or BAL. Active or recent checkpoint inhibitor use referred to ongoing use or use within 90 days preceding COVID-19 diagnosis or BAL, and chimeric antigen receptor–T-cell therapy was considered recent if it was administered within 1 year. Patients were considered vaccinated or partially vaccinated if they had ≥1 dose of any available COVID-19 vaccine. Computed tomography (CT) findings related to COVID-19 were described as typical, atypical, or indeterminate, according to the 2020 Radiologic Society of North America COVID-19 guidelines [16]. Respiratory failure was defined as requiring supplemental oxygen, high-flow nasal cannula, noninvasive positive pressure ventilation, or mechanical ventilation. NPS was considered recent if performed within 14 days before BAL when negative and within 90 days when positive. A discordant NPS for SARS-CoV-2 was defined as a case in which the NPS PCR results did not match the BAL PCR results, that is, NPS+/BAL− or NPS−/BAL+. A concordant case was one in which both the NPS and BAL results were either positive or negative.
Primary Outcome and Statistical Analysis
The primary outcome was the rate of discordance between NPS and BAL by PCR for SARS-CoV-2, specifically a negative NPS PCR within 14 days before a positive BAL PCR. Other outcomes of interest included the overall yield of BAL PCR (proportion of positive tests of total tests performed), 30-day survival rate, and BAL yield in terms of identifying coinfections with SARS-CoV-2 and alternative infectious and noninfectious diagnoses.
We performed univariate and multivariate analyses to identify demographic and clinical factors that were associated with discordance between NPS and BAL PCR results for SARS-CoV-2. We compared categorical variables using χ2 or Fisher exact test as appropriate and continuous variables using Wilcoxon rank sum test. A logistic regression analysis was constructed to identify independent predictors of BAL positivity for SARS-CoV-2 among patients with negative NPS results. Kaplan-Meier methods estimated the survival curves of patients with different NPS/BAL results for COVID-19 diagnosis, and the log-rank method was used for comparison. All tests were 2-sided, with a significance level of .05. The statistical analyses were performed using SAS version 9.4 (SAS Institute, Inc).
RESULTS
Baseline Characteristics of the Overall Cohort
A total of 365 patients with cancer underwent BAL PCR for SARS-CoV-2 during the study period (Figure 1). Eight patients were excluded for being aged younger than 18 years and 12 for lack of NPS preceding BAL in the appropriate timeframe. The baseline characteristics of the 345 patients included in the cohort are depicted in Table 1. The median age was 62 years (18–86 years); most were male (206 [60%]) and non-Hispanic white (210 [62%]). The majority of patients had hematologic malignancies (250 [73%]), and 80 (23%) had received a hematopoietic cell transplant.
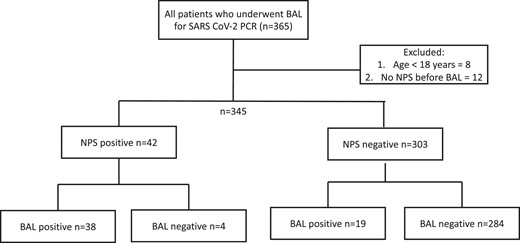
Inclusion and exclusion criteria and nasopharyngeal swab/bronchoalveolar lavage results. Abbreviations: BAL, bronchoalveolar lavage; NPS, nasopharyngeal swab; SARS-CoV-2, severe acute respiratory syndrome coronavirus 2.
Descriptive Statistics of the Entire Cohort (n = 345)
| Characteristic | Value |
|---|---|
| Age, y, median (range) | 62 (18–86) |
| Gender, male | 206 (60) |
| Race and ethnicity, No./total (%) | |
| Non-Hispanic white | 210/340 (62) |
| Black | 42/340 (12) |
| Hispanic | 64/340 (19) |
| Other | 24/340 (7) |
| Underlying malignancy | |
| Solid tumor | 95 (28) |
| Hematologic malignancy | 250 (73) |
| Leukemia | 156 (45) |
| Lymphoma | 54 (16) |
| HCT | 80 (23) |
| Postallogeneic | 59 (17) |
| Postautologous | 21 (6) |
| Multiple myeloma | 24 (7) |
| Active cancer, No./total (%) | 263/338 (78) |
| History of CAR-T cell therapy, No./total (%) | 8/333 (2) |
| Active steroid treatment | 109 (32) |
| Diabetes | 135 (39) |
| Hypertension | 259 (75) |
| COPD | 54 (16) |
| Current or former smoker, No./total (%) | 155/343 (45) |
| Obesity, No./total (%) | 106/344 (31) |
| Vaccinated, No./total (%)a | 23/258 (9) |
| Symptomatic | 329 (95) |
| Number of symptoms, median (range) | 3 (1–7) |
| Respiratory failure | 174 (50) |
| Oxygen requirement | |
| None, ambient air | 171 (50) |
| Nasal cannula | 100 (29) |
| High-flow oxygen | 51 (15) |
| NIPPV | 5 (1) |
| Mechanical ventilation | 18 (5) |
| Radiological findings, No./total (%)b | |
| Typical | 83/339 (25) |
| Atypical | 101/339 (30) |
| Indeterminate | 155/339 (46) |
| Time from symptom onset to BAL, d, median (IQR) | 8 (4–20) |
| Time from last NPS to BAL, d, median (IQR) | 3 (1–5) |
| Absolute neutrophil count ≤ 500, No./total (%) | 57/317 (18) |
| Absolute lymphocyte count ≤ 200, No./total (%) | 38/317 (12) |
| Ferritin, ng/mL, median (IQR) | 2183 (884–4899) |
| CRP, mg/L, median (IQR) | 114.1 (49.39–188.96) |
| IL-6, pg/mL, median (IQR) | 36.1 (14.0–70.0) |
| Procalcitonin, ng/mL, median (IQR) | 0.25 (0.14–0.45) |
| Active chemotherapy | 223 (65) |
| History of checkpoint inhibitor treatment | 36 (10) |
| Active steroid treatment | 109 (32) |
| PSI score, median (IQR) | 103 (82–126) |
| 30-d mortality rate, No./total (%) | 60/324 (19) |
Data are No. (%) except where indicated.
Abbreviations: BAL, bronchoalveolar lavage; CAR-T, chimeric antigen receptor T; COPD, chronic obstructive pulmonary disorder; CRP, C-reactive protein; HCT, hematopoietic cell transplant; IL-6, interleukin 6; IQR, interquartile range; NIPPV, chronic obstructive pulmonary disorder; NPS, nasopharyngeal swab; PSI, pneumonia severity index.
aVaccination includes both full and partial vaccination prior to BAL. Patients with the vaccination date missing were excluded from the vaccination analysis.
bTypical, atypical, and indeterminate radiographic findings, defined according to 2020 Radiologic Society of North America COVID-19 guidelines.
CT scans of the chest preceding BAL had an indeterminate appearance for COVID-19 for 155 (46%) of the patients; typical appearance was noted in only 83 (25%). Respiratory failure was present in 174 (50%) patients at the time of BAL.
BAL Yield for SARS-CoV-2 PCR
Of the 345 patients in this study, 42 (12%) had a positive NPS PCR for SARS-CoV-2, while 303 (88%) had a negative NPS PCR (Figure 1). Nineteen were NPS−/BAL+ (discordance rate among NPS− = 6.3%), 284 were NPS−/BAL−, 38 were NPS+/BAL+, and 4 were NPS+/BAL− (discordance rate among NPS+ = 9.5%). The median cycle threshold (Ct) of BAL PCR for patients with negative NPS PCR was 25.3 (interquartile range, 18.5–34.1) compared to 20.0 (interquartile range, 13.9–24.8) for patients with NPS+ PCR (P = .29).
Several clinical characteristics were associated with NPS and BAL SARS-CoV-2 PCR discordance on univariate analysis (Table 2). NPS−/BAL+ patients were likely to have fewer symptoms (median of 3 vs 4, P = .032) and lower CRP (57 vs 120, P = .019), and to be on active chemotherapy (84% vs 50%, P = .012) than were NPS+/BAL+ patients. Patients with NPS−/BAL + were more likely to have lymphoma (37% vs 12%, P = .007) than were patients with NPS−/BAL− and had a lower median interleukin 6 (IL-6) level (17 vs 47 pg/mL, P = .05).
Characteristics of Patients With Cancer Stratified by Nasopharyngeal Swab/Bronchoalveolar Lavage SARS-CoV-2 Results
| Characteristic | NPS −/BAL+ (n = 19) | NPS−/BAL− (n = 284) | NPS+/BAL+ (n = 38) | NPS+/BAL− (n = 4) | P Valuea | P Valueb |
|---|---|---|---|---|---|---|
| Age, y, median (range) | 58 (19–83) | 62 (19–86) | 61 (18–84) | 69 (57–76) | .12 | .36 |
| Sex, male | 10 (53) | 168 (59) | 24 (63) | 4 (100) | .58 | .45 |
| Race | .048 | .73 | ||||
| Non-Hispanic white | 9 (47) | 178/279 (64) | 21 (55) | 2 (50) | ||
| Black | 1 (5) | 38/279 (14) | 1 (3) | 2 (50) | ||
| Hispanic | 8 (42) | 44/279 (16) | 12 (32) | 0 (0) | ||
| Other | 1 (5) | 19/279 (7) | 4 (11) | 0 (0) | ||
| Underlying cancer | .46 | >.99 | ||||
| Solid tumor | 4 (21) | 82 (29) | 9 (24) | 0 (0) | ||
| Hematologic malignancy | 15 (79) | 202 (71) | 29 (76) | 4 (100) | ||
| Leukemia | 5 (26) | 137 (48) | 12 (32) | 2 (50) | .06 | .68 |
| Lymphoma | 7 (37) | 34 (12) | 11 (29) | 2 (50) | .007 | .55 |
| Stem cell transplant | 4 (21) | 68 (24) | 8 (21) | 0 (0) | >.99 | >.99 |
| Postallogeneic | 2 (11) | 53 (19) | 4 (11) | 0 (0) | .54 | >.99 |
| Postautologous | 2 (11) | 15 (5) | 4 (11) | 0 (0) | .29 | > .99 |
| Myeloma | 0 (0) | 21 (7) | 3 (8) | 0 (0) | .38 | .54 |
| Active cancer | 15 (79) | 221/277 (80) | 23 (61) | 4 (100) | > .99 | .16 |
| History of CAR-T cell therapy | 2/17 (12) | 5/274 (2) | 1 (3) | 0 (0) | .06 | .22 |
| Diabetes | 11 (58) | 109 (38) | 13 (34) | 2 (50) | .09 | .09 |
| Hypertension | 13 (68) | 216 (76) | 27 (71) | 3 (75) | .42 | .84 |
| COPD | 4 (21) | 47 (17) | 3 (8) | 0 (0) | .54 | .21 |
| Smoking status | .41 | .90 | ||||
| Current or former smoker | 7 (37) | 132/283 (47) | 13/37 (35) | 3 (75) | ||
| Never smoker | 12 (63) | 151/283 (53) | 24/37 (65) | 1 (25) | ||
| Obesity | 4 (21) | 85/283 (30) | 16 (42) | 1 (25) | .41 | .12 |
| Vaccinationc | 1/14 (7) | 20/205 (10) | 2/35 (6) | 0 (0) | > .99 | > .99 |
| Symptomatic | 18 (95) | 271 (95) | 38 (100) | 2 (50) | .60 | .33 |
| No. of symptoms, median (range) | 3 (1–5) | 3 (1–7) | 4 (1–7) | 3 (1–4) | .83 | .032 |
| Radiological findings | .33 | .09 | ||||
| Typical | 6 (32) | 54/280 (19) | 22/36 (61) | 1 (25) | ||
| Atypical | 4 (21) | 94/280 (34) | 3/36 (8) | 0 (0) | ||
| Indeterminate | 9 (47) | 132/280 (47) | 11/36 (31) | 3 (75) | ||
| Respiratory failure | 8 (42) | 137 (48) | 26 (68) | 3 (75) | .60 | .06 |
| High-flow oxygen | 3 (16) | 31 (11) | 15 (40) | 2 (50) | .46 | .07 |
| Nasal cannula | 3 (16) | 88 (31) | 8 (21) | 1 (25) | .16 | .73 |
| NIPPV | 1 (5) | 4 (1) | 0 (0) | 0 (0) | .28 | .33 |
| Intubation | 1 (5) | 14 (5) | 3 (8) | 0 (0) | > .99 | > .99 |
| Neutrophil, ×103/µL, median (IQR) | 4.00 (1.41–7.41) | 3.46 (0.76–6.98) | 4.05 (2.67–7.07) | 8.60 (2.17–17.69) | .37 | .95 |
| ANC ≤ 500 | 1/17 (6) | 54/258 (21) | 2 (5) | 0 (0) | .21 | > .99 |
| Lymphocyte, ×103/µL, median (IQR) | 0.53 (0.36–1.04) | 0.60 (0.34–1.13) | 0.51 (0.21–0.94) | 1.10 (0.83–1.84) | .48 | .74 |
| ALC ≤ 200 | 3/17 (18) | 26/258 (10) | 9 (24) | 0 (0) | .40 | .73 |
| Ferritin, ng/mL, median (IQR) | 2172 (1169–3356) | 2193 (842–5819) | 1825 (680–4314) | 3097 (2253–4534) | > .99 | .69 |
| CRP, mg/L, median (IQR) | 57.17 (47.75–93.60) | 119.18 (45.73–196.16) | 120.41 (69.05–184.61) | 86.79 (83.82–167.24) | .06 | .019 |
| IL-6, pg/mL, median (IQR) | 17.0 (10.9–26.0) | 47.0 (19.20–86.0) | 35.0 (14.0–54.0) | 77.0 (19.0–135.0) | .05 | .19 |
| Procalcitonin, ng/mL, median (IQR) | 0.26 (0.15–0.37) | 0.27 (0.15–0.50) | 0.15 (0.11–0.33) | 0.24 (0.18–0.97) | .83 | .14 |
| Active chemotherapy | 16 (84) | 186 (66) | 19 (50) | 2 (50) | .09 | .012 |
| History of checkpoint inhibitor | 2 (11) | 29 (10) | 4 (11) | 1 (25) | > .99 | > .99 |
| Active steroid treatment | 6 (32) | 83 (29) | 18 (47) | 2 (50) | .83 | .26 |
| Time from symptom onset to BAL, d, median (IQR) | 13 (5–31) | 6 (4–16) | 21 (13–39) | 97 (33–160) | .08 | .21 |
| Time from last NPS to BAL, d, median (IQR) | 2 (1–4) | 2 (1–4) | 16 (4–23) | 31 (28–35) | > .99 | < .0001 |
| PSI score, median (IQR) | 103 (79–126) | 102 (82–125) | 103 (91–126) | 160 (153–170) | .78 | .53 |
| 30-d mortality rate | 2 (11) | 49/263 (19) | 8 (21) | 1 (25) | .54 | .47 |
Data are No. (%) or No./total (%) except where indicated.
Abbreviations: ALC, absolute lymphocyte count; ANC, absolute neutrophil count; BAL, bronchoalveolar lavage; CAR-T, chimeric antigen receptor T; COPD, chronic obstructive pulmonary disorder; CRP, C reactive protein; IL-6, interleukin 6; IQR, interquartile range; NIPPV, noninvasive positive pressure ventilation; NPS, nasopharyngeal swab; PSI, Pneumonia Severity Index.
aP value from NPS−/BAL+ versus NPS−/BAL−.
bP value from NPS−/BAL+ versus NPS+/BAL+.
cVaccination includes both full and partial vaccination prior to BAL.
On multivariate analysis, 2 factors were significantly associated with discordant results (NPS−/BAL+) (Table 3). Patients with lymphoma (adjusted odds ratio [aOR] = 4.06; 95% confidence interval [CI], 1.46–11.29; P = .007) and patients of Hispanic origin (aOR = 3.76; 95% CI, 1.40–10.10; P = .009) were more likely to experience NPS−/BAL+ discordance.
Multivariable Logistic Regression Model of Independent Predictors of SARS-CoV-2 Bronchoalveolar Lavage Positivity Among Patients With Negative Nasopharyngeal Swab Results
| Independent Predictors | aOR | 95% CI | P Value |
|---|---|---|---|
| Hispanic ethnicity | 3.76 | 1.40–10.10 | .009 |
| Lymphoma | 4.06 | 1.46–11.29 | .007 |
| Independent Predictors | aOR | 95% CI | P Value |
|---|---|---|---|
| Hispanic ethnicity | 3.76 | 1.40–10.10 | .009 |
| Lymphoma | 4.06 | 1.46–11.29 | .007 |
Abbreviations: aOR, adjusted odds ratio; CI, confidence interval.
Mortality by NPS and BAL Results
The 30-day all-cause mortality rate was not significantly different between the NPS−/BAL+ and NPS−/BAL− (11% vs 19%, P = .66) or NPS−/BAL+ and NPS+/BAL+ groups (11% vs 21%, P = .47). A mortality analysis was also performed based on BAL results alone, and the results were not significantly different between those with a negative SARS-CoV-2 PCR on BAL and those with a positive BAL PCR (19% vs 17%, P = .80) (Figure 2 and Figure 3). There was also no significant difference in 30-day all-cause mortality rates between patients when grouped by COVID-19 status and coinfection or non-SARS-CoV-2 infections alone (P = .27) (Supplementary Figure 1).
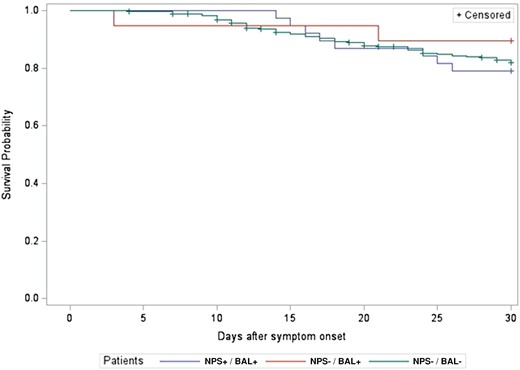
Thirty-day all-cause mortality rate by nasopharyngeal swab (NPS)/bronchoalveolar lavage (BAL) results (P = .66).
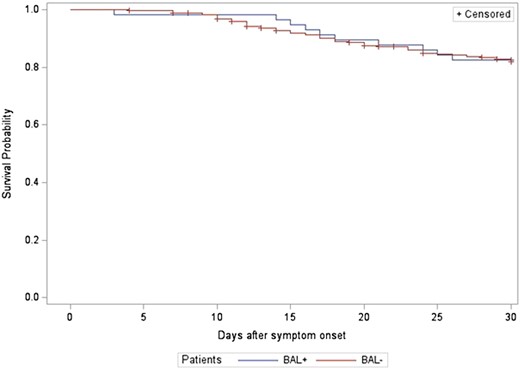
Thirty-day all-cause mortality rate by bronchoalveolar lavage (BAL) results (P = .90).
BAL Yield for Coinfections and Non-SARS-CoV-2 Infections
Of the 61 patients with 1 or more positive PCR results for SARS-CoV-2 on BAL or NPS, 7 (12%) had a coinfection identified based on BAL testing. Of these, 3 (43%) were viral, 2 (29%) were bacterial, and 2 (29%) were fungal infections (Table 4). All of the viral coinfections were cytomegalovirus, and both fungal infections were Aspergillus species. Of the bacterial coinfections, 1 case was Pseudomonas aeruginosa and 1 was Stenotrophomonas maltophila. Among patients with a coinfection identified based on BAL, 3 (43%) received immunosuppressive medications (tocilizumab, baricitinib, or dexamethasone) as part of their COVID-19 treatment. This was similar to the overall proportion of patients with a positive NPS who received immunosuppression prior to their BAL (38%).
Infectious and Noninfectious Yield of Bronchoalveolar Lavage for Patients Without COVID-19 (Nasopharyngeal Swab Negative/Bronchoalveolar Lavage Negative) and Rates of Coinfections Among Patients With COVID-19
| Alternate infectious etiology in COVID-19–negative patients | No./Total (%) |
|---|---|
| Any | 64/284 (23) |
| Bacterial | 20/65 (31) |
| Gram-positivea | 5/20 (25) |
| Gram-negativeb | 16/20 (80) |
| Atypical bacteriac | 2/20 (10) |
| Multiple bacteria | 3/20 (15) |
| Fungal | 35/64 (55) |
| Pneumocystis jirovecii | 21/35 (60) |
| Aspergillus | 10/35 (29) |
| Other molds | 4/35 (11) |
| Viral | 16/64 (25) |
| Cytomegalovirus | 11/16 (69) |
| Other viruses | 5/16 (31) |
| Mycobacteriald | 3/64 (5) |
| Polymicrobial | 13/64 (20) |
| Alternate noninfectious etiology in COVID-19–negative patients | |
| Any noninfectious diagnosis | 46/284 (16) |
| Diffuse-alveolar hemorrhage | 17/46 (37) |
| Drug-induced pneumonitis | 16/46 (35) |
| Other | 13/46 (28) |
| Coinfections in COVID-19–positive patients | |
| Any | 7/61 (12) |
| Bacteriale | 2/7 (29) |
| Fungalf | 2/7 (29) |
| Viralg | 3/7 (43) |
aAll 5 were Staphylococcus aureus.
bStenotrophomonas spp (6), Pseudomonas aeruginosa (7), Klebsiella spp (2), Enterobacter spp (1), Achromobacter spp (1), Achromobacter xylosoxidans (1).
cBoth were Legionella spp.
dMycobacterium avium complex (2), Mycobacterium abscessus (1).
ePseudomonas aeruginosa (1), Stenotrophomonas spp. (1).
fAspergillus spp (2).
gCytomegalovirus (3).
Alternative infectious etiologies were identified from BAL samples in 64 (23%) of the 284 patients with negative BAL and NPS for SARS-CoV-2. Of these 64 patients, 20 (31%) had a bacterial pathogen, 35 (55%) had a fungal pathogen, and 16 (25%) had a viral pathogen other than SARS-CoV-2 (Table 4). The most common bacterial pathogens were gram-negative bacteria (16 of 20 [80%]); the most common fungal pathogens were Pneumocystis jirovecii (21 of 35 [60%]) and Aspergillus (10 of 35 [29%]), and the most common viral pathogen was cytomegalovirus (11 of 16 [69%]). Thirteen (20%) of the 64 patients had a polymicrobial infection. Identifying an alternative infectious etiology led to a change in therapy in 51 (80%) patients.
Forty-six (16%) of the 284 patients had a noninfectious diagnosis identified on BAL or diagnosed via exclusion following BAL (Table 4). Of these, 17 (37%) were diffuse-alveolar hemorrhage and 16 (35%) were drug-induced pneumonitis. Identifying an alternate noninfectious etiology led to a change in therapy in 25 (54%) of these patients.
DISCUSSION
This is the first report on the yield of BAL PCR for SARS-CoV-2 in a large cohort of patients with cancer with suspected COVID-19. Our overall NPS−/BAL+ discordance rate of 6.3% was within the wide range of what has been reported in the general population (4%–25%) [5, 7, 17]. A high median Ct value for patients with NPS−/BAL+ suggests a low level of viral replication in some patients, which may account for the discordant results [18]. While patients with discordance represent a minority of the population that we studied, identifying patients with NPS−/BAL+ PCR results is imperative for the prevention of in-hospital spread of SARS-CoV-2 and for appropriate and timely treatment.
In our study, lymphoma as the underlying malignancy and self-identification as Hispanic were predictive of discordant results for SARS-CoV-2 by PCR on different respiratory samples (NPS−/BAL+). To our knowledge, only one prior study attempted to identify factors associated with NPS/BAL discordance [5] This study found that >50% lung parenchymal involvement on CT scan of chest and elevated temperatures were associated with discordance, in contrast to our findings. One case series of patients with cancer with COVID-19 described 3 patients with NPS−/BAL+ discordance, all of whom were lymphopenic [19]. While lymphopenia was not a risk factor for discordance in our study, lymphoma was, which suggests functional lymphopenia may predispose to NPS−/BAL+ discordance. Multiple studies have shown increased COVID-19 prevalence and severity in certain racial and ethnic minority groups [20, 21]. Increased severity may suggest disproportionate lung involvement compared with nasopharyngeal involvement. This is supported by data that demonstrate a positive correlation between alveolar SARS-CoV-2 viral loads and disease severity, while the opposite may be true of upper respiratory tract viral loads [22, 23]. This potential association between severity and disproportionate lung involvement could help explain the higher rates of NPS−BAL+ discordance among Hispanic patients in our cohort. However, we would also expect higher rates of such discordance among African American patients, which we did not observe, perhaps because of the low overall numbers of African American patients in our cohort. Similarly, patients with certain types of underlying lymphoma experience dysfunction of the innate and adaptive immune systems, owing both to the malignancy itself and to anticancer therapies, including anti-CD20 therapies and Bruton tyrosine kinases. In turn, this dysfunction places these patients at higher risk for more severe manifestations of COVID-19 and higher COVID-19–related mortality [24, 25]. Again, this increased severity in lymphoma patients may suggest disproportionate lung involvement in this population and may explain the higher rates of discordance in this group. These possibilities remain speculative, and further research is warranted to understand these observed differences.
In our cohort, we did not observe any significant difference in mortality between groups based on NPS and BAL discordance for SARS-CoV-2 or BAL positivity for SARS-CoV-2 by itself. This is likely explained by the high rates of infectious (23%) and noninfectious (16%) etiologies identified in patients without COVID-19 in this cohort. Many of the etiologies identified, including cytomegalovirus pneumonitis, Pneumocystis jirovecii pneumonia, fungal pneumonia, diffuse-alveolar hemorrhage, and drug-related pneumonitis, are associated with high mortality in immunocompromised patients [26–29].
The rate of coinfection in our cohort (13%) was similar to that in a recent published multicenter retrospective cohort study of patients with cancer (16.6%) [30]. In our cohort, bacterial (25%), viral (38%), and fungal (38%) infections were more evenly distributed, whereas in the aforementioned study, bacterial pathogens were by far the most commonly identified (73%). This could be explained by the higher proportion of patients with hematologic malignancies (73% vs 22%) in our cohort in whom fungal infections and certain viral infections are more common [31, 32].
To our knowledge, this is the first study to report on alternate infectious and noninfectious diagnoses made by BAL in patients with cancer and suspected COVID-19. BAL led to high rates of both infectious (23%) and noninfectious (16%) diagnoses, with subsequent changes in management for the majority of patients (80% for those with an alternate infectious etiology and 54% for those with an alternate noninfectious etiology). This further underscores the utility of BAL in patients with suspected SARS-CoV-2 infections.
There were several limitations in our study. First, because of our study's retrospective design, several sources of potential bias are inherent, especially selection bias regarding which patients underwent BAL for further diagnosis. Specifically, BAL may not have been performed on minimally symptomatic or asymptomatic patients, or on those in whom illness was too severe to perform BAL safely. We suspect that the same biases will continue to occur in real-world clinical settings, and our study provides valuable information to help guide which patients should undergo BAL. Second, viral cultures were not performed; therefore, it is difficult to estimate what proportion of patients with discordant NPS/BAL PCRs for SARS-CoV-2 had ongoing active viral replication versus viral shedding. However, we did obtain data regarding PCR Ct counts, which may provide clues to replication versus shedding [33]. Finally, during the study period, the circulating SARS-CoV-2 variants may have differed from those currently circulating or those that will circulate in the future. There is preliminary evidence that some variants bind preferentially to the upper respiratory tract versus the lower respiratory tract tissue and vice versa, and this may affect the rates of NPS/BAL discordance [34].
Our study reinforces the utility of BAL in patients with cancer with a high clinical suspicion for COVID-19 and negative SARS-CoV-2 NPS on PCR. The discordance rate between NPS and BAL (NPS−/BAL+) was higher in patients with lymphoma and those identifying as Hispanic. A low viral load in BAL, as indicated by a high Ct value, may have led to these discordant results. The diagnostic yield from BAL ascertained alternate infectious and noninfectious etiologies of respiratory illnesses in patients without COVID-19 diagnoses, with a subsequent effect on management. In addition, our findings support the utility of BAL in identifying concomitant infections and making treatment decisions for patients with positive NPS for SARS-CoV-2.
Supplementary Data
Supplementary materials are available at The Journal of Infectious Diseases online. Consisting of data provided by the authors to benefit the reader, the posted materials are not copyedited and are the sole responsibility of the authors, so questions or comments should be addressed to the corresponding author.
Notes
Acknowledgments. We thank Ann Sutton, scientific editor at MD Anderson Cancer Center's Research Medical Library for editing the manuscript.
Financial support. No financial support was received for this work.
References
Author notes
Cofirst authors, A. F. and T. M. J., contributed equally.
Presented in part: 32nd European Congress of Clinical Microbiology and Infectious Diseases (ECCMID), Lisbon, Portugal, April 23–26 2022, poster.
Potential conflicts of interest. R. F. C. reports consultant and/or advisor roles for Ansun BioPharma, ADMA Biologics, Roche, Partner Therapeutics, AiCuris, Adagio Therapeutics, Karius, Shinogi, Eurofins-Viracor, Inc, Genentech, Astellas, Janssen Pharmaceuticals, Inc, Merck & Co., Inc, Oxford Immunotec USA, Inc; Pulmotect, Inc, Takeda, and Xenex Laboratories; and institutional grant/research support from Ansun BioPharma, Eurofins-Viracor, Inc, Merck & Co., Inc, Takeda, Freestyle, Karius, Inc, AiCuris, and Genentech. All other authors report no potential conflicts.
All authors have submitted the ICMJE Form for Disclosure of Potential Conflicts of Interest. Conflicts that the editors consider relevant to the content of the manuscript have been disclosed.

