


Abstract
Real-world evidence of human papillomavirus (HPV) vaccine effectiveness (VE) against longitudinal outcomes is lacking among gay, bisexual, and other men who have sex with men (GBM). We compared 12-month incidence and persistence of anal HPV infection between vaccinated and unvaccinated GBM.
We recruited GBM aged 16–30 years in Montreal, Toronto, and Vancouver, Canada, from 2017 to 2019. Participants were followed over a median of 12 months (interquartile range, 12–13 months). Participants self-reported HPV vaccination and self-collected anal specimens for HPV DNA testing. We calculated prevalence ratios (PR) for 12-month cumulative incidence and persistence with ≥1 quadrivalent vaccine type (HPV 6/11/16/18) between vaccinated (≥1 dose at baseline) and unvaccinated participants using a propensity score-weighted, modified Poisson regression.
Among 248 participants, 109 (44.0%) were vaccinated at baseline, of whom 62.6% received 3 doses. PRs for HPV 6/11/16/18 were 0.56 (95% confidence interval [CI], .24–1.31) for cumulative incidence and 0.53 (95% CI, .25–1.14) for persistence. PRs were 0.23 (95% CI, .05–1.03) and 0.08 (95% CI, .01–.59) for incidence and persistence, respectively, among participants who received their first dose at age ≤23 years and 0.15 (95% CI, .03–.68) and 0.12 (95% CI, .03–.54) among participants who were sexually active for ≤5 years before vaccination.
Findings support national recommendations for HPV vaccination at younger ages or soon after sexual debut.
Persistent infection with oncogenic human papillomavirus (HPV) genotypes is a necessary cause of most anal cancers, while nononcogenic genotypes are associated with anogenital warts (AGW) [1, 2]. Gay, bisexual, and other men who have sex with men (GBM) have higher incidence but lower clearance of anal HPV infection compared with men who have sex with women [3, 4]. Anal cancer incidence is consistently higher in this population (19 cases per 100 000 person-years) compared with the general population (about 1–2 cases per 100 000 person-years), particularly among GBM with human immunodeficiency virus (HIV; 85 cases per 100 000 person-years) [5]. Most HPV infections in men will clear within 6–12 months [6–8], but tend to persist longer for people with HIV [9–11].
Prophylactic vaccines containing up to 9 HPV genotypes, most notably HPV 16/18 that cause up to 90% of anal cancers and HPV 6/11 that are associated with the majority of AGWs, are approved for men in Canada for prevention of anal cancer and its precursors and AGW [1, 2]. Since 2012, Canadian guidelines have recommended HPV vaccination for GBM, preferably before sexual debut, given their high-burden of HPV-associated disease [12]. Starting in 2015/2016, men who self-identify as GBM and/or those with HIV aged ≤26 years have been eligible for publicly funded HPV vaccination in most Canadian provinces or territories [13].
In the clinical trial of quadrivalent HPV vaccine, GBM who were HPV naive and received all 3 doses had an 84% lower risk of incident detection of HPV 6/11/16/18 and a 95% lower risk of persistent infection compared with those who received placebo [14]. Lower efficacy of 49% and 59%, respectively, were observed in the intention-to-treat population that may have been previously infected with HPV and received ≥1 dose [14]. However, this trial may have limited generalizability to GBM in real-world settings who have had more sexual partners (and thus more exposure to HPV) prior to vaccination and higher rates of HIV infection.
To date, only a handful of observational studies have measured HPV vaccine effectiveness (VE) among GBM. For example, Meites et al found VE of 29% against anal and/or oral prevalent infection with ≥1 quadrivalent vaccine type among GBM aged 18–26 years in 3 US cities during 2016–2018; VE increased to 59% when vaccination was initiated at age ≤18 years [15]. In a follow-up study during 2018–2020 including men up to age 45 years, VE was 84% among GBM aged 18–26 years when vaccination was initiated before age 18 years and 30% among GBM aged 27–45 years when initiated before age 26 years, but was not significantly protective when vaccination was initiated at older ages [16]. Previously, we measured VE against anal HPV prevalence with ≥1 quadrivalent vaccine type among Canadian GBM aged 16–30 years during 2017–2019 [17]. We found a 27% lower anal HPV prevalence among vaccinated compared with unvaccinated participants, increasing to 36% among participants who received their first dose at age ≤23 years [17].
VE against longitudinal outcomes such as persistent HPV infection, which is considered a more clinically relevant marker for HPV-associated cancers [18, 19], has not been demonstrated in real-world settings. Our objective was to compare 12-month cumulative incidence and persistence of anal HPV infection with vaccine-preventable types between vaccinated and unvaccinated GBM.
METHODS
Participants and Recruitment
We recruited sexually active GBM into the Engage Cohort Study, a multicity, prospective cohort in Montreal (Québec), Toronto (Ontario), and Vancouver (British Columbia), Canada [20]. At enrollment, men were (1) aged ≥16 years, (2) identified as a cis- or transgender man, (3) engaged in sexual activity with another man in the past 6 months, (4) able to read English (or English or French in Montreal), and (5) provided written informed consent.
Men were recruited between February 2017 and August 2019 using respondent-driven sampling (RDS), a modified form of chain-referral sampling whereby participants recruit members of their social networks [21]. Details of the RDS approach have been described previously [20]. Twelve-month follow-up visits took place between March 2018 and March 2021. Because participants could be contacted up to 2 months prior to their scheduled follow-up visit, we allowed the minimum interval between visits to be 10 months. We did not apply an upper limit, as in-person research activities were temporarily suspended during the coronavirus disease 2019 (COVID-19) pandemic in Montreal (March-June 2020), Toronto (March-November 2020), and Vancouver (March-September 2020); however, more than 90% of the 12-month visits were completed before March 2020. Research ethics boards at participating institutions granted study approval.
Data Collection
At baseline and 12-month follow-up, men self-completed a computer-assisted sexual health questionnaire, including questions on HPV vaccination history, and provided biological specimens for sexually transmitted and blood-borne infection (STBBI) testing. Questionnaire items were informed by the Sexual Health Framework and the Global AIDS Monitoring Indicators [22, 23]. We invited young men aged 16–30 years to provide an anal specimen for type-specific HPV DNA testing at each visit. Men self-collected anal specimens using a moistened Dacron swab inserted 3–5 cm into the anal canal. Research staff verbally explained collection procedures and provided illustrated instructions to aid with self-collection using validated methods for HPV detection [24].
HPV DNA was extracted using the MasterPure DNA Purification Kit (Epicentre Biotechnologies). Processed samples were screened for HPV DNA with a generic probe assay as previously described [25]. HPV-positive specimens were genotyped with the polymerase chain reaction (PCR)-based Roche Linear Array for the L1 consensus gene [26]. This assay detects 36 different mucosal HPV genotypes, including all 9 vaccine-preventable types, plus an endogenous human β-globin cellular control. HPV-negative specimens were also tested for human β-globin to assess specimen adequacy. Analyses were restricted to participants who provided ≥2 valid anal specimens, defined as detection of either β-globin or HPV DNA.
HPV Vaccination Status
Men aged ≤26 years at the time of vaccination were eligible for publicly funded HPV vaccine in British Columbia (implemented in September 2015) [27], Québec (January 2016) [28], and Ontario (September 2016) [29]. Men aged 27 years and older had to pay out-of-pocket (up to $550 CAD for 3 doses) or seek reimbursement through private- or employer-funded insurance [30]. Men received HPV vaccine in community settings including sexual health and other medical clinics, Community Health Centers (or Centres Locaux de Services Communautaires in Québec), physicians’ offices, and pharmacies [31]. During the study period, immunocompetent men who initiated their vaccine series at age ≥15 years (≥18 years in Québec) and those with HIV (regardless of age) were recommended to receive 3 doses [28, 32]. Canadian provinces switched from using quadrivalent vaccine (4vHPV) to 9-valent vaccine (9vHPV) with gradual roll-out beginning in May 2017 in British Columbia and Québec, and September 2017 in Ontario. We assumed most vaccinated participants received 4vHPV based on their self-reported age at vaccination relative to study enrollment.
HPV vaccination status was self-reported at baseline and 12-month follow-up. Participants who reported receiving ≥1 lifetime dose at baseline were considered vaccinated, while those reporting no vaccination or who were unaware of the HPV vaccine were considered unvaccinated. Age at HPV vaccination was defined based on self-reported age at first dose. The interval from sexual onset to vaccination was calculated as the number of years from self-reported age at first anal sex to age at first dose.
HPV Outcomes
We derived separate type-specific binary outcomes for 12-month cumulative incidence and persistence. Type-specific outcomes were grouped into composite outcomes for any tested HPV type, 4vHPV-preventable types (HPV 6/11/16/18), 9vHPV-preventable types (HPV 6/11/16/18/31/33/45/52/58), 9vHPV-preventable types not included in 4vHPV (HPV 31/33/45/52/58), and non-9vHPV–preventable types. Cumulative incidence was calculated as the proportion of participants who had a newly detected, type-specific infection at follow-up among those who were HPV negative for that type at baseline. For composite outcomes (eg, ≥ 1 4vHPV type), incidence was calculated among participants who were at risk for any applicable type at baseline. Incidence rates and 95% confidence intervals (CIs) were estimated using a modified Poisson distribution with robust standard errors using person-time as the offset. For those with an incident infection, person-time was calculated as the time (in months) from baseline to the midpoint between the baseline and follow-up visits. Persistent infection was defined as detection of the same HPV type at both baseline and follow-up. Unweighted proportions and rates are reported in the text; RDS-II-weighted statistics, which adjust for selection biases inherent to chain-referral sampling [33, 34], are provided in the Supplementary Material.
Regression Analysis
Because HPV vaccination was not randomly allocated by design, a propensity score approach was used to achieve balance in measured covariates between exposure groups. To estimate propensity scores, self-reported receipt of ≥1 HPV vaccine dose at baseline was regressed on measured covariates using logistic regression [35]. Potential confounders were identified based on prior literature and informed by directed acyclic graphs [6–8, 36–39]. We included all true confounders (ie, those independently associated with HPV vaccination and anal infection) in the propensity score model: age group (≤26 years vs > 26 years based on eligibility for publicly funded vaccine), city, highest level of education, race/ethnicity, sexual orientation, laboratory-confirmed HIV status, self-reported lifetime history of STBBIs (excluding HIV and AGW), lifetime smoking history, risk of alcohol-related harm in the past 6 months, lifetime illicit drug use, lifetime poppers use, number of male anal sex partners in the past 6 months, condomless receptive anal sex in the past 6 months, rimming (received) in past 6 months, fisting (received) in past 6 months, and log of RDS network size [35]. Inverse probability of treatment weights (IPTW) were derived as the inverse of the propensity score for that vaccination group [40]. IPTWs were stabilized by multiplying by the marginal probability of vaccination and truncated at the 1st and 99th percentiles to remove extreme outlier values [40]. Standardized differences (SDs) were calculated as the absolute difference in means or proportions between vaccinated and unvaccinated participants in units of the pooled standard deviation. SDs ≤0.1 were taken to indicate negligible differences [35, 40].
Prevalence ratios (PR) and 95% CIs comparing binary outcomes for ≥1 4vHPV type or ≥1 9vHPV type between vaccinated and unvaccinated GBM were estimated using a modified Poisson regression with robust standard errors without and with IPTWs [41]. Separate regression models were performed for cumulative incidence and persistence. Vaccination status was time-fixed at baseline to ensure temporality in exposure-outcome assessment. In sensitivity analysis, we explored time-updated vaccination status assessed at the 12-month follow-up visit for cumulative incidence outcomes (Supplementary Material). We derived categorical predictors for self-reported number of doses (≥2 doses or 3 doses), age at first dose (≤23 years or >23 years), and number of years sexually active prior to vaccination (≤5 years or >5 years). Unvaccinated participants were used as the reference group for all models. VE was calculated as (1–PR)×100%. As there is no agreed upon method for regression using RDS data and methods for combining IPTW and RDS-II weights have not been developed, we report IPTW-weighted but RDS-unweighted PRs [42, 43]. All analyses were performed in SAS version 9.4 (SAS Institute Inc).
RESULTS
Participant Characteristics
Of the 850 eligible participants aged 16–30 years who provided an anal specimen at baseline, 615 (72.4%) returned for ≥1 annual follow-up visit (Figure 1). HPV vaccination at baseline did not significantly differ between participants who completed their 12-month visit and those who were lost to follow-up (39.9% vs 33.6%; P = .102; Supplementary Table 1). Due to delays in securing funding for HPV testing, only 389 (63.3%) of the remaining 615 participants provided an anal specimen at their 12-month visit, of whom 254 (65.3%) provided ≥2 valid specimens. HPV vaccination did not significantly differ between participants with and without ≥2 valid anal specimens (44.0% vs 40.8%; P value = .553).
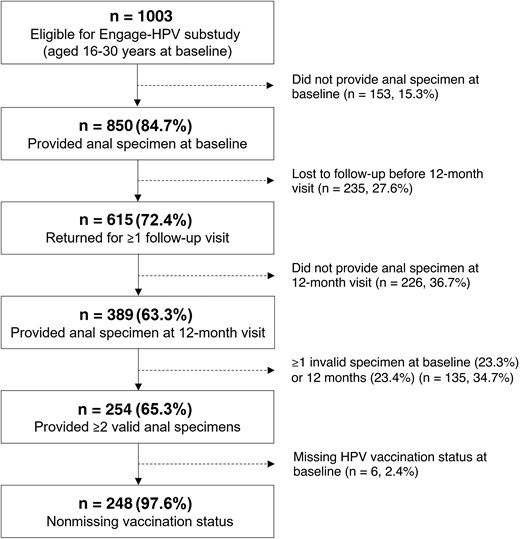
Participant flowchart, Engage Cohort Study, 2017–2021.
Of the 254 participants who provided ≥2 valid specimens, 248 (97.6%) had nonmissing data for HPV vaccination at baseline and were included in the analysis (Table 1). The median age at baseline was 26 years (interquartile range [IQR], 24–28 years), while the median age at first anal sex was 18 years (IQR, 16–20 years). Almost half (42.8%) reported >5 male anal sex partners in the past 6 months. Thirteen (5.3%) participants had a laboratory-confirmed HIV infection. The median time between visits was 12 months (IQR, 12–13 months; range, 10–20 months). Median follow-up time did not significantly differ between vaccinated and unvaccinated participants (P = .518).
Baseline Characteristics of GBM Aged 16–30 Years by Self-Reported HPV Vaccination Status (≥1 Dose) at Baseline, Engage Cohort Study, 2017–2019
| Characteristic | Overall (n = 248) | Unvaccinated (n = 139) | Vaccinateda (n = 109) | SDb |
|---|---|---|---|---|
| Age, median (IQR) | 26 (24–28) | 27 (24–29) | 26 (24–27) | 0.207 |
| Eligible for publicly funded HPV vaccine, n (%)c | 132 (53.2) | 61 (43.9) | 71 (65.1) | 0.437 |
| City, n (%) | ||||
| Montreal | 101 (40.7) | 60 (43.2) | 41 (37.6) | 0.113 |
| Toronto | 72 (29.0) | 38 (27.3) | 34 (31.2) | 0.085 |
| Vancouver | 75 (30.2) | 41 (29.5) | 34 (31.2) | 0.037 |
| Gender identity, n (%) | ||||
| Cisgender man | 234 (94.4) | 130 (93.5) | 104 (95.4) | 0.083 |
| Trans man | 3 (1.2) | 2 (1.4) | 1 (0.9) | 0.048 |
| Gender queer/nonconforming/other | 11 (4.4) | 7 (5.0) | 4 (3.7) | 0.067 |
| Sexual orientation, n (%) | ||||
| Gay | 210 (84.7) | 116 (83.5) | 94 (86.2) | 0.078 |
| Queer | 25 (10.1) | 14 (10.1) | 11 (10.1) | 0.001 |
| Bisexual | 6 (2.4) | 3 (2.2) | 3 (2.8) | 0.038 |
| Other | 7 (2.8) | 6 (4.3) | 1 (0.9) | 0.214 |
| Highest level of education, n (%) | ||||
| High school or less | 39 (15.7) | 20 (14.4) | 19 (17.4) | 0.083 |
| Postsecondary | 167 (67.3) | 90 (64.7) | 77 (70.6) | 0.126 |
| Graduate or professional degree | 42 (16.9) | 29 (20.9) | 13 (11.9) | 0.243 |
| Race/ethnicity, n (%) | ||||
| English/French Canadian or European | 165 (66.5) | 83 (59.7) | 82 (75.2) | 0.336 |
| Asian | 30 (12.1) | 21 (15.1) | 9 (8.3) | 0.215 |
| Black, African, Caribbean | 7 (2.8) | 4 (2.9) | 3 (2.8) | 0.008 |
| Indigenous | 3 (1.2) | 2 (1.4) | 1 (0.9) | 0.048 |
| Other or mixed | 43 (17.3) | 29 (20.9) | 14 (12.8) | 0.215 |
| Laboratory-confirmed HIV infection, n (%) | 13 (5.3) | 5 (3.6) | 8 (7.4) | 0.168 |
| Self-reported STBBI diagnosis, lifetime, n (%)d | 155 (63.0) | 72 (52.6) | 83 (76.1) | 0.508 |
| Smoking history, lifetime, n (%) | ||||
| Never smoker | 85 (34.4) | 44 (31.7) | 41 (38.0) | 0.133 |
| Current smoker | 108 (43.7) | 67 (48.2) | 41 (38.0) | 0.208 |
| Former smoker | 54 (21.9) | 28 (20.1) | 26 (24.1) | 0.095 |
| Alcohol risk, ASSIST, past 6 mo, n (%)e | ||||
| Lower risk | 166 (69.5) | 98 (73.1) | 68 (64.8) | 0.182 |
| Moderate risk | 69 (28.9) | 33 (24.6) | 36 (34.3) | 0.213 |
| High risk | 4 (1.7) | 3 (2.2) | 1 (1.0) | 0.103 |
| Any illicit drug use, lifetime, n (%) | 194 (79.5) | 106 (76.8) | 88 (83.0) | 0.155 |
| Cannabis use, lifetime n (%) | 202 (81.8) | 112 (80.6) | 90 (83.3) | 0.072 |
| Poppers use, lifetime, n (%) | 153 (62.4) | 79 (57.2) | 74 (69.2) | 0.249 |
| Has a regular current partner, n (%) | 118 (47.6) | 65 (46.8) | 53 (48.6) | 0.037 |
| Male anal sex partners, past 6 mo, n (%) | ||||
| 0–1 partner | 50 (20.2) | 34 (24.5) | 16 (14.7) | 0.248 |
| 2–5 partners | 92 (37.1) | 52 (37.4) | 40 (36.7) | 0.015 |
| 6–10 partners | 48 (19.4) | 30 (21.6) | 18 (16.5) | 0.129 |
| >10 partners | 58 (23.4) | 23 (16.5) | 35 (32.1) | 0.369 |
| Condomless receptive anal sex, past 6 mo, n (%) | 163 (65.7) | 86 (61.9) | 77 (70.6) | 0.186 |
| Rimming (received), past 6 mo, n (%) | 207 (83.5) | 112 (80.6) | 95 (87.2) | 0.180 |
| Fisting (received), past 6 mo, n (%) | 12 (4.8) | 5 (3.6) | 7 (6.4) | 0.130 |
| RDS network size, median (IQR)f | 30 (15–72.5) | 23 (10–50) | 40 (25–100) | 0.343 |
Abbreviations: GBM, gay, bisexual, and other men who have sex with men; HIV, human immunodeficiency virus; HPV, human papillomavirus; IQR, interquartile range; RDS, respondent-driven sampling; SD, standardized difference; STBBI, sexually transmitted and blood-borne infections.
Self-reported receipt of ≥1 lifetime dose of HPV vaccine at baseline.
Standardized differences calculated as the absolute value of the difference in means or proportions between vaccinated and unvaccinated participants in units of the pooled standard deviation. SDs ≤0.1 were considered negligible differences.
Based on age ≤26 years.
STBBIs included chlamydia, gonorrhea, syphilis, lymphogranuloma venereum, hepatitis A, B, or C, intestinal infections (eg, shigella, giardia), herpes simplex virus, or bacterial vaginosis; excludes HIV and anogenital warts.
Alcohol risk classified according to the World Health Organization Alcohol, Smoking and Substance Involvement Screening Test (ASSIST) scale as low (scores 0–10), moderate (scores 11–26), or high (scores ≥27) risk.
Based on response to: “How many men who have sex with men aged 16 years or older, including trans men, do you know who live or work in the [city] metropolitan area (whether they identify as gay or otherwise)? This includes gay/bi guys you see or speak to regularly, eg, close friends, boyfriends, spouses, regular sex partners, roommates, relatives, people you regularly hang out with, etc.” Values truncated at a minimum of 1 and a maximum of 150.
HPV Vaccination
Overall, 109 (44.0%) participants had received ≥1 HPV vaccine dose at baseline. Of those vaccinated, 15.2% received 1 dose, 22.2% 2 doses, and 62.6% 3 doses; 9.2% had an unknown number of doses. The median age at first dose was 24 years (IQR, 21–25 years). Almost half (48.1%) of vaccinated participants had been sexually active for more than 5 years prior to vaccination. Among participants who were unvaccinated at baseline, 33 out of 139 (23.7%) received ≥1 dose during 12-month follow-up, including 26 out of 61 (42.6%) participants aged ≤26 years and 7 out of 78 (9.0%) participants aged >26 years. After IPTW weighting, vaccinated and unvaccinated groups were similar in terms of their measured covariates (SD ≤ 0.2, with almost all variables having SD ≤ 0.1), suggesting that balance was achieved (Supplementary Table 2).
Incidence
Among 139 participants who were unvaccinated at baseline, 17 (12.2%) had ≥1 newly acquired 4vHPV type and 29 (20.9%) had ≥1 newly acquired 9vHPV type detected at their 12-month visit, corresponding to incidence rates of 10.4 (95% CI, 6.5–16.7) per 1000 person-months and 18.6 (95% CI, 13.0–26.8) per 1000 person-months, respectively (Table 2). Cumulative incidence in vaccinated participants was 8.3% for ≥1 4vHPV type, corresponding to a rate of 6.8 (95% CI, 3.5–13.1) per 1000 person-months, and 19.3% for ≥1 9vHPV type, corresponding to a rate of 16.9 (95% CI, 11.0–25.8) per 1000 person-months. Estimates were generally similar in sensitivity analyses applying RDS-II weights (Supplementary Table 3).
Twelve-Month Incidence and Persistence of Type-Specific Anal HPV Infection by Self-Reported Vaccination Status Among GBM Aged 16–30 Years, Engage Cohort Study, 2017–2021
| HPV Type | Unvaccinated (n = 139) | Vaccinateda (n = 109) | ||||||||
|---|---|---|---|---|---|---|---|---|---|---|
| No. (%) Persistent Infectionb | No. at Risk | No. (%) Cumulative Incidencec | PMd | Incidence Rate/1000 PM (95% CI) | No. (%) Persistent Infectionb | No. at Risk | No. (%) Cumulative Incidencec | PMd | Incidence Rate/1000 PM (95% CI) | |
| ≥1 HPV type | 50 (36.0) | 139 | 71 (51.1) | 1295.5 | 54.8 (44.0–68.2) | 53 (48.6) | 109 | 67 (61.5) | 957.0 | 70.0 (56.3–87.0) |
| ≥1 4vHPV type | 21 (15.1) | 139 | 17 (12.2) | 1633.0 | 10.4 (6.5–16.7) | 12 (11.0) | 109 | 9 (8.3) | 1322.5 | 6.8 (3.5–13.1) |
| HPV 6 | 6 (4.3) | 127 | 3 (2.4) | 1569.0 | 1.9 (.6–5.9) | 2 (1.8) | 101 | 2 (2.0) | 1275.0 | 1.6 (.4–6.3) |
| HPV 11 | 6 (4.3) | 125 | 2 (1.6) | 1555.5 | 1.3 (.3–5.1) | 1 (0.9) | 106 | 2 (1.9) | 1332.0 | 1.5 (.4–6.0) |
| HPV 16 | 9 (6.5) | 123 | 7 (5.7) | 1492.5 | 4.7 (2.2–9.8) | 7 (6.4) | 98 | 4 (4.1) | 1215.5 | 3.3 (1.2–8.8) |
| HPV 18 | 2 (1.4) | 136 | 5 (3.7) | 1667.0 | 3.0 (1.2–7.2) | 4 (3.7) | 103 | 2 (1.9) | 1293.0 | 1.5 (.4–6.2) |
| ≥1 other 9vHPV type | 6 (4.3) | 139 | 14 (10.1) | 1650.0 | 8.5 (5.0–14.3) | 6 (5.5) | 109 | 13 (11.9) | 1293.0 | 10.1 (5.9–17.3) |
| HPV 31 | 1 (0.7) | 137 | 0 (0.0) | 1718.0 | .0 | 0 (0.0) | 106 | 3 (2.8) | 1318.5 | 2.3 (.7–7.0) |
| HPV 33 | 0 (0.0) | 138 | 2 (1.4) | 1717.5 | 1.2 (.3–4.7) | 0 (0.0) | 108 | 5 (4.6) | 1333.5 | 3.7 (1.6–9.0) |
| HPV 45 | 2 (1.4) | 135 | 8 (5.9) | 1633.5 | 4.9 (2.5–9.8) | 1 (0.9) | 106 | 2 (1.9) | 1331.0 | 1.5 (.4–6.0) |
| HPV 52 | 2 (1.4) | 131 | 3 (2.3) | 1621.5 | 1.9 (.6–5.7) | 2 (1.8) | 103 | 4 (3.9) | 1283.0 | 3.1 (1.2–8.3) |
| HPV 58 | 3 (2.2) | 134 | 2 (1.5) | 1669.0 | 1.2 (.3–4.8) | 3 (2.8) | 104 | 2 (1.9) | 1305.5 | 1.5 (.4–6.1) |
| ≥1 9vHPV type | 26 (18.7) | 139 | 29 (20.9) | 1555.0 | 18.6 (13–26.8) | 16 (14.7) | 109 | 21 (19.3) | 1246.0 | 16.9 (11.0–25.8) |
| ≥1 non-9vHPV type | 38 (27.3) | 139 | 60 (43.2) | 1363.0 | 44.0 (34.5–56.2) | 45 (41.3) | 109 | 57 (52.3) | 1021.0 | 55.8 (43.7–71.4) |
4vHPV types include HPV 6/11/16/18; 9vHPV types include HPV 6/11/16/18/31/33/45/52/58.
Abbreviation: CI, confidence interval; GBM, gay, bisexual, and other men who have sex with men; HPV, human papillomavirus; PM, person-months.
Self-reported receipt of ≥1 lifetime dose of HPV vaccine at baseline.
Number and % of participants who had type-specific anal HPV DNA detected at both their baseline and 12-month visit.
Number and % of participants who had a new detection of type-specific anal HPV DNA at their 12-month visit among those who were negative for that type at baseline (ie, new infections/at risk).
Person-time calculated as the number of months from baseline to the midpoint of the baseline visit and 12-month visit for participants who had the event of interest.
Cumulative incidence did not significantly differ between vaccinated and unvaccinated participants. In the IPTW-weighted model, PRs were 0.56 (95% CI, .24–1.31) for ≥1 4vHPV type and 0.80 (95% CI, .43–1.49) for ≥1 9vHPV type (Figure 2). Point estimates were lower and statistically significant among participants who were sexually active for ≤5 years before vaccination at 0.15 (95% CI, .03–.68) and 0.37 (95% CI, .16–.86), respectively. They were also lower among participants who received their first vaccine dose at age ≤23 years, but associations failed to reach statistical significance. The type-specific estimate for HPV 16, which was the most prevalent HPV type in our sample, was 0.68 (95% CI, .18–2.52). Lower point estimates (corresponding to higher VE) were observed when vaccination status was assessed at 12-month follow-up (Supplementary Table 4).
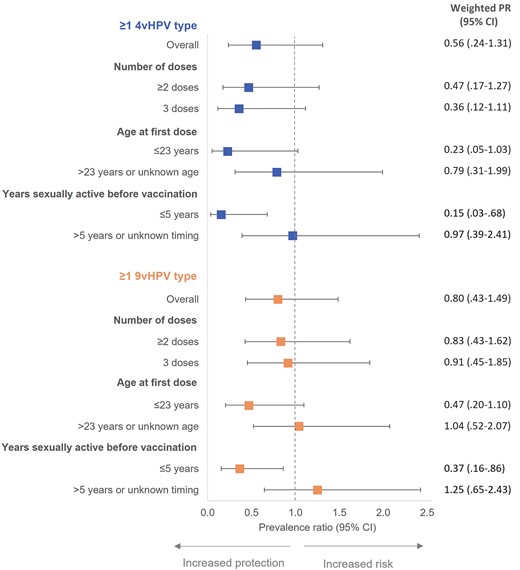
IPTW-weighted prevalence ratios for 12-month cumulative incidence of anal HPV infection comparing vaccinated to unvaccinated GBM aged 16–30 years, Engage Cohort Study, 2017–2021. 4vHPV types include HPV 6/11/16/18; 9vHPV types include HPV 6/11/16/18/31/33/45/52/58. Models weighted using IPTW derived from propensity score model. Abbreviations: 4vHPV, quadrivalent vaccine; 9vHPV, 9-valent vaccine; CI, confidence interval; GBM, gay, bisexual, and other men who have sex with men; HPV, human papillomavirus; IPTW, inverse probability of treatment weights; PR, prevalence ratio.
Persistence
Sixty-one (24.6%) participants had ≥1 4vHPV type detected at baseline. Of these, 33 (13.3% overall or 54.1% among prevalent infections) remained infected with ≥1 4vHPV type at their 12-month visit, including 21 (15.1%) unvaccinated and 12 (11.0%) vaccinated participants (Table 2). Similarly, 42 out of 84 participants who had ≥1 9vHPV type detected at baseline remained infected at their 12-month visit (16.9% overall or 50.0% among prevalent infections), including 26 (18.7%) unvaccinated and 16 (14.7%) vaccinated participants. HPV 16 caused the greatest number of persistent infections in both unvaccinated and vaccinated participants.
Persistent infection did not significantly differ between vaccinated and unvaccinated participants. In the IPTW-weighted model, PRs were 0.53 (95% CI, .25–1.14) for ≥1 4vHPV type and 0.65 (95% CI, .33–1.27) for ≥1 9vHPV type (Figure 3). Point estimates were lower and statistically significant among participants who received their first vaccine dose at age ≤23 years at 0.08 (95% CI, .01–.59) and 0.07 (95% CI, .01–.49), respectively. Estimates were also lower for those who were sexually active for ≤5 years before vaccination but were only statistically significant for 4vHPV types (PR = .12, 95% CI, .03–.54). For HPV 16, the estimate was 0.56 (95% CI, .18–1.73).
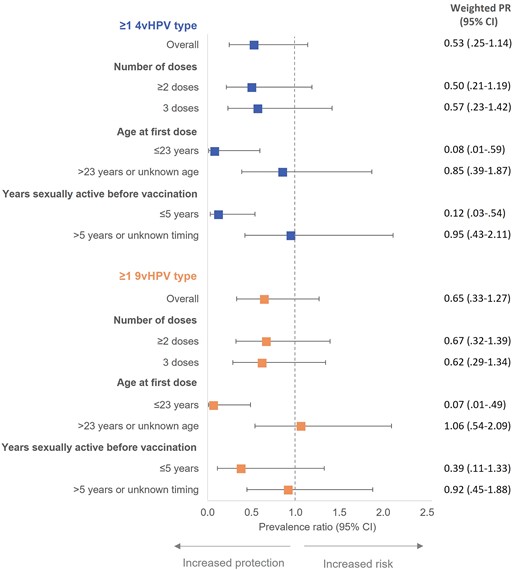
IPTW-weighted prevalence ratios for 12-month persistence of anal HPV infection comparing vaccinated to unvaccinated GBM aged 16–30 years, Engage Cohort Study, 2017–2021. 4vHPV types include HPV 6/11/16/18; 9vHPV types include HPV 6/11/16/18/31/33/45/52/58. Models weighted using IPTW derived from propensity score model. Abbreviations: 4vHPV, quadrivalent HPV vaccine; 9vHPV, 9-valent HPV vaccine; CI, confidence interval; GBM, gay, bisexual, and other men who have sex with men; HPV, human papillomavirus; IPTW, inverse probability of treatment weights; PR, prevalence ratio.
DISCUSSION
In a community-recruited cohort of sexually active GBM aged 16–30 years, we found that HPV vaccination was effective at preventing 12-month incident or persistent infection with vaccine-preventable types when vaccine was administered within 5 years after first anal sex. It was also effective at preventing persistent infection when vaccine was initiated at age ≤23 years. We did not observe a statistically significant difference in cumulative incidence or persistence between vaccinated and unvaccinated men independent of age at first vaccination or vaccination timing relative to sexual activity. However, point estimates for almost all PRs in propensity score-weighted models were less than one, suggestive of vaccine benefit in this real-world setting. Our limited sample size likely contributed to these statistically nonsignificant results.
Our overall VE of 44% (95% CI, −31% to 76%) against cumulative incidence and 47% (95% CI, −14% to 75%) against persistent infection with ≥1 4vHPV type are comparable to the clinical trial of GBM [14]. In that trial, vaccine efficacy for incident and persistent infection was 49% (95% CI, 32%–61%) and 59% (95% CI, 43%–71%), respectively, among GBM who received ≥1 dose and may have had prior exposure to HPV before vaccination [14]. Most participants in our cohort were likely exposed to HPV prior to vaccination [17], precluding direct comparison to the trial where participants were younger (aged 16–26 years), had ≤5 lifetime sexual partners, and no prior history of HPV disease or HIV infection. Although emerging evidence suggests some benefit of catch-up vaccination even in those previously exposed to HPV [44], we would anticipate VE to be lower in this real-world context. HPV vaccination is not approved for therapeutic indications [12], and most men will acquire at least 1 HPV infection within 2–4 years of sexual debut [45].
As expected, our overall VE estimates against 12-month incidence and persistence are higher than VE against prevalence outcomes in both Canadian (27%) and US (29%) samples of young, sexually active GBM [15, 17]. Consistent with prior observational studies [15–17], we found higher VE (indicating better protection) for participants who initiated vaccination at younger ages. Among participants who received their first dose at age ≤23 years, VE was 77% (95% CI, −3% to 95%) against cumulative incidence and 92% (95% CI, 41%–99%) against persistent infection with ≥1 4vHPV type. As in the clinical trial [14], we found slightly higher VE against the more clinically relevant outcome of HPV persistence than incidence [18, 19].
Our findings support national guidelines that recommend HPV vaccination at younger ages, ideally prior to onset of sexual activity, for optimal protection [12]. Even before the COVID-19 pandemic, HPV vaccine uptake through school-based, gender-neutral programs in Canada was suboptimal (60%–70% coverage) [13]. Men in our study were ineligible for these universal programs, which were implemented during the 2016/2017 or 2017/2018 school years [46]. This suggests that many birth cohorts continue to remain at risk, reinforcing the need for targeted HPV vaccination policies for GBM. Most Canadian provinces currently offer free HPV vaccine to young men aged ≤26 years who self-identify as GBM [13]. Although guidelines state that HPV vaccine should be strongly considered for GBM aged ≥27 years given their increased risk of HPV-related disease [12], the effectiveness of HPV vaccination in this older age group remains unclear [16]. Immunogenicity of HPV vaccine in men aged 27–45 years has been demonstrated [47]; however, further studies to determine clinical benefit and cost effectiveness of vaccination in this age group are needed [48].
As this was an observational study, vaccinated participants differed from unvaccinated participants on several factors, including sexual behaviors that may increase their risk of HPV exposure. Indeed, we observed higher 12-month incidence and persistence of non-vaccine–preventable types in vaccinated compared with unvaccinated men, suggesting that crude VE estimates are biased toward the null. We used a propensity score approach to achieve balance in measured confounders between vaccination groups, but acknowledge that some residual confounding may remain.
This study has other limitations. We had higher than expected attrition and suboptimal specimen validity, which contributed to our limited sample size. Although we included only men who remained under active follow-up and provided ≥2 valid anal specimens, HPV vaccine uptake was similar for participants who were lost to follow-up or with <2 valid anal specimens, suggesting that selection biases were minimal. Although our 12-month definition of persistence is conservative and more likely to capture nontransient infections than shorter intervals [7], some outcomes may have been misclassified. We were unable to differentiate persistent infection from recurrent infection or reactivation of a latent infection [38, 49]. However, our estimates in unvaccinated men are comparable to those among HIV-negative GBM in the pre-HPV vaccine era [7, 8, 36–38, 50]. Timing of vaccination relative to HPV acquisition was unknown, potentially resulting in misclassification of vaccination status for unvaccinated participants who received ≥1 dose during follow-up and whose vaccination date preceded incident HPV acquisition. Finally, participants were recruited using RDS such that participants with larger social networks may be overrepresented, which can bias estimates if the network degree is strongly correlated with HPV vaccination and/or infection [42, 43]. For this reason, we accounted for self-reported RDS network size in the propensity score model, but otherwise report RDS-unweighted statistics [34].
Our findings contribute real-world evidence of VE against clinically relevant HPV outcomes among GBM. We observed significant VE against 12-month anal HPV cumulative incidence and persistence among men who received their first dose of HPV vaccine at younger ages or initiated vaccination soon after sexual debut. Further research is needed to provide definitive conclusions for men vaccinated at older ages and/or after many years of sexual activity. Public health efforts should focus on improving HPV vaccine uptake among school-aged youth through universal programs, alongside current targeted programs for younger GBM.
Supplementary Data
Supplementary materials are available at The Journal of Infectious Diseases online. Consisting of data provided by the authors to benefit the reader, the posted materials are not copyedited and are the sole responsibility of the authors, so questions or comments should be addressed to the corresponding author.
Notes
Acknowledgments. The Engage Study (https://www.engage-men.ca/) is led by Principal Investigators in Toronto, Daniel Grace and Trevor Hart; Montreal, Joseph Cox and Gilles Lambert; and Vancouver, Jody Jollimore, Nathan Lachowsky, and David Moore. We thank the Engage Study participants, clinical and research staff, and Community Engagement Committee members, as well as our community partner agencies. We specifically thank Ms Julie Guenoun at CHUM at the Université de Montréal for conducting the HPV laboratory testing and Dr Shayna Sparling at Toronto Metropolitan University for national site coordination, as well as Dr Anna Yeung and Ms Ashley Mah with the ESTIMATE Lab at Unity Health Toronto for research management and coordination of the Engage-HPV substudy. We also acknowledge the Applied Health Research Centre at St Michael's Hospital for data management. Study data were collected and managed using REDCap electronic data capture tools.
Financial support. This work in the Engage Study was supported by the Canadian Institutes for Health Research (CIHR; grant numbers PJT-153364, FDN-143342, and PJT-153139); Canadian Blood Services (grant number MSM2017LP-OD); and the CIHR Canadian HIV/AIDS Trails Network (grant number CTN300). The Engage-HPV substudy was supported by CIHR (grant number 148432 Foundation Grant to A. N. B.). The Engage-HPV 12-month follow-up study was supported by the Cancer Research Society and CIHR Institute of Cancer Research (Operating Grant; grant number 24103 to A. N. B.). Quality assurance and control of HPV testing was supported by the Fonds de Recherche du Québec-Santé HIV/AIDS network. C. C. is a Vanier scholar supported by CIHR (grant number 415141). T. G. supported by a Health Professional Investigator Award from the Michael Smith Foundation for Health Research. T. A. H. is supported by a Chair in Gay and Bisexual Men's Health from the Ontario HIV Treatment Network. D. M. M. and N. J. L. are supported by scholar awards from the Michael Smith Foundation for Health Research (grant numbers 5209 and 16863). D. G. is a Canada Research Chair in Sexual and Gender Minority Health. R. G. is supported by a Canadian Immunization Research Network Trainee Scholarship. G. O. is a Canada Research Chair in Global Control of HPV-Related Disease and Cancer. D. H. S. T. is a Canada Research Chair in HIV Prevention and Sexually Transmitted Infection Research. A. N. B. is a Canada Research Chair in Sexually Transmitted Infection Prevention and a recipient of a University of Toronto Department of Family and Community Medicine nonclinician scientist award.
Presented in part: International Papillomavirus Conference, November 2021, virtual.
References
Author notes
Potential conflicts of interest. J. C. declares research funding from ViiV Healthcare and Gilead Sciences; and remuneration for advisory work from ViiV Healthcare, Gilead Sciences, and Merck Canada. F. C. received grants paid to the institution for research projects from Roche Diagnostics, Becton Dickinson, and Merck Sharp and Dome; honorariums for presentations from Merck Sharp and Dome and Roche diagnostics; and has participated in an expert group for Merck Sharp and Dome. C. S. received grants paid to the institution for clinical trials and epidemiological studies funded by nonprofit organizations Ministère de la Santé et des Services Sociaux in Québec, Bill and Melinda Gates Foundation, and Michael Smith Foundation. D. H. S. T. received grants paid to the institution for investigator-initiated research from Abbvie, Gilead, and ViiV Healthcare; and D. H. S. T.'s institution has received support for industry-sponsored clinical trials from Glaxo Smith Kline. S. L. D. is the current Chair of the National Advisory Committee on Immunization. C. S. is a member of the Québec Immunization Committee. All other authors report no potential conflicts.
All authors have submitted the ICMJE Form for Disclosure of Potential Conflicts of Interest. Conflicts that the editors consider relevant to the content of the manuscript have been disclosed.

