


Abstract
Despite effective prevention approaches, ongoing human immunodeficiency virus 1 (HIV-1) transmission remains a public health concern indicating a need for identifying its drivers.
We combined a network-based clustering method using evolutionary distances between viral sequences with statistical learning approaches to investigate the dynamics of HIV transmission in the Swiss HIV Cohort Study and to predict the drivers of ongoing transmission.
We found that only a minority of clusters and patients acquired links to new infections between 2007 and 2020. While the growth of clusters and the probability of individual patients acquiring new links in the transmission network was associated with epidemiological, behavioral, and virological predictors, the strength of these associations decreased substantially when adjusting for network characteristics. Thus, these network characteristics can capture major heterogeneities beyond classical epidemiological parameters. When modeling the probability of a newly diagnosed patient being linked with future infections, we found that the best predictive performance (median area under the curve receiver operating characteristic AUCROC = 0.77) was achieved by models including characteristics of the network as predictors and that models excluding them performed substantially worse (median AUCROC = 0.54).
These results highlight the utility of molecular epidemiology-based network approaches for analyzing and predicting ongoing HIV transmission dynamics. This approach may serve for real-time prospective assessment of HIV transmission.
Since the peak of the global human immunodeficiency virus 1 (HIV-1) epidemic in the mid-1990s, the worldwide HIV-incidence has been declining [1] and continuous efforts to diagnose, counsel, and treat people with HIV (PWH) have contributed to this trend. Large-scale efforts have been undertaken to reach the ambitious UNAIDS 90-90-90 goal, consisting of 90% of all PWH knowing of their status, 90% of these people receiving antiretroviral treatment (ART), and 90% of PWH on ART having undetectable plasma viral load by the year 2020 [2], although this goal was ultimately not met in the majority of countries. Other studies have shown that the strategy of treatment as prevention is effective at lowering the number of new HIV infections and that the use of preexposure prophylaxis for at-risk persons further compounds this effect [3–6]. However, transmission of HIV is still ongoing, with an estimated 1.5 million new infections occurring in 2020 [7]. To achieve the goal of stopping the spread of HIV, there is a need to better characterize patients who contribute to transmission and to develop approaches that can be applied to inform targeted preventive measures [8].
Approaches from molecular epidemiology have provided major insights into different aspects of HIV transmission, both on the level of individual cases and large-scale transmission networks [9–14]. In this context, viral sequences are typically used to build phylogenetic trees, based on the rationale that sequences from patients who belong to the same transmission chain share a common ancestor and hence form subtrees [15]. While these approaches have led to important insights into HIV transmission, they have limitations in the context of assessing the temporal growth of transmission chains and for potential real-time uses of molecular epidemiology to identify foci of ongoing HIV transmission. These limitations include computation time and the sensitivity of phylogenetic trees to the addition of new sequence data. Indeed, updating the phylogenetic tree by adding new sequences over time can alter the topology of the resulting tree: the newly defined clusters are not always strict supersets of the clusters found at a previous time point, which complicates the identification and long-term analysis of some clusters. For example, in Bachmann et al [4], we were able to quantify growth rates of clusters of men who have sex with men (MSM) in Switzerland using a phylogenetic clustering approach. However, as clustering patterns were not always consistent across years, this analysis had to be restricted to those clusters showing a minimal overlap with the preexisting clusters from the previous year, thereby potentially causing selection bias (excluding unstable clusters) and complicating the study of long-term cluster growth.
Evolutionary-distance-based networks have been proposed and used as an alternative to infer transmission chains [16–18]. While this approach ignores the inference of common ancestry inherent in phylogenetic trees, it results in more robust clusters that are less sensitive to the addition of new patients. This substantially reduces computation time, particularly in the context of repeatedly updating clustering analyses in real time. Moreover, distance-based clustering was noninferior to phylogenetic approaches both in simulation studies and empirical assessment of the overlap between clusters and contact networks [19, 20]. Finally, the distance network approaches are more directly amenable to the application of tools and metrics from network science. We therefore adapted one such distance-based clustering mechanism implemented in HIV-Transmission Cluster Engine (HIV-TRACE) [16] and combined it with statistical learning approaches in the context of the Swiss HIV Cohort Study (SHCS) to assess its ability to analyze cluster growth dynamics in the Swiss HIV epidemic, as well as the predictive capabilities that can be achieved in this framework.
METHODS
Swiss HIV Cohort Study
The SHCS is a prospective, multicenter cohort study that covers an estimated 53% of all HIV diagnoses ever issued and an estimated 80% of all HIV–positive MSM in Switzerland [21]. The 13 299 analyzed sequences were obtained from genotypic drug resistance tests that have been performed up to 31 December 2020, each sequence being the earliest available of the corresponding patient. The SHCS was approved by the local ethical committees of the participating centers, and written informed consent was obtained from all participants.
Sequences and Clustering
HIV pol sequences from resistance tests of patients enrolled in the SHCS were used in the clustering, which was performed using HIV-TRACE [16]. HIV-TRACE performs pairwise sequence alignment, during which insertions and deletions relative to the reference are discarded, pairwise distance calculation based on the Tamura-Nei 93 distance criterion [22], and subsequent clustering of sequences with a genetic distance smaller than 0.01. The genetic distance threshold was chosen with the aim of maximizing the number of clusters and therefore the resolution of our analyses, while staying within the realm of previously applied thresholds in studies on HIV pol [19, 23, 24] (Supplementary Figure 1). A comparison of cluster growth rates for genetic distance thresholds between 0.005 and 0.015 is shown in Supplementary Table 1. The pol gene of the reference HIV genome HXB2 (GenBank accession number K03455.1) was used as the reference sequence. For the purposes of this study, a node represents a single HIV pol sequence and therefore one patient, while a cluster is defined as a connected component in the network produced by this method. By this definition, a cluster has at least two members and an unconnected node is not part of any cluster.
Data Management and Cluster Analysis
Data management was performed in 2 steps: First, we parsed the outputs of HIV-1-TRACE, calculated statistics of interest (Table 1) for clusters and nodes, and linked the sequences to patient information from the SHCS, using Python 3.8. Graph-theoretical analysis of the clusters was performed using igraph 0.8.3 for Python [25]. Second, further analyses and visualizations were performed using R version 4.0.5 [26] and the package ggplot [27].
Network Properties That Were Calculated for Clusters and Nodes
| Variable | Object | Description |
|---|---|---|
| Node degree | Node | Number of links |
| Past node growth | Node | Number of links gained over the past 3 years |
| Future node growth | Node | Number of links gained over the next 3 years |
| Closeness | Node | (n − 1)/(Σin pi), where n is the number of nodes in the cluster and pi is the shortest path from the node of interest to node i |
| Betweenness | Node | Number of shortest paths between each pair of nodes in the cluster that pass through the node of interest |
| Cluster size | Cluster | Number of nodes in the cluster |
| Past cluster growth | Cluster | Number of nodes gained over the past 3 years |
| Future cluster growth | Cluster | Number of nodes gained over the next 3 years |
| Density | Cluster | m/(n × (n − 1)/2), where m is the total number of links and n is the total number of nodes in the cluster |
| Transitivity | Cluster | Probability of 2 neighbors of the same node being linked directly |
| Median degree | Cluster | Median of all node degrees in the cluster |
| Median distance | Cluster | Median Tamura-Nei 93 distance of all the links in the cluster |
| Median closeness | Cluster | Median of the node closenesses |
| Median betweenness | Cluster | Median of the node betweennesses |
Cluster- and Node-Level Growth Modeling
We used Poisson regression to model the number of nodes acquired in each cluster from 2014 to 2017 and assess factors associated with cluster growth. One considered factor was the past cluster growth (defined as the change in cluster size from 2011 to 2014). We used logistic regression to model the acquisition of new links of individual nodes within the first 3 years of being enrolled in the cohort (with a binary outcome variable). We included variables that have been found to be predictive of cluster growth or clustering in similar work [4, 19, 28], such as age, sex, CD4-cell count, virus load, and transmission risk factor. More details on the models and included variables can be found in the Supplementary Material.
Cross-Validation
To predict whether a node will acquire a new link in the following 3 years, we compared logistic regressions and classification random forests [29] built on several subsets of variables. For each set of predictors, a logistic regression model and a random forest model were trained on the same training data. To supplement the sets of predictors manually chosen, we also employed a method of automated variable selection implemented in variable selection using random forests (VSURF) [30]. For more detailed information on the methods employed, please refer to the “Methods” section in the Supplementary Material.
RESULTS
Analyzing a total of 13 299 sequences with the distance-based clustering algorithm yielded a total of 998 clusters that were highly robust over the observed time frame, making it possible to assess the dynamics of the clusters and their constituent nodes over the 13 year-long period (Supplementary Figures 2–4). Out of the 13 299 included sequences, 4074 (30.6%) clustered with at least one other sequence at the time of sampling. At the last observed time point (31 December 2020), 5415 (40.7%) of all sequences were linked to at least one other sequence. We found that although intravenous (IV)-drug users represented 2572 (19.3%) of the total number of sequences, they constituted 29% of the clustered sequences (Table 2). On the other hand, patients in the heterosexual acquisition risk category represented 4782 (36%) of the total number of sequences but only 25% of the clustered sequences, indicating potentially less frequent transmission in this subpopulation (Pχ2 < .001).
Characteristics of the Patients Whose HIV-Pol Sequences Were Used in the Analysis
| Characteristic | Clustereda (n = 4074) | Not Clustereda (n = 9225) | All (n = 13 299) |
|---|---|---|---|
| Age, ya | |||
| ȃMean (SD) | 37.3 (9.73) | 38.7 (10.7) | 38.3 (10.4) |
| ȃMedian (Q1, Q3) | 36 (31, 42) | 37 (31, 45) | 37 (31, 44) |
| Sex, No. (%) | |||
| ȃFemale | 899 (22.1) | 2844 (30.8) | 3743 (28.1) |
| ȃMale | 3175 (77.9) | 6381 (69.2) | 9556 (71.9) |
| Acquisition risk group, No. (%) | |||
| ȃMSM | 1751 (43.0) | 3588 (38.9) | 5339 (40.1) |
| ȃHeterosexuals | 1017 (25.0) | 3765 (40.8) | 4782 (36.0) |
| ȃIntravenous-drug users | 1180 (29.0) | 1392 (15.1) | 2572 (19.3) |
| ȃUnknown | 126 (3.1) | 480 (5.2) | 606 (4.6) |
| RNA concentrationb | |||
| ȃMedian, copies/mL (Q1, Q3) | 27 162 (3345, 110 023) | 15 900 (790, 87 078) | 19 605 (1260, 95 938) |
| ȃMissing, No. (%) | 686 (16.8) | 2054 (22.3) | 2740 (20.6) |
| CD4 cell countb | |||
| ȃMedian, cells/μL (min, max) | 379 (222, 568) | 340 (180, 527) | 350 (191, 540) |
| ȃMissing, No. (%) | 68 (1.7) | 184 (2.0) | 252 (1.9) |
Abbreviation: MSM, men who have sex with men.
At the time when the sample for the genotypic resistance test was taken.
At the follow-up visit closest to the sampling for the genotypic resistance test.
Most clusters had less than 10 nodes at the end of 2020 (943/998, 94.5%). The largest identified cluster contained 1577 nodes, 43.7% of which were categorized as IV-drug users, and 24.0% of which were categorized as heterosexuals.
The obtained clusters exhibited a large heterogeneity in terms of composition, size, and growth patterns (Figure 1 and Figure 2; and Supplementary Figures 4–7). Of 575 clusters identified up to 31 December 2007, only 134 (23.3%) gained any new nodes in the following 13 years, of which only 33 (5.7%) gained 5 or more new nodes (Figure 2A). Despite the small fraction of clusters that gained 5 or more nodes, they accounted for 443 (70.9%) of all 625 nodes that were gained by all 575 clusters collectively. The clusters that gained 5 or more nodes were disproportionately MSM clusters (27 of 33, 81.8%). We found a strong correlation between cluster size in 2007 and number of new nodes acquired up to 2020 (Spearman r = 0.72, P < .001; Figure 2A). Similarly, of the 9308 SHCS patients with sequences sampled as of 2007, only 1079 (11.6%) gained links to new sequences up to the year 2020 (Figure 2B). Most patients that acquired new links only gained very few: only 206 (2.2%) gained links to 3 or more new sequences, and they accounted for 1103 (50.4%) of the total 2190 new links over the studied period.
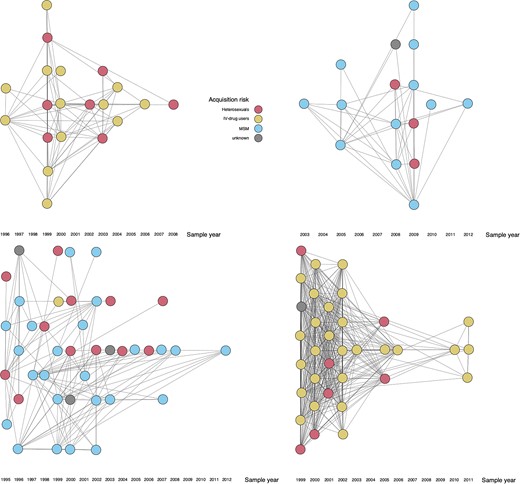
Graph representations of 4 different clusters (for a larger selection of clusters, see Supplementary Figure 7). Each node represents a single patient. Two linked nodes are patients whose HIV pol sequences have a Tamura-Nei 93 genetic distance of less than or equal to 0.01. The sample year refers to the year when the sample for the genotypic drug resistance test was taken. A small amount of noise was added to the coordinates of each node for better readability of clusters with many overlapping links. Abbreviation: MSM, men who have sex with men.
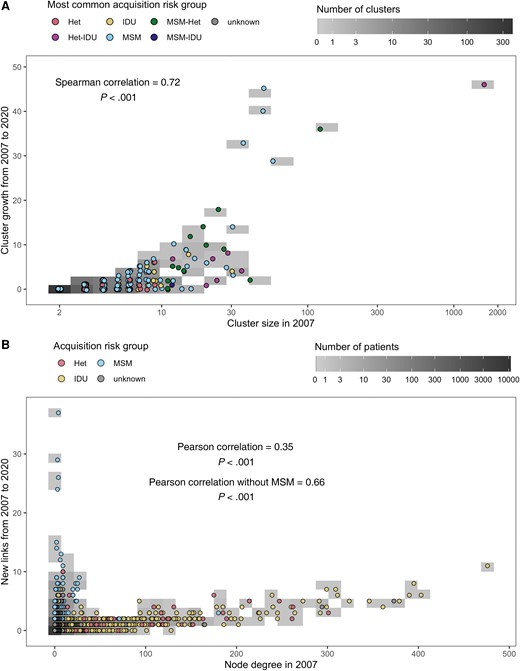
A, Cluster growth from 31 December 2007 to 31 December 2020 as a function of cluster size in 2007. Clusters where the most common acquisition risk group did not constitute >50% of all members were assigned to a combined (hyphenated) category consisting of the 2 most common risk groups in alphabetical order. B, Node growth from 31 December 2007 to 31 December 2020 as a function of node degree, that is, the number of links, in 2007. Abbreviations: Het, heterosexuals; IDU, intravenous drug users; MSM, men who have sex with men.
When modeling cluster growth using Poisson regression (with log10 cluster size in the year 2014 as an offset), we found that past growth of a cluster was a good predictor for future growth (Figure 3A; adjusted incidence rate ratio [aIRR], 5.11 [95% confidence interval, 95% CI, 2.62–9.95] and aIRR, 11.03 [95% CI, 6.44–18.88] for past cluster growth of 2–3 and ≥4, respectively). Besides past growth, no other variable yielded a statistically significant estimate in the multivariable model. Clusters with older individuals had lower growth rates in the univariable models (aIRR, 0.62 [95% CI, .42–.91] and aIRR, 0.17 [95% CI, 0.11–0.29] for median ages 40–49 and ≥50 years, respectively), as did clusters made up of mostly heterosexuals (aIRR, 0.38 [95% CI, .24–.60]), clusters with more than 90% virally suppressed patients (aIRR, 0.48 [95% CI, .37–.62]), and clusters with high rates of condom use with occasional partners (aIRR, 0.15 [95% CI, .07–.31]). On the other hand, clusters with more patients using non-IV drugs had significantly higher growth rates in the univariable model (aIRR, 2.18 [95% CI, 1.41–3.37]). This indicates that the effect of these variables can be captured by including past cluster growth as a proxy for behavioral and demographic risk factors. Similar results were obtained when restricting the analysis to clusters where MSM was the most common acquisition risk category (Supplementary Figure 8) and when varying the time period considered (Supplementary Figures 9–12).
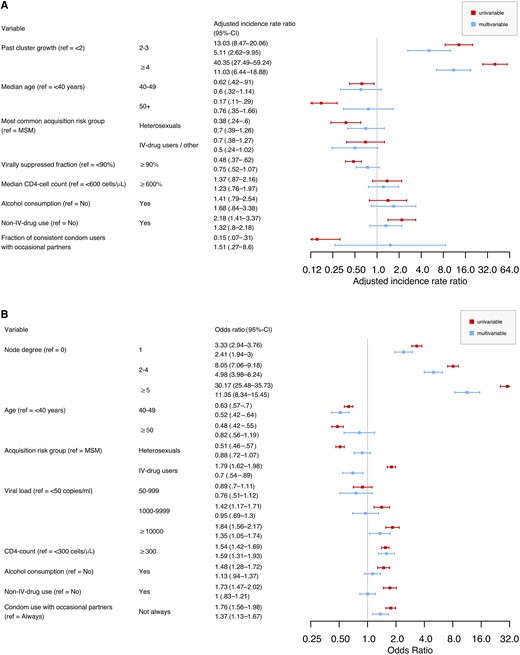
A, Factors associated with the number of nodes gained by a cluster over the span of 3 years, as assessed by a Poisson regression model. Parameters estimated and 95% CI from univariable and multivariable regressions are represented. Past cluster growth was calculated as the number of nodes gained from 31 December 2011 to 31 December 2014, and future cluster growth was calculated as the number of nodes gained from 31 December 2014 to 31 December 2017. B, Factors associated with the gain of new links for a node within 3 years, as modeled by a logistic regression. Odds ratio and 95% CI from univariable and multivariable models are represented. The outcome was a binary variable based on the number of links gained in the first 3 years after the date of the genotypic resistance test. Abbreviations: CI, confidence interval; IV, intravenous; MSM, men who have sex with men; ref, reference.
To quantify the relevant factors of growth at the individual node level, that is, a node's risk of acquiring new links over time, we specified a logistic regression model where we used a similar set of variables for predicting the addition of new links to a given node within 3 years of being sequenced (Figure 3B). Node degree had a significant effect on the outcome, with larger node degrees being associated with higher probabilities to gain new links (odds ratio [OR], 2.41 [95% CI, 1.94–3.00], OR, 4.98 [95% CI, 3.98–6.24], and OR, 11.35 [95% CI, 8.34–15.45] for node degree 1, 2–4, and ≥5, respectively). Accordingly, removing node degree from the regression model led to a significantly worse model fit (likelihood ratio test, P < .001). In other words, the growth of the network occurs by preferential attachment, meaning more connected nodes acquire more new links, which also explains the approximately scale-free pattern observed for the degree distribution of the whole network (Supplementary Figure 13). Besides node degree, several epidemiological and virological factors were associated with acquisition of new links: patients between 40 and 49 years old were at a significantly lower risk than younger patients (OR, 0.52 [95% CI, .42–.64]), as were IV-drug users compared to MSM (OR, 0.70 [95% CI, .54–.89]). Viral loads above 10 000 copies/mL were associated with the gain of new links (OR, 1.35 [95% CI, 1.05–1.74]), as were CD4 cell counts above 300 cells/µL (OR, 1.59 [95% CI, 1.31–1.93]) and inconsistent condom use with occasional partners (OR, 1.37 [95% CI, 1.13–1.67]). Restricting the analysis to MSM patients yielded similar results (Supplementary Figure 14), as did adding the enrolment year as a linear effect (Supplementary Figure 15) and random subsampling of 75% or 50% of the available sequences (Supplementary Figures 16 and 17).
Model Comparison
We trained multiple models using 5 different sets of predictors (specified in Table 3 and Supplementary Table 2) with the goal of identifying the best model for predicting whether a certain node is going to acquire a link to a new node within 3 years. To assess the performance of these models, we performed a 10-fold cross-validation and compared the median areas under the curve (AUCs) of the receiver operating characteristic (ROC)-curves based on the model predictions.
Predictor Sets Used in the Model Comparison
| Predictor Set | Network-Based Predictors | Demographical Predictors | Clinical Predictors |
|---|---|---|---|
| Mix | Node degree, past cluster growth, cluster size | Acquisition risk group, registration center, age, sex | RNA concentration |
| Cluster | Node degree, past cluster growth, cluster size, median closeness in the cluster, node closeness, cluster density, median distance in the cluster | None | None |
| Patient | None | Acquisition risk group, registration center, age, sex | RNA concentration |
Mix, cluster, and patient are predictor sets with mixed, only cluster-based predictors, and only demographical and clinical predictors, respectively. The model comparison further included 2 predictor sets generated with automatic variable selection algorithm, which are described in Supplementary Table 2.
Among models with preselected predictor sets (Table 3), models that used both network and patient characteristics yielded the most accurate predictions (Figure 4). Random forests and logistic regression models performed similarly in all cases except one. Notably, restricting the set of predictors to demographical and clinical variables (patient predictor set) resulted in a large drop in accuracy: from the mix to the patient predictor set, the median AUC decreased from 0.78 to 0.67 for the logistic regression and from 0.76 to 0.55 for the random forest. On the other hand, restricting the set of predictors to variables pertaining to the topological characteristics of clusters and nodes (cluster predictor set) did not decrease accuracy to the same degree, as the median AUC was 0.76 both for the logistic regression and the random forest. Accordingly, variables with the highest variable importance in the mix random forest model were cluster characteristics, namely node degree, past cluster growth, and cluster size (Supplementary Figure 18).
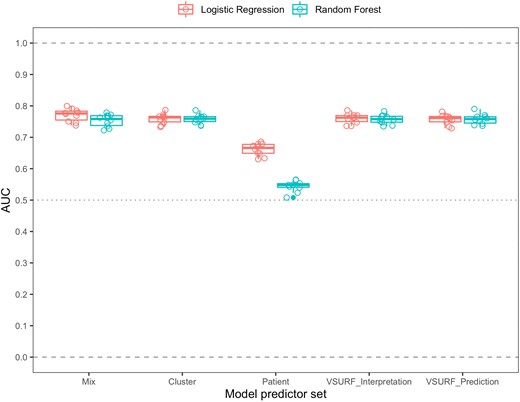
Comparison of the predictive abilities of 12 different classification models. These models are based on the combination of 5 different sets of predictors (described in Table 3 and Supplementary Table 2) with 2 different modeling methods: logistic regression and random forest. Each one of these combinations was assessed in a 10-fold cross-validation. Predictive ability was assessed by comparing the areas under the curve (AUCs) of the receiver operator characteristic (ROC) curves of the models.
Additionally, we identified 2 more subsets of predictors using variable selection using random forests (VSURF) [30]. From a mix of demographic, clinical, and cluster topology-related predictors VSURF repeatedly selected only the latter category of variables (Supplementary Table 2). The performance of random forests based on the variables selected by VSURF was similar to the mix and cluster models, with median AUCs of 0.77 and 0.74 for VSURF_interpretation and VSURF_prediction, respectively (Figure 4). ROC curves for each model are displayed in Supplementary Figure 19.
DISCUSSION
Here we combined the evolutionary-distance-based clustering method HIV-TRACE [16] with longitudinal cohort data and statistical learning approaches to analyze cluster growth dynamics in the Swiss HIV Cohort study. In concordance with previous work [4], we found that, in the timespan from 2007 to 2020, only a minority of the HIV clusters in Switzerland were growing. Similarly, only a small fraction of patients enrolled up to the year 2007 have formed any new links, which would be an indication of onward transmission of HIV. Consistent with earlier work [4], we found that the fraction of virally suppressed patients and behavioral risk factors were predictive of cluster growth. When adjusting for network characteristics, however, these associations were no longer statistically significant, suggesting that part of the information provided by the aforementioned variables can be captured by the characteristics of the network.
When modeling the risk of acquiring new links on the patient level, we found that viral loads of more than 10 000 copies/mL were associated with a high risk of gaining links, adding to the evidence that suppressing viral loads is essential for HIV prevention [5, 31–34]. Additionally, we observed a subgroup of MSM with a sudden burst of growth early in the studied period, indicating that this subgroup or their undiagnosed or HIV–negative contacts might benefit from targeted preventive efforts (Figure 2B, and Supplementary Figures 4 and 5).
As has been partly shown previously in a US-based study [35], we find that cluster size and its previous growth activity is predictive of future growth. When comparing demographical, clinical, and behavioral variables with network-based variables, we observed a significant improvement in the predictive capacity of both cluster-level and patient-level growth models when network-based variables were added as predictors. Keeping in mind the goal of prospectively analyzing the state of HIV epidemics, these variables derived from the network topology provided a substantial increase in predictive accuracy that should not be ignored. The predictive power of past cluster growth and the node degree, the small fraction of active clusters and patients, and the degree distributions observed in the clusters also suggest some degree of preferential attachment being responsible in the generation of the clusters. This underlines the need for approaches that allow the precise and timely identification of foci of ongoing transmission to enable preventive action. The predictive models established in this work could thus form the basis of such precision public health approaches to HIV prevention.
One limitation of our analyses is that they depend on an ad hoc choice of clustering threshold. Here, in line with previous work [19, 36, 37], we chose a threshold of 0.01. This conservative threshold maximizes the number of clusters in our cohort and thereby provides the best resolution for our analysis. In this way, we avoid the two extremes of an unnecessarily strict threshold, which would fail to cluster sequences even if they correspond to real transmission pairs, and a too lenient threshold, which would combine even very different sequences into large uninformative clusters that do not reflect the underlying transmission network. In addition, a relatively strict threshold was preferable in the case of the patient-based prediction models. We also conducted a sensitivity analysis showing that in this study, results were robust to the threshold choice. Another limitation is that we cannot establish individual transmission events between linked patients. Furthermore, the SHCS contains only part of the Swiss HIV–positive population, which means that the analyzed clusters are missing patients that are not enrolled in the cohort. Consequently, the appearance of new links between patients of the SHCS can be caused by undiagnosed or otherwise not enrolled PWH. However, with close to 21 000 total patients and nearly 10 000 patients under follow-up as of 2020, the SHCS is representative of the Swiss HIV epidemic [38]. Another limitation is the use of the first sequence per patient only, which does not account for intrapatient evolution of the virus. Because there was only a single sequence available for most (63.0%) SHCS patients for whom a genotypic resistance test had been performed, this was a practical choice with the added benefit of maximizing the long-term robustness of the clusters generated by HIV-TRACE. Future extensions of this study could possibly take this intrapatient evolution into account, therefore more precisely modeling the real epidemic, although this is contingent on the availability of sequence data on a large number of longitudinally sampled patients.
Despite these limitations, this study provides insight into the long-term dynamics of cluster growth of HIV in Switzerland. It makes use of the densely sampled SHCS, representing a significant and representative part of the Swiss HIV–positive population. The clustering method used makes longitudinal follow-up on individual clusters feasible and opens the possibility of prospective analyses performed in real time. Additionally, it demonstrates the importance of considering cluster-derived variables in addition to demographic and clinical variables when modeling cluster and individual growth dynamics.
In conclusion, we present new insights into the long-term dynamics of HIV cluster growth including the value of using cluster-based variables in predicting future growth both on the level of clusters and individual patients in the Swiss HIV epidemic.
Supplementary Data
Supplementary materials are available at The Journal of Infectious Diseases online. Consisting of data provided by the authors to benefit the reader, the posted materials are not copyedited and are the sole responsibility of the authors, so questions or comments should be addressed to the corresponding author.
Notes
Acknowledgments. We thank the participants of the Swiss HIV Cohort Study (SHCS); the physicians, and study nurses for excellent patient care; the resistance laboratories for high-quality genotyping drug resistance testing; the SHCS data center (A. Scherrer, K. Kusejko, J. Meier, Y. Schäfer, and O. Follonier) for excellent data management; and D. Perraudin and M. Amstad for administrative assistance. The data were gathered by the 5 Swiss university hospitals, 2 cantonal hospitals, 15 affiliated hospitals, and 36 private physicians (listed in Rodger et al [34]).
Members of the Swiss HIV Cohort Study. I. Abela, K. Aebi-Popp, A. Anagnostopoulos, M. Battegay, E. Bernasconi, D. L. Braun, H. C. Bucher, A. Calmy, M. Cavassini, A. Ciuffi, G. Dollenmaier, M. Egger, L. Elzi, J. Fehr, J. Fellay, H. Furrer, C. A. Fux, H. F. Günthard (President of the SHCS), A. Hachfeld, D. Haerry (Deputy of Positive Council), B. Hasse, H. H. Hirsch, M. Hoffmann, I. Hösli, M. Huber, C. R. Kahlert (Chairman of the Mother and Child Substudy), L. Kaiser, O. Keiser, T. Klimkait R. D. Kouyos, H. Kovari, K. Kusejko (Head of Data Centre), G. Martinetti, B. Martinez de Tejada, C. Marzolini, K. J. Metzner, N. Müller, J. Nemeth, D. Nicca, P. Paioni, G. Pantaleo, M. Perreau, A. Rauch (Chairman of the Scientific Board), P. Schmid, R. Speck, M. Stöckle (Chairman of the Clinical and Laboratory Committee), P. Tarr, A. Trkola, G. Wandeler, and S. Yerly.
Financial support. This work was supported by the Swiss National Science Foundation (grant numbers 33CS30_177499 to H. F. G. in the framework of the Swiss HIV Cohort Study [SHCS]; 324730B_179571 and 310030_141067 to H. F. G.; and 324730_207957 and BSSGI0_155851 to R. D. K.); the Yvonne-Jacob Foundation (to H. F. G.); the University of Zurich Clinical Research Priority Program for Viral Infectious Disease, the Zurich Primary HIV Infection Cohort Study (to H. F. G.); and an unrestricted research grant from Gilead Sciences (to the SHCS Research Foundation).
References
Author notes
H. F. G., C. P., and R. D. K contributed equally.
Membership of the Swiss HIV Cohort Study is listed in the Notes.
Potential conflicts of interest. R. D. K. has received grants from the Swiss National Science Foundation (for this work) and Gilead Sciences (outside the submitted work). H.F.G has received unrestricted research grants from the Swiss National Science Foundation, NIH, Yvonne Jacob Foundation and Gilead Sciences; fees for data and safety monitoring board, consultancy or advisory board membership from Merck, Gilead, ViiV, Johnson and Johnson, Janssen, and Novartis.
All authors have submitted the ICMJE Form for Disclosure of Potential Conflicts of Interest. Conflicts that the editors consider relevant to the content of the manuscript have been disclosed.

