


Abstract
The burden and health care utilization (HCU) of respiratory syncytial virus (RSV) in US infants aged <1 year across health care settings are not well characterized.
We systematically reviewed studies of RSV and bronchiolitis published 2000–2021 (data years, 1979–2020). Outcomes included RSV hospitalization (RSVH)/bronchiolitis hospitalization rates, emergency department (ED)/outpatient (OP) visit rates, and intensive care unit (ICU) admissions or mechanical ventilation (MV) use among RSV-/bronchiolitis-hospitalized infants. Study quality was determined using standard tools.
We identified 141 good-/fair-quality studies. Five national studies reported annual average RSVH rates (range, 11.6 per 1000 per year among infants aged 6–11 months in 2006 to 50.1 per 1000 per year among infants aged 0–2 months in 1997). Two national studies provided RSVH rates by primary diagnosis for the entire study period (range, 22.0–22.7 per 1000 in 1997–1999 and 1997–2000, respectively). No national ED/OP data were available. Among 11 nonnational studies, RSVH rates varied due to differences in time, populations (eg, prematurity), and locations. One national study reported that RSVH infants with high-risk comorbidities had 5-times more MV use compared to non–high-risk infants in 1997-2012.
Substantial data variability was observed. Nationally representative studies are needed to elucidate RSV burden and HCU.
Respiratory syncytial virus (RSV) is the leading cause of medically attended lower respiratory tract infections and hospitalizations in US infants [1, 2]. Compared with non–RSV-hospitalized infants, those hospitalized with RSV and bronchiolitis have increased health care utilization (HCU), with more admissions to the intensive care unit (ICU) and higher mechanical ventilation (MV) use [3]. Although prematurity, young age, and comorbidities such as hemodynamically significant congenital heart disease (CHD) and chronic lung disease of prematurity (CLD) are important factors of RSV hospitalization (RSVH), most of those hospitalized are previously or otherwise healthy infants [4, 5]. Additionally, race/ethnicity and insurance payer are related to RSVH and bronchiolitis hospitalizations (BH), ICU admissions, and MV use [6, 7]. However, little is known about RSV epidemiology outside of the inpatient (IP) setting, and the transition of infants with RSV and bronchiolitis across health care settings after the initial diagnosis is not well documented.
This systematic literature review (SLR) aimed to summarize the RSV burden and associated HCU across IP, emergency department (ED), outpatient (OP), and urgent care (UC) settings for US infants aged <1 year. The rates of infant hospitalizations and ED, OP, or UC visits for RSV and bronchiolitis were described. Additionally, HCU was summarized in terms of proportions of ICU admissions or MV use among RSV- and bronchiolitis-hospitalized infants, and transitions of these infants across settings. When available, outcomes stratified by sociodemographic and clinical variables including chronological age, weeks’ gestational age (wGA), birth month, comorbidities, insurance payer, and race/ethnicity were considered.
METHODS
This SLR was conducted and reported following the Preferred Reporting Items for Systematic Reviews and Meta-Analyses (PRISMA) guidelines [8]. The protocol is registered in the International Prospective Register of Systematic Reviews (PROSPERO ID: CRD42020162991).
Eligibility Criteria
Eligibility criteria were defined by population, exposure, comparator, outcomes, and study design (PECOS). Studies of US infants aged <1 year (population) with RSV, clinical sequelae of RSV, and bronchiolitis (exposure) were included. Bronchiolitis is often studied with RSV because of a lack of systematic laboratory testing [9], and it was considered as an upper estimate of RSV. See Supplementary Materials for further details regarding the PECOS.
Study Identification and Screening
Literature searches were conducted in PubMed, EMBASE, and Web of Science to capture studies published since 1 January 2000, through 11 June 2021. The search terms are specified in the protocol and Supplementary Table 1. Standard software for conducting SLRs (DistillerSR [10]) was used to deduplicate the search results. One reviewer examined the titles and abstracts of the deduplicated articles using the PECOS. The articles considered to be relevant at the title and abstract level were reviewed at the full-text level by 2 reviewers independently; conflicts were resolved by a senior reviewer.
Data Abstraction
DistillerSR [10] was used for data abstraction from the included studies. Data elements included study population characteristics, RSV and bronchiolitis definitions (eg, laboratory confirmation, International Classification of Diseases [ICD] diagnosis codes), and the outcomes (overall and by sociodemographic and clinical variables). One reviewer abstracted the data elements for each study, and a second reviewer independently reviewed for quality control. For final confirmation, a senior reviewer evaluated all entries.
Risk of Bias
The Cochrane Risk of Bias tool was used to evaluate the risk of bias (RoB) in randomized clinical trials (RCTs) [11]. A modified version of the Newcastle-Ottawa Scale [12] was used to evaluate the RoB for observational studies including surveillance studies by excluding questions considered not relevant for this review: 2 questions from the selection domain for cohort studies (“selection of the nonexposed cohort” and “demonstration that outcome of interest was not present at start of study”) and one question from the selection domain for case-control studies (“definition of controls”). See Supplementary Materials for further details about the bias assessments and study quality determination.
RESULTS
Article Identification
The PRISMA study flow diagram (Figure 1) describes the inclusion and exclusion of articles at each step. See the Supplementary Materials for the PRISMA checklist. At the title and abstract, 5153 publications were screened. At the full-text level, 1206 (1115 + 91) publications were reviewed; 141 good- and fair-quality studies were identified for abstraction. Seventy studies presented proportions of RSVH, BH, ED visits, or OP visits. However, these studies had different numerators and denominators as study designs and population characteristics varied (eg, bronchiolitis diagnosis among PICU infants, RSVH of ages 0–2 months among RSVH of age <2 years), making the reported outcomes not directly comparable. As this SLR described rates and HCU including ICU admission and MV use among infants hospitalized and transition of RSV infants across settings after the initial diagnosis, these studies were not described further. See Supplementary Materials for the RoB and quality assessments.
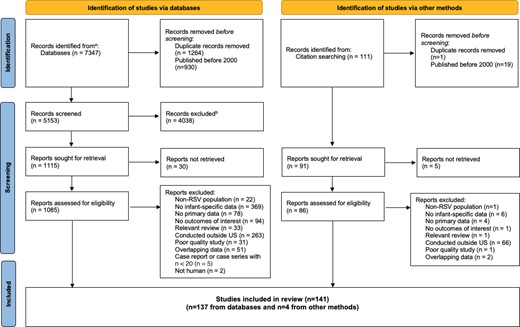
PRISMA flow diagram of the study selection process. aPubMed, Embase, Web of Science databases. bExcluded for not meeting PECOS criteria. Abbreviations: PECOS, population, exposure, comparator, outcomes, and study design; PRISMA, Preferred Reporting Items for Systematic Reviews and Meta-Analyses; RSV, respiratory syncytial virus.
Characteristics of Included Studies
Study Period and Design
Characteristics of the 141 studies in this SLR are summarized in Supplementary Table 2. Studies were published between 1 January 2000, and 11 June 2021, and reported 1 or more years of data from 1979 to 2020 (Figure 2A). Four studies (3%) reported data between 2015 and 2020, while 33 (23%) provided data that included years earlier than 2015 and up to 2020 (Supplementary Table 2). There were 16 (11%) surveillance, 27 (19%) prospective cohorts, 92 (65%) retrospective cohorts, 3 (2%) a combination of prospective cohorts, retrospective cohorts, or surveillance populations, 1 (1%) cross-sectional; 1 (1%) case-control; and 1 (1%) RCT.
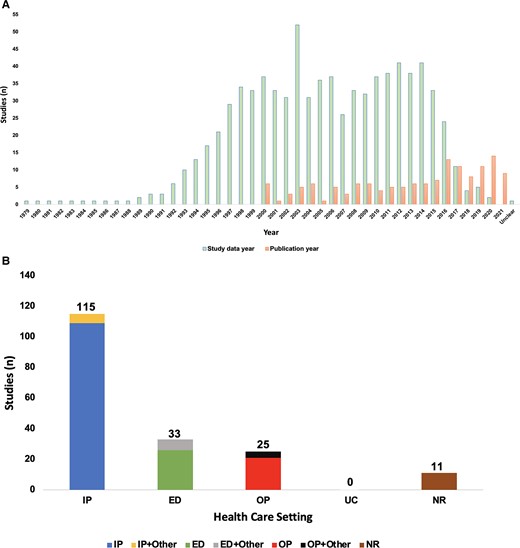
Histograms of included studies (n = 141): (A) data years versus publication years; (B) by health care setting. A, The numbers for study data years do not sum to 141 studies because each study can report multiple data years. B, Numbers do not sum to 141 because studies including multiple settings were counted more than once. Health care setting is based on the burden of disease or health care utilization outcomes reported in each study. Abbreviations: ED, emergency department; IP, inpatient; NR, setting not reported; OP, outpatient; UC, urgent care.
Study Health Care Setting and Locations
Most studies (n = 115) provided IP or IP and other setting data (Figure 2B). Of the remaining studies that reported setting, 26 provided only ED data, while 7 combined ED and other settings; 21 included only OP data, while 4 combined OP and other settings. No study provided UC data, and 11 did not report setting.
Studies were conducted in various states and regions (Supplementary Table 2). Thirteen [2, 4, 7, 13–22] used nationally representative databases, including National (Nationwide) Inpatient Sample, Kids’ Inpatient Database, National Hospital Discharge Survey, and National Ambulatory Medical Care Survey/National Hospital Ambulatory Medical Care Survey. Three [5, 23, 24] were based on the New Vaccine Surveillance Network comprising IPs, EDs, and OP clinics located in 3–7 states. Fourteen studies used data from other surveillance programs such as the Influenza Hospitalization Surveillance Network. Thirty-seven studies used administrative, claims, or hospital discharge data from databases such as MarketScan, Optum, or state Medicaid programs, 1 study used data from Tennessee Medicaid program and Kaiser Permanente Northern California, 72 studies were conducted in single academic centers, health systems, or communities across various states, and 1 study did not specify the data source and geographical location. Geographic locations varied across the 141 studies. Hence, this SLR reports the studies by data source type (nationally representative vs nonnationally representative) to present the RSV literature in a structured manner.
Infant RSVH Rates in Populations Not Restricted by Sociodemographic and Clinical Variables: US Nationally Representative Data Versus Nonnationally Representative Data
Studies that provided RSVH data used varying time units; hence, the rates reported are described as annual average rates (ie, RSVH rate per 1000 per year or RSVH rate per 1000 per season [RSV season is typically late autumn to early spring]) or rates across time (ie, RSVH rate per 1000 for the study period). Seven [2, 4, 7, 13, 17, 19, 22] reported RSVH rates using nationally representative data sets (Table 1). Five [4, 7, 13, 17, 19] provided annual average RSVH rates per year ranging from 11.6 (95% confidence interval [CI], 6.9–16.3) per 1000 per year among infants aged 6–11 months in 2006 to 50.1 (95% CI, 35.6–64.6) per 1000 per year among infants aged 0–2 months in 1997 (Table 1). Two national studies reported declining annual average RSVH rates from year to year: One study reported rates of 20.3 per 1000 in 1997 to 17.8 per 1000 in 2012 [4], and another study reported rates of 13.9–50.1 per 1000 in 1997 to 11.6–42.7 per 1000 in 2006 [17]. Two other studies [2, 22] reported RSVH rates by primary diagnosis for the entire study period, ranging from 22.0 to 22.7 per 1000 from 1997 to 1999 and 1997 to 2000, respectively.
RSVH Rates per 1000, US Infants Aged <1 Year, Not Restricted by Sociodemographic and Clinical Variables (n = 18)a
| Author (Year) | Data and Location | Time Period | Total With RSV, n | RSVH Rate per 1000 (95% CI)b | AHRQ Quality Score |
|---|---|---|---|---|---|
| From nationally representative data, annual average RSVH rates per year (n = 5) | |||||
| Stockman (2012) [17]c | NHDS | 1997–2006 | NR | Annual average rate, 1997–2006 0–2 mo: 48.9 (36.6–61.2) 3–5 mo: 28.4 (21.3–35.5) 6–11 mo: 13.4 (10.7–16.1) 1997 0–2 mo: 50.1 (35.6–64.6) 3–5 mo: 31.8 (16.5–47.1) 6–11 mo: 13.9 (7.2–20.6) 2006 0–2 mo: 42.7 (10.6–74.8) 3–5 mo: 20.7 (10.1–31.3) 6–11 mo: 11.6 (6.9–16.3) | Good |
| Holman (2004) [7] | NHDS | 1997–2001 (annual rates are for 2000–2001 only) | <6 mo: 169 566 6–11 mo: 51 884 | RSVH, 2000–2001 <6 mo: 41.9 (31.7–52.1) 6–11 mo: 12.8 (9.6–16.0) Acute bronchiolitis attributable to RSV, 2000–2001 <6 mo: 36.8 (27.2–46.4) 6–11 mo: 11.7 (8.6–14.8) | Good |
| Paramore (2004) [19] | HCUP NIS, NAMCS/NHAMCS | 2000 | NIS: 65 544 | 17.38 | Good |
| Doucette (2016) [4]c | HCUP KID, NIS | 1997–2012 | 461 625 | 1997: 20.30 2012: 17.80 | Fair |
| Foote (2015) [13] | HCUP NIS | 1998–2011 (annual rates provided as figure; results in text for 2009–2011 only) | NR | Annual average rate, 2009–2011 16.6 (15.1–18.2) | Fair |
| From nationally representative data, RSVH rates for the entire study period (n = 2) | |||||
| Leader and Kohlhase (2003) [2] | NHAMCS, other federal health data sets | 1997–2000 | NR | Primary diagnosis: 22.7 Primary or secondary diagnosis: 24.3 | Good |
| Leader and Kohlhase (2002) [22] | NHDS | 1997–1999 | 280 730 any diagnosis | Any diagnosis codes: 25.2 Primary diagnosis only: 22.0 | Fair |
| From nonnationally representative data, annual average RSVH rates per year (n = 9) | |||||
| Goldstein (2018) [29]c | HCUP SID | 2001–2002 to 2011–2012 seasons | 412 358 | 2001–2002: 20.49 2011–2012: 13.34 | Good |
| Ambrose (2014) [25] | 188 sites, 38 states and Washington, DC | 2009–2011 | 1642 (all were 32–35 wGA) | Per 1000 per season for 2009–2010 and 2010–2011 Sep–May: 77 (58–99) Sep–Oct: 0 (0–89) Nov–Mar: 118 (89–154) Apr–May: 8 (1–30) | Good |
| Zhou (2012) [32]c | HCUP SID (13 states) | 1993–1994 to 2007–2008 | 6648 to 45 902 | Mean: 17.61 1993–1994: 17.21 2007–2008: 16.80 | Good |
| Lloyd (2014) [30] | HCUP SID (5 states) | 1996–2006 | 82 296 | 13.9 (reported as per 1000 per year) | Good |
| Yorita (2007) [34] | Hawaii SID | 1997–2004 | 1336 | 9.8 (reported as annual average) | Good |
| Tong (2020) [27]c | MarketScan Commercial and Medicaid databases | 2008–2014 | 195 781 | Mean: 79.0 2008: 63.0 (62.1–63.8) 2014: 57.2 (56.5–57.9) | Fair |
| Franklin (2016) [26] | 118 sites | 2009–2011 | 1642 (all were 32–35 wGA) | 49 (reported as per 1000 per season for 2009–2010 and 2010–2011) | Fair |
| Goldstein (2019) [28] | HCUP SID (24 states) | 2003–2010 | NR | Annual average rate, 2003–2004 to 2009–2010 seasons Respiratory cause excluding asthma in principal diagnosis: 21.29 (20.44–22.14) Respiratory cause present anywhere in diagnosis except asthma in the principal diagnosis: 23.47 (22.24–24.71) Respiratory cause present anywhere in diagnosis: 23.81 (22.52–25.15) | Fair |
| Sangare (2006) [35]c | California hospital discharge files | 1999–2003 | 33 430 | Mean: 17.1 (16.9–17.2) 1999: 19.0 (18.6–19.4) 2003: 14.4 (14.1–14.7) | Fair |
| From nonnationally representative data, RSVH rates for the entire study period (n = 2) | |||||
| Johnson and Ratard (2012) [31] | Louisiana inpatient hospital discharge data | 1999–2010 | NR | 27.61 (rate range, 21.39–37.37) | Good |
| Choudhuri (2006) [33] | Colorado, data source NR | 1998–2002 | 4847 | 15.9 | Good |
Abbreviations: AHRQ, Agency for Healthcare Research and Quality; CI, confidence interval; HCUP, Healthcare Cost and Utilization Project; KID, Kid’s Inpatient Database; NAMCS/NHAMCS, National Ambulatory Medical Care Survey/National Hospital Ambulatory Medical Care Survey; NHDS, National Hospital Discharge Survey; NIS, National (Nationwide) Inpatient Sample; NR, not reported; RSVH, respiratory syncytial virus hospitalization; SID, State Inpatient Database.
Study and population characteristics of the publications described in this table are provided in Supplementary Table 2.
Not all publications described in this table presented 95% CIs for the rates and thus specified. Ordered by study quality and time period (most recent to oldest).
Reported for each season. This table provides rates for the earliest and latest time periods reported by the study authors.
Eleven studies reported rates using nonnationally representative data: 1 used the MarketScan database, while 10 were from regional and local sources [25–35] (Table 1). Although MarketScan is among the largest sources of health insurance claims data, it was not considered to be nationally representative [36, 37]. Nine [25–30, 32, 34, 35] provided annual average RSVH rates ranging from 0 (95% CI, 0–89) per 1000 per season during September–October of 2009–2010/2010–2011 to 118 (95% CI, 89–154) per 1000 per season during November–March of 2009–2010/2010–2011. Three studies reported decreasing annual average RSVH rates from year to year using regional/local data, while 1 observed the decline in the MarketScan and Medicaid database [27, 29, 32, 35] (Table 1). Two [31, 33] included RSVH rates for the study period, ranging from 15.9 per 1000 in 1998–2002 to 37.4 per 1000 in 1999–2010 (Table 1).
Infant RSVH Rates by Race/Ethnicity: US Nationally Representative Data Versus Regional Geographies
No study used nationally representative data to report infant RSVH rates by race/ethnicity (Table 2). Five [7, 13, 38–40] provided annual average RSVH rates specific to American Indian/Alaska Native infants and those in the Indian Health Service regions. Annual average RSVH rates ranged from 22.1 per 1000 per year in 2009–2011 to 178 per 1000 per year in 1994–1997 (Table 2). One study [41] provided RSVH rates for the study period, and the highest rate was among <36 wGA infants (439 per 1000 in 1993–1996; Table 2). In 2 studies [7, 13], annual average RSVH rates were reported for American Indian/Alaska Native infants and general US population infants; the rates among American Indian/Alaska Native infants were up to 2 times higher than general US population infants (24.2 per 1000 per year in 2000–2001 vs 12.8 per 1000 per year in 2000–2001; Table 1 and Table 2).
RSVH Rates per 1000, AI/AN Infants and Those in the IHS Regions (n = 6)a
| Author (Year) | Data and Location | Time Period | Total With RSV, n | RSVH Rate per 1000 (95% CI)b | AHRQ Quality Score |
|---|---|---|---|---|---|
| From regional geographies, annual average RSVH rates per year (n = 5) | |||||
| Bruden (2015) [38] | 2 medical centers, YKD and Alaska | 1994–2012 | NR for infants | 1994–2003: 144 2003–2012: 87 | Good |
| Singleton (2006) [40] | Single medical center, YKD | 1994–2004 | NR for infants | All infants 1994–1997: 178 1997–2001: 154 2001–2004: 104 Preterm infants 1994–1997: 317 1997–2001: 201 2001–2004: 123 | Good |
| Holman (2004) [7] | IHS hospital discharge data | 1997–2001 (rates are for 2000–2001) | AI/AN infants: <6 mo: 815 6–11 mo: 443 | AI/AN infants, RSVH, 2000–2001 0–11 mo: 34.4 (32.5–36.3) <6 mo: 44.5 (41.6–47.6) 6–11 mo: 24.2 (22.1–26.6) AI/AN infants, acute bronchiolitis attributable to RSV, 2000–2001 0–11 mo: 29.0 (27.3–30.8) <6 mo: 37.4 (34.7–40.3) 6–11 mo: 20.7 (18.7–22.8) | Good |
| Bockova (2002) [39] | 3 hospitals in Navajo and 1 IHS in White Mountain Apache reservations | 1997–2000 | 642 | Average rate per season All: 91 White Mountain Apache: 164.3 Navajo: 78.1 | Good |
| Foote (2015) [13] | IHS | 1998–2011 (annual rates provided as figure; results in text for 2009–2011 only) | NR | 2009–2011: 22.1 | Fair |
| From regional geographies, RSVH rates for the entire study period (n = 1) | |||||
| Singleton (2003) [41] | YKD and Alaska | 1993–1996, 1998– 2001 | 1993–1996: 992 1998–2001: 1087 | All 1993–1996: 154 1998–2001: 144 <36 wGA 1993–1996: 439 1998–2001: 150 >36 wGA 1993–1996: 148 1998–2001: 142 | Fair |
Abbreviations: AHRQ, Agency for Healthcare Research and Quality; AI/AN, American Indian/Alaska Native; CI, confidence interval; IHS, Indian Health Service; NR, not reported; RSVH, respiratory syncytial virus hospitalization; YKD, Yukon-Kuskokwim Delta Region; wGA, weeks’ gestational age.
Study and population characteristics of the publications described in this table are provided in Supplementary Table 2.
Not all publications described in this table provided 95% CIs for the rates. Order of presentation was by study quality and time period (most recent to oldest).
One New Vaccine Surveillance Network study of 7 medical centers in the US [5] provided average annual RSVH rates by other races and ethnicity (Table 3). Although not statistically different, higher rates from 2015 to 2016 were reported among Hispanic or Latino and African American infants compared with non-Hispanic white or non-Hispanic other infants (0–5 months of age, 16.1 [95% CI, 13.7–18.4] per 1000 per year in Hispanic or Latino infants vs 14.4 [95% CI, 12.6–16.2] per 1000 per year in non-Hispanic white infants).
RSVH Rates per 1000, US Infants Aged <1 Year, by Sociodemographic and Clinical Variables (n = 16)a
| Author (Year) | Data and Location | Time Period | Total With RSV, n | RSVH Rate per 1000 (95% CI)b | AHRQ Study Quality | |
|---|---|---|---|---|---|---|
| Annual average RSVH rates per year, by chronological age (n = 5) | ||||||
| Rha (2020) [5] | NVSN: NY, OH, TN, MO, TX, WA, and CA | 2015–2016 | 704 | <6 mo of age <1 mo: 16.1 (12.9–19.4) 1 mo: 25.1 (21.1–29.3) 2 mo: 15.6 (13.2–18.1) 3 mo: 13.4 (10.8–16.1) 4 mo: 9.9 (7.5–12.2) 5 mo: 8.3 (6.1–10.4) 0 to 5 mo: 14.7 (13.6–15.9) NH white: 14.4 (12.6–16.2) NH African American: 15.2 (12.7–18.0) NH other: 11.0 (8.4–13.6) Hispanic or Latino: 16.1 (13.7–18.4) | ≥6 mo of age 6 mo: 8.2 (6.3–10.3) 7 mo: 4.8 (3.1–6.6) 8 mo: 4.5 (2.8–6.2) 9 mo: 3.9 (2.1–6.0) 10 mo: 2.7 (1.4–4.1) 11 mo: 4.5 (2.6–6.6) 6 to 11 mo: 4.8 (4.0–5.5) NH white: 3.1 (2.2–4.0) NH African American: 6.8 (4.8–8.9) NH other: 3.6 (1.8–5.8) Hispanic or Latino: 5.9 (4.4–7.3) | Good |
| Arriola (2020) [42] | FluSurv-NET, 20 hospitals: CA, GA, OR, MN | 2014–2015 | 1176 | <6 mo of age 0–2 mo: 19.70 (17.87–21.77) 3–5 mo: 8.97 (7.61–10.73) | ≥6 mo of age 6–11 mo: 5.31 (4.59–6.24) | Good |
| Simoes (2016) [44]c | 188 clinics in 38 states | 2009–2011 | NR (all were 32–35 wGA) | <6 mo of age, per 1000 per season <1 mo: 82 (69–97) | ≥6 mo of age, per 1000 per season 10 mo: 23 (18–29) | Good |
| Hall (2009) [23] | NVSN: TN, NY, OH | 2000–2004 | 598 (328 hospitalized) | <6 mo of age 0–5 mo 2000–2001: 18.5 (14.4–22.9) 2001–2002: 11.7 (9.1–14.7) 2002–2003: 12.4 (9.4–15.2) 2003–2004: 21.7 (18.8–24.6) | ≥6 mo of age 6–11 mo 2000–2001: 7.4 (5.1–9.9) 2001–2002: 4.2 (2.4–5.8) 2002–2003: 3.4 (1.9–5.0) 2003–2004: 5.4 (3.8–7.0) | Good |
| Bowen (2009) [43] | Medical claims in multiple states | 2003–2008 | 481 | <6 mo of age, per 1000 per season <6 mo: 18.4 | ≥6 mo of age, per 1000 per season 6–12 mo: 3.6 | Fair |
| Annual average RSVH rates per year, by wGA (n = 3) | ||||||
| Krilov (2019) [47] | Optum Research Database | 2011–2017 | Preterm: 145 Term: 1671 (based on RSVH) | Preterm (<37 wGA), per 1000 per season, <6 mo 29–34 wGA 2011–2014: 21 (17–27) 2014–2017: 31 (25–38) | Full-term (≥37 wGA), per 1000 per season, <6 mo ≥37 wGA 2011–2014: 11 (11–12) 2014–2017: 11 (10–11) | Fair |
| Fergie (2021) [46] | MarketScan Commercial database and Multi-State Medicaid Database | 2010–2017 | Commercial: 2556 (31%) and 1468 (32%) were RSVH, contributed by 2466 preterm and 1418 term infants Medicaid: 5558 (34%) and 4213 (33%) were RSVH, contributed by 5344 preterm and 4061 term infants | Preterm (<37 wGA), per 1000 per season <3 mo: 20–100 3 to <6 mo: 13–70 | Full-term (≥37 wGA), per 1000 per season <3 mo: 13–25 3 to <6 mo: 6–12 | Fair |
| Bennett (2018) [45] | CA OSHPD | 1997–2011 (annual rates were reported for 1998 to 2011, but provided as figure and text) | 6580 with medical conditions 95 270 without medical conditions: 546 (22–29 wGA) 1076 (29–31 wGA) 3733 (32–34 wGA) 16 787 (35–37 wGA) 73 127 (≥38 wGA) | Preterm (<37 wGA) 22–28: 13–29 29–31: 14–30 32–34: 12–22 35–37: 10–16 | Full-term (≥37 wGA) 38–44: 8–13 | Fair |
| Annual average RSVH rates per year, by comorbidities (n = 2) | ||||||
| Doucette (2016) [4]d | HCUP KID, NIS | 1997–2012 | 461 625 | Otherwise healthy NR | CHD, CLD, other conditions Any high-risk comorbidityc 1997: 62.91 2012: 30.05 | Fair |
| Bennett (2018) [45] | CA OSHPD | 1997–2011 (annual rates were reported from 1998 to 2011, but provided as figure and text) | 6580 with medical conditions 95 270 without medical conditions: 546 (22–29 wGA) 1076 (29–31 wGA) 3733 (32–34 wGA) 16 787 (35–37 wGA) 73 127 (≥38 wGA) | Otherwise healthy 8 to 18 | CHD, CLD, other conditions With medical conditions: 34–76 CLD: 50–120 High–risk CHD: 32–76 Congenital airway anomalies: 43–91 Down syndrome without CHD: 32–62 | Fair |
| RSVH rates for the entire study period, by comorbidities (n = 1) | ||||||
| Fergie (2021) [48] | PHIS | 2010–2017 | NR | Otherwise healthy NR | CHD, CLD, other conditions Higher-risk CHD Before 2014: 28.18 After 2014: 31.80 | Fair |
| Annual average RSVH rates per year, by insurance payer (n = 6) | ||||||
| Kong (2020) [53] | MarketScan Commercial database and Multi-State Medicaid Database | 2008–2019 | Medicaid: 2501 preterm 13 962 term Commercial: 796 preterm 6486 term | Public (Medicaid), per 1000 per season <29 wGA: 40–93 29–34 wGA: 36–66 Term: 14–24 | Private (commercial), per 1000 per season <29 wGA: 15–54 29–34 wGA: 16–43 Term: 9–14 | Fair |
| Goldstein (2018) [50] | MarketScan Commercial and Multi-State Medicaid databases | 2012–2016 | Medicaid: 7745 RSVH Commercial: 2946 RSVH | Public (Medicaid), per 1000 per season, 2012–2014 <3 mo 29–30 wGA: 77 31–32 wGA: 78 33–34 wGA: 60 Term: 26 3 to <6 mo 29–30 wGA: 37 31–32 wGA: 37 33–34 wGA: 30 Term: 12 Per 1000 per season, 2014–2016 <3 mo 29–30 wGA: 71 31–32 wGA: 88 33–34 wGA: 67 Term: 19 3 to <6 mo 29–30 wGA: 56 31–32 wGA: 36 33–34 wGA: 21 Term: 9 | Private (commercial), per 1000 per season, 2012–2014 <3 mo 29–30 wGA: 15 31–32 wGA: 33 33–34 wGA: 26 Term: 16 3 to <6 mo 29–30 wGA: 20 31–32 wGA: 18 33–34 wGA: 15 Term: 7 Per 1000 per season, 2014–2016 <3 mo 29–30 wGA: 56 31–32 wGA: 67 33–34 wGA: 38 Term: 13 3 to <6 mo 29–30 wGA: 22 31–32 wGA: 27 33–34 wGA: 22 Term: 6 | Fair |
| Goldstein (2021) [52]e | MarketScan Commercial Claims and Encounters and Medicaid Multi-State | 2011–2016 | NR | Public (Medicaid) All are 0 to <6 mo 2012–2014d <29 wGA: 52 Term: 19 2014–2016d <29 wGA: 62 Term: 13 | Private (commercial) All are 0 to <6 mo 2012–2014d <29 wGA: 22 Term: 11 2014–2016d <29 wGA: 29 Term: 9 | Fair |
| Kong (2018) [49] | MarketScan Commercial and Multi-State Medicaid databases | 2009–2015 | Medicaid: 13 312 RSVH Commercial: 6563 RSVH | Public (Medicaid), per 1000 per season 29–30 wGA, <3 mo, 2014–2015 season: 117 (70–183) Term, 6–12 mo, 2014–2015 season: 5 (4–5) | Private (commercial), per 1000 per season 29–30 wGA, <3 mo, 2014–2015 season: 63 (21–148) Term, 6–12 mo, 2013–2014 season: 3 (2–3) | Fair |
| Franklin (2016) [26] | 118 sites, locations NR | 2009–2011 | 1642 (all were 32–35 wGA) | Public (Medicaid) 63 (per 1000 per season for 2009–2010 and 2010–2011) | Private (commercial) 36 (per 1000 per season for 2009–2010 and 2010–2011) | Fair |
| Choi (2021) [51] | Medicaid (TX, FL) | 1999–2010 | 11 757 RSVH in healthy term 176 in CLD | Public (Medicaid), per 1000 per season Healthy infants, 1 mo: 14.8 (13.5–16.1) | Private (commercial) NR | Fair |
Abbreviations: AHRQ, Agency for Healthcare Research and Quality; CA OSHPD, California Office of Statewide Health Planning and Development; CHD, congenital heart disease; CI, confidence interval; CLD, chronic lung disease of prematurity; FluSurv-NET, Influenza Hospitalization Surveillance Network; HCUP, Healthcare Cost and Utilization Project; KID, Kid’s Inpatient Database; NH, non-Hispanic; NHDS, National Hospital Discharge Survey; NIS, National (Nationwide) Inpatient Sample; NR, not reported; NVSN, National Vaccine Surveillance Network; PHIS, Pediatrics Health Information System; RSVH, respiratory syncytial virus hospitalization; wGA, weeks’ gestational age.
Study and publication characteristics of the publications described in this table are provided in Supplementary Table 2.
Not all publications described in this table provided 95% CIs for the rates. Order of presentation was by study quality and time period (most recent to oldest).
Simoes et al (2016) [44] provided RSVH rates (per 1000 per season) by birth month and by young child exposure. Born in May before the RSV season: 25 (95% CI, 17–35); born in February during the RSV season: 108 (95% CI, 77–153).
Nationally representative data sets were used in this study. Higher-risk CHD, lower-risk CHD, CLD, Down syndrome without CHD, congenital airway anomalies, preterm births, and others (cystic fibrosis with pulmonary manifestations, neuromuscular disease, HIV, immunodeficiency, and other genetic metabolic musculoskeletal conditions) were evaluated.
The reporting of units for RSVH rates in Goldstein et al (2021) [52] is unclear. Per 100 per season was assumed based on other publications of Goldstein and converted to per 1000 per season.
Infant RSVH Rates by Chronological Age, wGA, Comorbidities, and Insurance Payer: US Nationally Representative Data Versus Nonnationally Representative Data
Two [7, 17] provided annual average RSVH rates by chronological age based on nationally representative data (Table 1). The highest RSVH rates were observed among the youngest infants (0–2 months, 50.1 [95% CI, 35.6–64.6] per 1000 per year in 1997).
Five [5, 23, 42–44] included annual average RSVH rates by chronological age using nonnationally representative data (Table 3). Annual average RSVH rates were between 2.7 (95% CI, 1.4–4.1) per 1000 per year in 2015–2016 among infants aged 10 months and 82 (95% CI, 69–97) per 1000 per season in 2009–2011 among infants aged <1 month (Table 3). Simoes et al (2016) [44] was the only study to provide data by birth month among 32–35 wGA infants and inferred higher RSVH rates among in-season births than out-of-season births in 2009–2011 (108 [95% CI, 77–153] per 1000 per season for those born in February vs 25 [95% CI, 17–35] per 1000 per season for those born in May).
No study provided RSVH rates by wGA using nationally representative data (Table 3). Three [45–47] provided annual RSVH rates by wGA using California hospital discharge, MarketScan, and Optum data (Table 3). Because Optum provided information on US populations in commercial health plans and Medicare Advantage plans, Optum data were not considered to be nationally representative. Annual RSVH rates in preterm infants were increased up to 6 times compared with that of full-term infants (infants aged 3 to <6 months in 2010–2017: 70 per 1000 per season in preterm vs 12 per 1000 per season in full-term).
Only Doucette et al (2016) used nationally representative data [4] to provide annual average RSVH rates by any high-risk comorbidity conditions, which included CHD, CLD, Down syndrome without CHD, congenital airway anomalies, preterm births, and other rare congenital and metabolic conditions. Annual average RSVH rates by any high-risk comorbidity conditions were between 30.0 per 1000 per year in 2012 and 62.9 per 1000 per year in 1997 [4] (Table 3). Two other studies [45, 48] reported rates by comorbidity conditions using California hospital discharge data and Pediatric Health Information System data, which included data from >49 hospitals in the United States. Only Bennett et al (2018) [45] reported annual average RSVH rates for otherwise healthy infants compared with infants who have comorbidity conditions in California. Among infants without comorbidity conditions, annual average RSVH rates were between 8 per 1000 per year in 2011 and 18 per 1000 per year in 2002 [45] (Table 3). For infants with comorbidity conditions, annual average RSVH rates were approximately 4 times higher, ranging from 34 per 1000 per year in 2011 to 76 per 1000 per year in 1998 [45] (Table 3).
No study provided RSVH rates by insurance payer using nationally representative data (Table 3).
Six [26, 49–53] included annual RSVH rates per season by insurance payer from 1999 to 2019 using nonnationally representative data; among these, 4 provided rates stratified further by chronological age, wGA, and time (before and after 2014) (Table 3). Because study populations had different chronological age and wGA, rate ranges by insurance payer could not be provided. Annual RSVH rates per season in Medicaid-insured infants were higher, up to 5 times, compared with privately insured infants (29–30 wGA and aged <3 months: 77 per 1000 per season in 2012–2014 for Medicaid insured vs 15 per 1000 per season in 2012–2014 for privately insured [50]).
Infant ED and OP Visit Rates for RSV: US Nationally Representative Data Versus Nonnationally Representative Data
No study provided infant ED or OP visit rates using nationally representative data (Supplementary Table 3 and Table 4). Three included annual ED or OP visit rates per year by chronological age (n = 2) [23, 24] and insurance payer (n = 1) [26] from nonnationally representative data (Table 4). No study had data for otherwise healthy and full-term infants. The range summaries for the stratified ED and OP visit rates were not provided because of the small number of studies. Trends by chronological age were unclear [23, 24]. Higher ED and OP visit rates per year were observed among publicly insured 32–35 wGA infants compared with privately insured 32–35 wGA infants [26].
RSV ED or OP Visit Rates per 1000, US Infants Aged <1 Year, by Sociodemographic and Clinical Variables (n = 3)a
| Author (Year) | Data Source and Location | Time Period | Total With RSV, n | RSV Visit Rate per 1000 (95% CI)b | AHRQ Quality Score | |
|---|---|---|---|---|---|---|
| ED: annual average visit rates per year, by chronological age (n = 2) | ||||||
| Hall (2009) [23] | NVSN: TN, NY, and OH | 2000–2004 | 598 (88 in ED and OP) | <6 mo of age (0–5 mo) 2002–2003: 39 (12–124) 2003–2004: 69 (34–143) 2002–2004: 55 (24–126) | ≥6 mo of age (6–11 mo) 2002–2003: 45 (13–157) 2003–2004: 68 (27–175) 2002–2004: 57 (20–161) | Good |
| Lively (2019) [24] | NVSN: TN, NY, and OH | 2004–2009 | 631 (326 in ED) | <6 mo of age 0 mo: 19.6 (16.8–22.4) 1 mo: 64.2 (54.9–73.4) 2 mo: 72.4 (62.0–82.9) 3 mo: 105.2 (90.1–120.4) 4 mo: 116.0 (99.3–132.7) 5 mo: 71.3 (61.1–81.6) 0–5 mo: 74.8 (64.0–85.6) | ≥6 mo of age 6 mo: 81.8 (70.1–93.6) 7 mo: 56.1 (48.0–64.2) 8 mo: 55.6 (47.6–63.5) 9 mo: 55.6 (47.6–63.6) 10 mo: 40.4 (34.6–46.2) 11 mo: 55.6 (47.6–63.6) 6–11 mo: 57.5 (49.2–65.8) | Fair |
| ED: annual average visit rates per year, by insurance payer (n = 1) | ||||||
| Franklin (2016) [26] | 118 sites | 2009–2011 | 1642 (all were 32–35 wGA) | Public (Medicaid) 83 | Private (commercial) 36 | Fair |
| OP: annual average visit rates per year, by chronological age (n = 2) | ||||||
| Hall (2009) [23] | NVSN: TN, NY, and OH | 2000–2004 | 598 (88 in ED and OP) | <6 mo of age (0–5 mo) 2002–2003: 108 (33–346) 2003–2004: 157 (54–462) 2002–2004: 132 (46–383) | ≥6 mo of age (6–11 mo) 2002–2003: 194 (77–492) 2003–2004: 160 (45–576) 2002–2004: 177 (61–511) | Good |
| Lively (2019) [24] | NVSN: TN, NY, and OH | 2004–2009 | 631 (305 in pediatric practice setting) | <6 mo of age 0 mo: 85.2 (71.0–99.3) 1 mo: 187.9 (156.6–219.1) 2 mo: 234.2 (195.2–273.1) 3 mo: 232.6 (194.0–271.3) 4 mo: 265.0 (221.0–309.1) 5 mo: 289.2 (241.1–337.2) 0–5 mo: 215.7 (179.8–251.5) | ≥6 mo of age 6 mo: 264.7 (220.7–308.7) 7 mo: 207.2 (172.8–241.7) 8 mo: 277.8 (231.7–324.0) 9 mo: 227.2 (189.4–264.9) 10 mo: 241.7 (201.5–281.8) 11 mo: 258.1 (215.2–301.0) 6–11 mo: 246.1 (205.2–287.0) | Fair |
| OP: annual average visit rates per year, by insurance payer (n = 1) | ||||||
| Franklin (2016) [26] | 118 sites | 2009–2011 | 1642 (all were 32–35 wGA) | Public (Medicaid) 144 | Private (commercial) 133 | Fair |
AHRQ, Agency for Healthcare Research and Quality; CI, confidence interval; ED, emergency department; NVSN, National Vaccine Surveillance Network; OP, outpatient; RSV, respiratory syncytial virus.
Study and population characteristics of the publications described in this table are provided in Supplementary Table 2.
Not all publications described in this table provided 95% CIs for the rates. Order of presentation was by study quality and time period (most recent to oldest).
Transitions Across Health Care Settings after the Initial RSV Diagnosis in Infants: US Nationally Representative Data Versus Nonnationally Representative Data
No study using nationally representative data described transitions of infants across health care settings after the initial RSV diagnosis. Three studies based on nonnationally representative data [25, 54, 55] provided setting transition information after the initial RSV diagnosis in US infants (Supplementary Table 2). In Ambrose et al (2014) [25], subsequent hospital admissions and ED visits were documented in 30% of 287 infants who were 32–35 wGA with RSV seen initially at 188 OP clinics and EDs from 2009 to 2011. In Jafri et al (2013) [54], approximately 10% of 1299 infants with RSV seen at EDs (unknown geographic locations) from 2006 to 2008 had subsequent ED visits after the initial illness episode. Shi et al (2011) [55] reported that among 10 770 infants in MarketScan data from 2003 to 2005, between 13% (full term, seen initially at OP clinics) and 100% (late preterm and full term, seen initially at IP hospitals) had subsequent health care visits within 12 months of an RSV lower respiratory tract infection event.
ICU Admission Among RSVH Infants: US Nationally Representative Data Versus Nonnationally Representative Data
No study included ICU admission data using nationally representative data sets. From other datasets, 22 reported proportions of ICU admissions among RSVH infants (range, 6.3%–71.4% from 1992 to 2020; Supplementary Table 4). Eleven unique studies reported ICU admission proportions by chronological age (n = 5) [5, 42, 56–58], wGA (n = 5) [47, 56, 59–61], comorbidity conditions (n = 1) [61], and insurance payer (n = 2) [6, 46] (Table 5). Higher ICU admissions were observed in younger versus older infants (up to 64.3% in those aged <6 months vs 54.5% in those aged ≥6 months from 2013 to 2016), preterm versus full-term infants (52.2% vs 33.3% from 1992 to 2017), and Medicaid-insured versus privately insured infants (21.1% vs 16.5% from 2003 to 2017). From 2003 to 2007, 21.8% of infants with CHD and 13.3% of infants with CLD hospitalized for RSV had ICU admissions. No data were available by race/ethnicity or for otherwise healthy infants.
| Author (Year) | Data Source and Location | Time Period | Total With RSV, n | Intensive Care Unit Admission Proportions | Mechanical Ventilation Use Proportions | AHRQ Study Quality | ||
|---|---|---|---|---|---|---|---|---|
| By chronological age | ||||||||
| Rha (2020) [5] | NVSN: NY, OH, TN, MO, TX, WA, and CA | 2015–2016 | 0–2 mo: 342 3–5 mo: 184 6–11 mo: 178 | <6 mo of age 0–2 mo: 19.9% 3–5 mo: 18.5% | ≥6 mo of age 6–11 mo: 18.0% | <6 mo of age NR | ≥6 mo of age NR | Good |
| Anderson (2020) [56] | SENTINEL, 46 sites | 2014–2016 | <3 mo: 687 3 to <6 mo: 387 6 to <9 mo: 189 9 to <12 mo: 115 | <6 mo of age <3 mo: 55.6% 3 to <6 mo: 33.6% | ≥6 mo of age 6 to <9 mo: 31.7% 9 to <12 mo: 33.0% | <6 mo of age <3 mo: 28.7% 3 to <6 mo: 11.4% | ≥6 mo of age 6 to <9 mo: 6.9% 9 to <12 mo: 9.6% | Good |
| Wozniak (2016) [58] | 1 medical center: OH | 2013–2014; 2015–2016 | <3 mo: 28 <6 mo: 51 | <6 mo of age <3 mo: 64.3% <6 mo: 56.9% | ≥6 mo of age NR | <6 mo of age <3 mo: 32.1% <6 mo: 23.5% | ≥6 mo of age NR | Good |
| Arriola (2020) [42] | FluSurv-NET, 20 hospitals: CA, GA, OR, MN | 2014–2015 | 0–2 mo: 614 3–5 mo: 262 6–11 mo: 300 | <6 mo of age 0–2 mo: 35.3% 3–5 mo: 24.8% | ≥6 mo of age 6–11 mo: 17.7% | <6 mo of age 0–2 mo: 10.6% 3–5 mo: 3.1% | ≥6 mo of age 6–11 mo: 3.0% | Good |
| Rajah (2017) [57] | 1 medical center: OH | 2013–2015 | 0 to <3 mo: 29 3 to 6 mo: 29 6 to <12 mo: 33 | <6 mo of age 0 to <3 mo: 55.2% 3 to 6 mo: 48.3% | ≥6 mo of age 6 to <12 mo: 54.5% | <6 mo of age 0 to <3 mo: 37.9% 3 to 6 mo: 10.3% | ≥6 mo of age 6 to <12 mo: 12.1% | Good |
| By wGA | ||||||||
| Anderson (2020) [56] | SENTINEL, 46 sites | 2014–2016 | 29–32 wGA: 441 33–34 wGA: 571 35 wGA: 366 | Preterm (<37 wGA) 29–32 wGA: 48.1% 33–34 wGA: 44.5% 35 wGA: 39.3% | Full-term (≥37 wGA) NR | Preterm (<37 wGA) 29–32 wGA: 22.2% 33–34 wGA: 19.6% 35 wGA: 15.0% | Full-term (≥37 wGA) NR | Good |
| Leader (2003) [59] | 10 medical centers | 2000–2001 | 33–35 wGA: 48 Full–term: 36 | Preterm (<37 wGA) 33–35 wGA: 41.7% | Full-term (≥37 wGA) 33.3% | Preterm (<37 wGA) NR | Full-term (≥37 wGA) NR | Good |
| Krilov (2019) [47] | Optum Research Database | 2011–2017 | Preterm: 145 Term: 1671 | Preterm (<37 wGA) Total: 39.3% <3 mo: 52.2% 3–6 mo: 17.0% | Full-term (≥37 wGA) Total: 24.8% <3 mo: 27.6% 3–6 mo: 19.1% | Preterm (<37 wGA) Total: 11.7% <3 mo: 16.3% 3–6 mo: 3.8% | Full-term (≥37 wGA) Total: 6.0% <3 mo: 6.7% 3–6 mo: 4.7% | Fair |
| Forbes (2010) [61] | MarketScan Commercial Research Database | 2003–2007 | ≤32 wGA: 40 33–36 wGA: 173 ≥37 wGA: 1983 | Preterm (<37 wGA) ≤32 wGA: 19.5% 33–36 wGA: 21.9% | Full-term (≥37 wGA) ≥37 wGA: 9.6% | Preterm (<37 wGA) NR | Full-term (≥37 wGA) NR | Fair |
| Stevens (2000) [60] | 1 medical center: NY | 1992–1996 | ≤26 wGA: 23 27–28 wGA: 17 >28–30 wGA: 18 >30–32 wGA: 20 | Preterm (<37 wGA) ≤26 wGA: 4.3% 27–28 wGA: 17.6% >28–30 wGA: 16.7% >30–32 wGA: 25.0% | Full-term (≥37 wGA) NR | Preterm (<37 wGA) NR | Full-term (≥37 wGA) NR | Fair |
| By comorbidities | ||||||||
| Doucette (2016) [4]c | HCUP KID, NIS | 1997–2012 | High risk: 23 709 Non-high risk: 437 916 | Otherwise healthy NR | CHD, CLD, other conditions NR | Otherwise healthy 1997: 3.0% 2012: 4.5% | CHD, CLD, other conditions 1997: 18.7% 2012: 20.4% | Fair |
| Forbes (2010) [61] | MarketScan Commercial Research Database | 2003–2007 | CHD: 151 CLD: 41 | Otherwise healthy NR | CHD, CLD, other conditions CHD: 21.8% CLD: 13.3% | Otherwise healthy NR | CHD, CLD, other conditions NR | Fair |
| By insurance payer | ||||||||
| Fergie (2021) [46] | MarketScan Commercial and Multi-State Medicaid Databases | 2010–2017 | Medicaid: 10 651 Commercial: 4403 | Public (Medicaid) Total: 21.1% 29–34 wGA <3 mo: 50.5% 3 to <6 mo: 27.5% Term <3 mo: 19.8% <3 to 6 mo: 14.4% | Private (commercial) Total: 16.5% 29–34 wGA <3 mo: 40.1% 3 to <6 mo: 18.5% Term <3 mo: 16.4% <3 to 6 mo: 11.8% | Public (Medicaid) NR | Private (commercial) NR | Fair |
| McLaurin (2016) [6] | MarketScan Multi-State Medicaid and Commercial Claims and Encounters Database | 2003–2013 | Medicaid: 29 967 Commercial: 16 310 | Public (Medicaid) Total: 10.1% <29 wGA: 31.1% 29–30 wGA: 28.3% 31–32 wGA: 20.9% 33–34 wGA: 21.2% 35–36 wGA: 14.4% Term: 8.0% | Private (commercial) Total: 9.7% <29 wGA: 22.6% 29–30 wGA: 20.8% 31–32 wGA: 14.0% 33–34 wGA: 16.6% 35–36 wGA: 15.3% Term: 8.5% | Public (Medicaid) Total: 3.0% <29 wGA: 14.0% 29–30 wGA: 9.0% 31–32 wGA: 9.0% 33–34 wGA: 8.0% 35–36 wGA: 5.0% Term: 2.0% | Private (commercial) Total: 1.6% <29 wGA: 6.0% 29–30 wGA: 9.0% 31–32 wGA: 5.0% 33–34 wGA: 6.0% 35–36 wGA: 4.0% Term: 1.0% | Fair |
Abbreviations: AHRQ, Agency for Healthcare Research and Quality; CHD, congenital heart disease; CLD, chronic lung disease of prematurity; FluSurv-NET, Influenza Hospitalization Surveillance Network; HCUP, Healthcare Cost and Utilization Project; KID, Kid’s Inpatient Database; NIS, National (Nationwide) Inpatient Sample; NR, not reported; NVSN, National Vaccine Surveillance Network; RSV, respiratory syncytial virus; wGA, weeks’ gestational age.
Study and population characteristics of the publications described in this table are provided in Supplementary Table 2.
The proportions of intensive care unit admissions or mechanical ventilation use among infants hospitalized for RSV were considered.
Nationally representative data sets were used in this study. Higher-risk CHD, lower-risk CHD, CLD, Down syndrome without CHD, congenital airway anomalies, preterm births, and others (cystic fibrosis with pulmonary manifestations, neuromuscular disease, HIV, immunodeficiency, and other genetic metabolic musculoskeletal conditions) were evaluated.
| Author (Year) | Data Source and Location | Time Period | Total With RSV, n | Intensive Care Unit Admission Proportions | Mechanical Ventilation Use Proportions | AHRQ Study Quality | ||
|---|---|---|---|---|---|---|---|---|
| By chronological age | ||||||||
| Rha (2020) [5] | NVSN: NY, OH, TN, MO, TX, WA, and CA | 2015–2016 | 0–2 mo: 342 3–5 mo: 184 6–11 mo: 178 | <6 mo of age 0–2 mo: 19.9% 3–5 mo: 18.5% | ≥6 mo of age 6–11 mo: 18.0% | <6 mo of age NR | ≥6 mo of age NR | Good |
| Anderson (2020) [56] | SENTINEL, 46 sites | 2014–2016 | <3 mo: 687 3 to <6 mo: 387 6 to <9 mo: 189 9 to <12 mo: 115 | <6 mo of age <3 mo: 55.6% 3 to <6 mo: 33.6% | ≥6 mo of age 6 to <9 mo: 31.7% 9 to <12 mo: 33.0% | <6 mo of age <3 mo: 28.7% 3 to <6 mo: 11.4% | ≥6 mo of age 6 to <9 mo: 6.9% 9 to <12 mo: 9.6% | Good |
| Wozniak (2016) [58] | 1 medical center: OH | 2013–2014; 2015–2016 | <3 mo: 28 <6 mo: 51 | <6 mo of age <3 mo: 64.3% <6 mo: 56.9% | ≥6 mo of age NR | <6 mo of age <3 mo: 32.1% <6 mo: 23.5% | ≥6 mo of age NR | Good |
| Arriola (2020) [42] | FluSurv-NET, 20 hospitals: CA, GA, OR, MN | 2014–2015 | 0–2 mo: 614 3–5 mo: 262 6–11 mo: 300 | <6 mo of age 0–2 mo: 35.3% 3–5 mo: 24.8% | ≥6 mo of age 6–11 mo: 17.7% | <6 mo of age 0–2 mo: 10.6% 3–5 mo: 3.1% | ≥6 mo of age 6–11 mo: 3.0% | Good |
| Rajah (2017) [57] | 1 medical center: OH | 2013–2015 | 0 to <3 mo: 29 3 to 6 mo: 29 6 to <12 mo: 33 | <6 mo of age 0 to <3 mo: 55.2% 3 to 6 mo: 48.3% | ≥6 mo of age 6 to <12 mo: 54.5% | <6 mo of age 0 to <3 mo: 37.9% 3 to 6 mo: 10.3% | ≥6 mo of age 6 to <12 mo: 12.1% | Good |
| By wGA | ||||||||
| Anderson (2020) [56] | SENTINEL, 46 sites | 2014–2016 | 29–32 wGA: 441 33–34 wGA: 571 35 wGA: 366 | Preterm (<37 wGA) 29–32 wGA: 48.1% 33–34 wGA: 44.5% 35 wGA: 39.3% | Full-term (≥37 wGA) NR | Preterm (<37 wGA) 29–32 wGA: 22.2% 33–34 wGA: 19.6% 35 wGA: 15.0% | Full-term (≥37 wGA) NR | Good |
| Leader (2003) [59] | 10 medical centers | 2000–2001 | 33–35 wGA: 48 Full–term: 36 | Preterm (<37 wGA) 33–35 wGA: 41.7% | Full-term (≥37 wGA) 33.3% | Preterm (<37 wGA) NR | Full-term (≥37 wGA) NR | Good |
| Krilov (2019) [47] | Optum Research Database | 2011–2017 | Preterm: 145 Term: 1671 | Preterm (<37 wGA) Total: 39.3% <3 mo: 52.2% 3–6 mo: 17.0% | Full-term (≥37 wGA) Total: 24.8% <3 mo: 27.6% 3–6 mo: 19.1% | Preterm (<37 wGA) Total: 11.7% <3 mo: 16.3% 3–6 mo: 3.8% | Full-term (≥37 wGA) Total: 6.0% <3 mo: 6.7% 3–6 mo: 4.7% | Fair |
| Forbes (2010) [61] | MarketScan Commercial Research Database | 2003–2007 | ≤32 wGA: 40 33–36 wGA: 173 ≥37 wGA: 1983 | Preterm (<37 wGA) ≤32 wGA: 19.5% 33–36 wGA: 21.9% | Full-term (≥37 wGA) ≥37 wGA: 9.6% | Preterm (<37 wGA) NR | Full-term (≥37 wGA) NR | Fair |
| Stevens (2000) [60] | 1 medical center: NY | 1992–1996 | ≤26 wGA: 23 27–28 wGA: 17 >28–30 wGA: 18 >30–32 wGA: 20 | Preterm (<37 wGA) ≤26 wGA: 4.3% 27–28 wGA: 17.6% >28–30 wGA: 16.7% >30–32 wGA: 25.0% | Full-term (≥37 wGA) NR | Preterm (<37 wGA) NR | Full-term (≥37 wGA) NR | Fair |
| By comorbidities | ||||||||
| Doucette (2016) [4]c | HCUP KID, NIS | 1997–2012 | High risk: 23 709 Non-high risk: 437 916 | Otherwise healthy NR | CHD, CLD, other conditions NR | Otherwise healthy 1997: 3.0% 2012: 4.5% | CHD, CLD, other conditions 1997: 18.7% 2012: 20.4% | Fair |
| Forbes (2010) [61] | MarketScan Commercial Research Database | 2003–2007 | CHD: 151 CLD: 41 | Otherwise healthy NR | CHD, CLD, other conditions CHD: 21.8% CLD: 13.3% | Otherwise healthy NR | CHD, CLD, other conditions NR | Fair |
| By insurance payer | ||||||||
| Fergie (2021) [46] | MarketScan Commercial and Multi-State Medicaid Databases | 2010–2017 | Medicaid: 10 651 Commercial: 4403 | Public (Medicaid) Total: 21.1% 29–34 wGA <3 mo: 50.5% 3 to <6 mo: 27.5% Term <3 mo: 19.8% <3 to 6 mo: 14.4% | Private (commercial) Total: 16.5% 29–34 wGA <3 mo: 40.1% 3 to <6 mo: 18.5% Term <3 mo: 16.4% <3 to 6 mo: 11.8% | Public (Medicaid) NR | Private (commercial) NR | Fair |
| McLaurin (2016) [6] | MarketScan Multi-State Medicaid and Commercial Claims and Encounters Database | 2003–2013 | Medicaid: 29 967 Commercial: 16 310 | Public (Medicaid) Total: 10.1% <29 wGA: 31.1% 29–30 wGA: 28.3% 31–32 wGA: 20.9% 33–34 wGA: 21.2% 35–36 wGA: 14.4% Term: 8.0% | Private (commercial) Total: 9.7% <29 wGA: 22.6% 29–30 wGA: 20.8% 31–32 wGA: 14.0% 33–34 wGA: 16.6% 35–36 wGA: 15.3% Term: 8.5% | Public (Medicaid) Total: 3.0% <29 wGA: 14.0% 29–30 wGA: 9.0% 31–32 wGA: 9.0% 33–34 wGA: 8.0% 35–36 wGA: 5.0% Term: 2.0% | Private (commercial) Total: 1.6% <29 wGA: 6.0% 29–30 wGA: 9.0% 31–32 wGA: 5.0% 33–34 wGA: 6.0% 35–36 wGA: 4.0% Term: 1.0% | Fair |
Abbreviations: AHRQ, Agency for Healthcare Research and Quality; CHD, congenital heart disease; CLD, chronic lung disease of prematurity; FluSurv-NET, Influenza Hospitalization Surveillance Network; HCUP, Healthcare Cost and Utilization Project; KID, Kid’s Inpatient Database; NIS, National (Nationwide) Inpatient Sample; NR, not reported; NVSN, National Vaccine Surveillance Network; RSV, respiratory syncytial virus; wGA, weeks’ gestational age.
Study and population characteristics of the publications described in this table are provided in Supplementary Table 2.
The proportions of intensive care unit admissions or mechanical ventilation use among infants hospitalized for RSV were considered.
Nationally representative data sets were used in this study. Higher-risk CHD, lower-risk CHD, CLD, Down syndrome without CHD, congenital airway anomalies, preterm births, and others (cystic fibrosis with pulmonary manifestations, neuromuscular disease, HIV, immunodeficiency, and other genetic metabolic musculoskeletal conditions) were evaluated.
MV Use Among RSVH Infants: US Nationally Representative Data Versus Nonnationally Representative Data
Only Doucette et al (2016) used nationally representative data and reported MV use proportions from 1997 to 2012 [4] (Table 5). RSVH infants with high-risk comorbidity conditions had high MV use (20.4%, which was approximately 5 times that for non–high-risk infants from 1997 to 2012) [4]. From nonnationally representative data sources, 16 studies captured MV use proportions among RSVH infants, not restricted by sociodemographic and clinical variables (range, 2.5%–31.8% from 1994 to 2017; Supplementary Table 4). Six reported MV use proportions stratified by chronological age (n = 4) [42, 56–58], wGA (n = 2) [47, 56], and insurance payer (n = 1) [6] (Table 5). Higher MV use was noted for infants aged <6 months versus those aged ≥6 months (range, 3.1%–37.9% vs range, 3.0%–12.1% from 2013 to 2016). Of the 2 studies reporting MV use proportions by wGA [47, 56], 1 included proportions that were also stratified by chronological age. The highest MV use was observed among younger preterm infants (16.3% for age <3 months) compared with older full-term infants (4.7% for ages 3–6 months) from 2011 to 2017 [47]. MV use was higher among Medicaid-insured infants than privately insured infants, and this trend was consistent across all wGA categories (3% for Medicaid overall vs 1.6% for private overall from 2003 to 2013) [6]. No data were available by race/ethnicity. Similar patterns of ICU admissions and MV use were observed for bronchiolitis (see Supplementary Materials).
DISCUSSION
To our knowledge, this is the first review systematically evaluating the burden of RSV and HCU including transition across health care settings after the initial RSV diagnosis in US infants across all health care settings. Although the RSV literature landscape is vast, and this SLR identified 141 studies meeting PECOS criteria, less than half of the included studies provided the outcomes of interest. Studies reporting infant RSV ED or OP visit rates were even smaller, representing only 5% of the included studies. Burden and HCU data in the UC setting were not available. We also observed variability in the study population characteristics and data gaps across studies (different stratification groups by chronological age, wGA, comorbidity conditions, insurance payer, and race/ethnicity), making it difficult to summarize outcomes. Only 7 studies [2, 4, 7, 13, 17, 19, 22] reported on the study outcomes of interest (hospitalization rates and MV use proportions only) using nationally representative data sets. No study reported ED or OP visit rates using nationally representative data sets. Importantly, RSV evidence was lacking for late preterm to full-term and otherwise healthy infants. Palivizumab has been the only available immunoprophylaxis of RSV since 1998; thus, RSV studies were focused on those eligible (eg, premature infants) and the impact of the immunoprophylaxis policy revision in 2014. While changes in policy recommendations may have impacted the RSV burden and HCU, eligible infants represent a minute proportion of the general population [62]. As new RSV immunization products are in development and may be soon become available for all infants, RSV burden and HCU will need to be described for all infants.
In the studies reporting hospitalization and visit rates, different RSV and bronchiolitis definitions were used to identify cases. With the variations in laboratory testing and ICD diagnosis codes, the results were likely to have been affected. For ED and OP data, no summary ranges could be provided because few studies were available for each type of rate reported. Furthermore, as this SLR included studies published since 2000, the observed changes in RSV burden and HCU may be also impacted by heterogeneity in testing practices and type (viral culture, molecular diagnostics, etc.) across time and regions [63]. Another challenge to describe the true burden of RSV and HCU is the potential underestimation of RSV cases as systematic laboratory testing for RSV in the United States is not recommended [9].
In a previous review [64], the study authors observed that results (annual rate range, 8.4–40.8 per 1000) differed by study design, with rates from surveillance studies being half of those from retrospective claims database studies. In contrast to the previous review [64], we found that rate ranges differed by the type of rates reported (annual average rate per year vs rates for the entire study period), data source (eg, nationally representative vs nonnationally representative), population characteristics, and by time. For infants not restricted by sociodemographic and clinical variables, 18 studies reported RSVH rates, of which 16 were retrospective cohorts while 2 were prospective cohorts; none were surveillance studies [2, 4, 7, 13, 17, 19, 22, 25–35]. From nationally representative data sets [2, 4, 7, 13, 17, 19, 22], annual average RSVH rates ranged from 11.6 per 1000 per year among infants aged 6–11 months in 2006 to 50.1 per 1000 per year among infants aged 0–2 months in 1997, while RSVH rates by primary diagnosis for the entire study period ranged from 22.0 to 22.7 per 1000 in 1997–1999 and 1997–2000, respectively. From year to year, we observed declining annual average RSVH rates (>10% from 1997 to 2012). From nonnationally representative data [25–30, 32, 34, 35], annual average RSVH rates among all infants ranged from 0 per 1000 per season during September–October of 2009–2010/2010–2011 to 118 per 1000 per season during November–March of 2009–2010/2010–2011, and RSVH rates for the entire study period ranged from 15.9 per 1000 in 1998–2002 to 37.3 per 1000 in 1999–2010. These findings suggest heterogeneity in the studies, with differences in methodology, time periods, geographic locations, and population characteristics; thus, quantitative synthesis of RSVH rates may not be appropriate.
Data assessed in this SLR showed high HCU associated with RSV. The transition of infants across health care settings after the initial RSV diagnosis has not been described since 2011; 3 studies [25, 54, 55] reported infants with RSV having multiple visits after the initial encounter, indicating that the burden on the infant continues beyond the initial infection. Up to 71% and up to 38% of RSVH infants need ICU admission or MV, respectively, indicating RSV burden also spans across the health care system. However, because of the heterogeneity of study populations and methodology, ICU admission and MV use were variable among RSVH infants. To comprehensively understand RSV epidemiology, further study is needed to elucidate HCU patterns including transitions across settings after the initial RSV diagnosis.
The main strength of this SLR is its rigorous methodology. This SLR is also comprehensive and evaluated several outcomes in all health care settings. Standard RoB tools were used, and all data abstraction and RoB evaluations were implemented with strict procedures and quality control. However, our findings may not be generalizable to those aged >1 year and those outside of the United States. The onset of coronavirus disease 2019 (COVID-19) and its impact on RSV epidemiology were also not considered in this SLR.
Because most studies (82%) were in the IP setting, RSV epidemiology in the ED, OP, and other settings remains understudied. Substantial variability in both disease burden and HCU data is observed due to critical differences in person, place, and time across the studies, creating challenges in summarizing the US infant RSV data. Additional high-quality studies need to be conducted to understand the complete disease burden of RSV among all US infant populations (including otherwise healthy and late preterm to full-term infants) and across all health care settings.
Supplementary Data
Supplementary materials are available at The Journal of Infectious Diseases online (http://jid.oxfordjournals.org/). Supplementary materials consist of data provided by the author that are published to benefit the reader. The posted materials are not copyedited. The contents of all supplementary data are the sole responsibility of the authors. Questions or messages regarding errors should be addressed to the author.
Notes
Acknowledgment. Editorial assistance was provided by inScience Communications (Philadelphia, PA). This work was performed in accordance with current Good Publication Practice guidelines and was funded/sponsored by Sanofi.
Financial support. This work was funded/sponsored by Sanofi and AstraZeneca.
Supplement sponsorship. This article appears as part of the supplement “Respiratory Syncytial Virus Disease Among US Infants,” sponsored by Sanofi and AstraZeneca.
Presented in part: International Society of Pharmacoepidemiology 2021 Annual Conference.
References
Author notes
Presented in part: 37th ICPE (International Conference on Pharmacoepidemiology & Therapeutic Risk Management), virtual conference, August 2021.
Potential conflicts of interest. EpidStrategies received a grant from Sanofi for this research. M. S., N. M., L. C. B., and J. P. F. are employees of EpidStrategies. C. B. N. is an employee of Sanofi and may hold shares and/or stock options in the company.
All authors have submitted the ICMJE Form for Disclosure of Potential Conflicts of Interest. Conflicts that the editors consider relevant to the content of the manuscript have been disclosed.

