


Abstract
Cerebral malaria (CM) is a rare, but severe and frequently fatal outcome of infection with Plasmodium falciparum. Pathogenetic mechanisms include endothelial activation and sequestration of parasitized erythrocytes in the cerebral microvessels. Increased concentrations of glycosaminoglycans in urine and plasma of malaria patients have been described, suggesting involvement of endothelial glycocalyx.
We used lectin histochemistry on postmortem samples to compare the distribution of multiple sugar epitopes on cerebral capillaries in children who died from CM and from nonmalarial comas.
N-acetyl glucosamine residues detected by tomato lectin are generally reduced in children with CM compared to controls. We used the vascular expression of intercellular adhesion molecule 1 and mannose residues on brain capillaries of CM as evidence of local vascular inflammation, and both were expressed more highly in CM patients than controls. Sialic acid residues were found to be significantly reduced in patients with CM. By contrast, the levels of other sugar epitopes regularly detected on the cerebral vasculature were unchanged, and this suggests specific remodeling of cerebral microvessels in CM patients.
Our findings support and expand upon earlier reports of disruptions of the endothelial glycocalyx in children with severe malaria.
Cerebral malaria (CM) is one of the most severe complications of Plasmodium falciparum infection. Progression to CM after infection with the parasite is multifactorial. These factors include parasite surface adhesion molecules that bind variably to human endothelial molecules [1–3] and increased systemic as well as localized inflammation [4–6]. Recently, cerebral swelling has been shown to be closely associated with a fatal outcome in children with CM [7].
The vascular component in the pathogenesis of CM has been highlighted in several studies [8, 9]. In CM, multiple proteins on the endothelial surface are upregulated, facilitating endothelial adhesion, whereas the expression of endothelial protein C receptor is reduced [4, 5, 9, 10]. Moreover, endothelial glycans have been shown to be involved in the binding of P. falciparum–infected erythrocytes [11, 12] but are also able to block the binding to CD36 in experimental settings [13].
Lately, the endothelial glycans, collectively termed the endothelial glycocalyx, have received considerable interest, as they are involved in maintaining endothelial homeostasis [14]. Multiple stimuli, including several involved in malaria pathogenesis, can lead to shedding of the endothelial glycocalyx [14–17]. In experimental malaria models, detailed analyses of electron microscopic images showed that glycocalyx loss from cerebral blood vessels was more pronounced in mice dying from cerebral malaria than in mice with uncomplicated malaria [18, 19]. Several recent clinical studies suggest that the extent of shedding is associated with malaria severity [15, 20, 21]. These measurements were based on plasma and urine samples where the shed glycocalyx components were present at increased levels. When healthy volunteers are infected with P. falciparum and P. vivax in a controlled clinical trial, only markers of endothelial activation, and not glycocalyx loss, increased significantly during the trial period. This suggests that plasma syndecan 1 and glycosaminoglycans measured in urine are not the first entities lost but instead may be shed as a response to endothelial activation [22].
The glycocalyx could potentially modulate malaria pathogenesis in various ways [16]. Cytoadherence of P. falciparum–infected erythrocytes in the microvasculature may be mediated directly by glycans [11, 12, 23]. Alternatively, or in addition, the shedding of the endothelial glycocalyx that occurs after endothelial activation exposes endothelial receptors normally buried in the glycocalyx possibly enhances sequestration [2, 13, 16]. Loss of the proteoglycan syndecan 1, a major component of the glycocalyx, has been shown to induce a proinflammatory phenotype in endothelial cells [24], but shedding may also facilitate resolution of local inflammation by removal of localized chemokines [25]. Thus, the intimate regulation of glycocalyx composition at the endothelial cell level seems important in diseases with an inflammatory component, but the actual contribution remains to be determined.
The actual glycan components on the cerebral microvasculature and their association with clinical malaria have not been addressed to date. In this study, we used a panel of lectins with affinities to a wide spectrum of carbohydrates to address these questions. This allows us to assess the level of expression of these carbohydrates in the cerebral microvasculature of patients across different P. falciparum pathologies postmortem. We compared these levels to relevant controls to address to which extent glycans are modified on the cerebral microvasculature in cerebral malaria.
METHODS
Patients
The study was conducted on tissues provided by the Blantyre Malaria Project from the autopsy study that was conducted from 1996 to 2009 with the patient recruitment, care, informed consent, autopsy procedures, and processing well described in previous studies [7, 26]. For this study, patients were classified by final histological diagnosis as CM1, CM2, CM3, and nonmalarial controls [7, 26]. In brief, CM1 was defined as patients meeting the clinical case definition of cerebral malaria but found to only have sequestration without other obvious brain tissue pathology (n = 12); CM2 was defined similarly except that ring hemorrhages were found (n = 22); and CM3 met the same clinical case definition, but had no evidence of sequestration or other damage, and had another anatomic cause of death determined (n = 13). Nonmalarial comas, encephalopathies, and incidental parasitemia served as control group (n = 10).
Brain Sample Preparation
Median time from death to autopsy was 6 hours (range, 2–17.5 hours). Immediately after gross dissection, weighing, and photography, sections of fresh brain tissue from multiple brain sites were placed in tissue cassettes and submerged in a 10:1 ratio of 10% neutral buffered formalin to tissue for at least 24 hours before processing to paraffin-embedded tissue blocks. Blocks were stored at room temperature until use.
Immunohistochemistry and Lectin Histochemistry
Unstained slides from brain tissue (frontal lobe) were cut at 5 µm thickness. Paraffin was removed by 3 rinses in xylene (5 minute/rinse, Sigma-Aldrich, Søborg, Denmark) followed by rehydration in decreasing concentrations of ethanol (2× absolute ethanol, 1× 96% ethanol, 1× 70% ethanol), with each step for 5 minutes. Epitopes were retrieved by heat-induced epitope retrieval (HIER). HIER was performed in citrate buffer (pH = 6, Dako, Glostrup, Denmark) using microwaving at 95 °C for 10 minutes (H2850, EB Sciences, E Granby, Connecticut). Sections stayed submerged and slowly cooled in citrate buffer for at least 20 minutes post-HIER. Then sections were transferred to Tris-buffered saline (TBS, Sigma-Aldrich). After 3 rinses, sections were blocked for 60 minutes in 10% goat serum (Sigma-Aldrich). Primary antibodies were diluted in blocking buffer (10% goat serum) and added to the sections for overnight incubation at 4 °C.
The following antibodies and lectins were used: Ulex europaeus agglutinin (UEA, detecting α-1,2-linked fucose residues), succinylated wheat germ agglutinin (sWGA, detecting dimers and trimers of N-acetyl glucosamine [GlcNac] residues), Helix pomatia agglutinin (HPA, detecting GalNac residues and type A erythrocytes), Sambucus nigra agglutinin (SNA, detecting mostly α-2,6-linked sialic acid), Galanthus nivalis lectin (GNL, detecting α-1,3-linked mannose residues), and tomato lectin (LEA, detecting monomers of α-1,3 GlcNac residues). HPA was purchased from ThermoFisher (Waltham, Massachusetts) while all other lectins were purchased from Vector Laboratories (Burlingame, California). Anti-intercellular adhesion molecule 1 (ICAM-1) was used as an inflammatory marker (catalog number AB53013, Abcam, Cambridge). Antithrombin-3 (AT3, catalog number NBP1-90076, Novus Biologicals, Bio-Techne, United Kingdom) is localized on the basal side of the endothelium anchored via heparan sulfate chains [27]. Staining for AT3 gave information on whether this depot was changed. CD34 (clone 581, BD Biosciences, San Jose, California) was used as a housekeeping protein and as a mask for detecting blood vessels. Details on dilutions of primary antibodies and lectins are found in Table 1.
Overview of Primary Antibodies and Lectins Used in the Study
| Antigen | Supplier | Concentration/Dilution | Species |
|---|---|---|---|
| CD34, clone 581 | BD Biosciences | ×50 | Mouse IgG |
| AT3 | Novus | ×100 | Rabbit |
| ICAM-1, clone EP1442Y | Abcam | ×50 | Rabbit |
| Helix pomatia agglutinin | ThermoFisher | 5 µg/mL | NA |
| Succinylated wheat germ agglutinin | Vector Labs | 5 µg/mL | NA |
| Galanthus nivalis lectin | Vector Labs | 5 µg/mL | NA |
| Sambucus nigra agglutinin | Vector Labs | 5 µg/mL | NA |
| Lycopersicon esculentum agglutinin | Vector Labs | 5 µg/mL | NA |
| Ulex europaeus agglutinin | Vector Labs | 5 µg/mL | NA |
Abbreviations: IgG, immunoglobulin G; NA, not applicable.
After overnight incubation, sections were washed with TBS Tween (TBST; 0.05% Tween 20, ThermoFisher) followed by secondary antibodies. The following secondary antibodies were used: goat antimouse Alexa568 (ThermoFisher) and goat antirabbit Alexa405 (ThermoFisher). All secondary antibodies were diluted to 2 µg/mL. Secondary antibodies had been preadsorbed against multiple species to avoid cross-reactivity. Lectins were all used as fluorescently labeled (either fluorescein or Dylight649/Alexa647) and applied together with the secondary antibody at day 2. After incubation with secondary antibodies and lectins, sections were washed using TBST followed by reduction of autofluorescence by 3 minutes incubation using Trueview (Vector Laboratories) following manufacturer’s instructions. Last, sections were washed in phosphate-buffered saline, followed by a quick rinse in MiliQ water before being mounted in Vectashield Brilliance (Vector Laboratories). Each staining was performed in duplicate sections. The HIER protocol employed did not affect staining intensity or pattern of lectins. Lectin specificity was tested using preincubation with corresponding sugars before adding to sections as recommended by vendor (Vector Laboratories).
Microscopy
Stained sections were initially assessed with either wide-field microscope (Carl Zeiss, Jena, Germany) or with a confocal microscope (LSM710 or LSM780, Carl Zeiss). When stainings had been optimized, tissue sections were stained and scanned using a slide scanner (Axio Scan.Z1, 20× objective, NA: 0.8, Carl Zeiss) (Figure 1A). Each fluorescent channel was recorded individually to avoid crosstalk between channels. Images were recorded as 16-bit. Sections were also assessed for the presence of hemozoin crystals (Figure 1B) using a brightfield microscope equipped with polarization (Carl Zeiss).
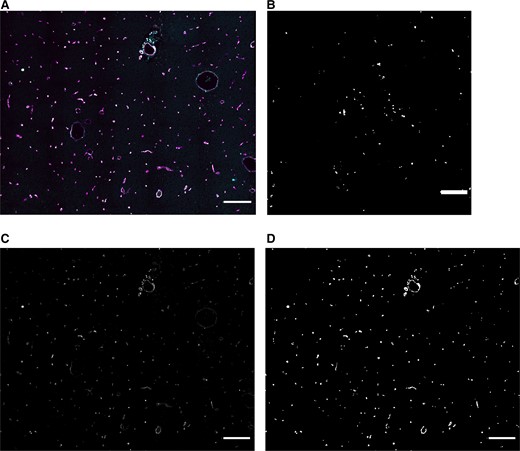
Example of acquired 4-color image and thresholding result. A, Sections were slide scanned and stored as 4-color images. This image is a small part of the scanned and analyzed area. B, Sequestration of Plasmodium falciparum was confirmed by using polarization microscopy. C, Image containing CD34+ vessels. This is used to detect brain vessels. (Also shown in white in A.) D, A mask of the image in C. Scale bars = 200 μm.
Image Analysis
Images were stitched using Zeiss Blue (version 2.6, Carl Zeiss) and analyzed using ImageJ [28]. A macro was designed to identify brain vessels based on CD34 expression. Vessel mask was made by initially applying a median filter (radius = 5) to the CD34 channel. An automated threshold using the Triangle method was set for CD34+ vessels. The thresholded vessels were converted to masks, dilated, and closed leading to smoothed CD34+ regions of interest. The pixel intensity was divided by 255 resulting in values of 0 (background) and 1 (region of interest). This mask was multiplied with the other channels after they had been subjected to background subtraction (rolling ball, size = 15 pixels). This enabled analysis of pixel intensity for each marker from the original recordings in 16-bit. The median pixel intensity of all thresholded vessel segments from 2 sections per staining was calculated and plotted in the presented figures.
Statistical Analyses
Due to the small sample size in some groups as well as the nonnormal distribution of data, nonparametric analyses were utilized. Kruskal-Wallis test was used and followed by post hoc tests if significant. Data are summarized as median values with interquartile ranges. Effect size (ES) was calculated using the effectsize package for R [29] using the Glass rank biserial correlation for nonparametric datasets. The ES goes from –1 to +1 where these lower and upper boundaries indicate level of overlap with the control group. The value 0 (zero) indicates full overlap. Statistical analyses were performed using Prism for macOS (version 9.1, GraphPad, San Diego, California) and R Studio (version 1.3) [30].
RESULTS
Image Analysis Based on CD34 Expression Detects Blood Vessels
The robust expression of CD34 on cerebral microvessels enabled use of this information as a mask for image analysis (Figure 1C). By using the automated Triangle threshold algorithm, the vast majority of CD34+ cells were detected and included in the mask used for image analysis (Figure 1D). Hemorrhages were not CD34+ and thus not detected. Also, if lectins detected nonvascular components in brain tissue, this did not contribute to nor skew the interpretation of vascular expression since this was not part of the mask defined by positive expression of CD34. Since hematopoietic stem cells also express CD34, these could potentially be registered inside the vessels by the mask. This was not seen.
CM Increases Endothelial Inflammation
ICAM-1 expression in patients with CM1 and CM2 was significantly higher than in nonmalarial controls (P = .002, ES = −0.9 and P = .03, ES = −0.63) (Figure 2A). Representative images of CM1 and non-CM controls are seen in Figure 2B and 2C. In CM, increased exposure of mannose residues resulted in higher binding of specific lectin. In the CM2 subpopulation, the levels were significantly higher than in the control group (P = .01, ES = −0.55) (Figure 2D). Representative images of CM2 and non-CM controls are seen in Figure 2E and 2F, respectively. AT3 levels on the vasculature were not different across the groups (P = .4).
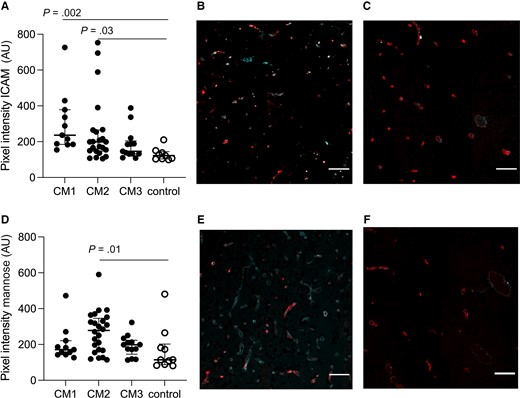
Intercellular adhesion molecule 1 (ICAM-1) and mannose are increased in cerebral capillaries in patients with cerebral malaria (CM). A, CM1 as well as CM2 had significantly higher ICAM-1 expression as compared to non-CM controls (P = .002 and P = .03). B, Representative image of ICAM-1 expression in CM1. CD34 is shown in red; ICAM-1 is marked in cyan. C, Representative image of ICAM-1 expression in non-CM controls. CD34 is shown in red; ICAM-1 is marked in cyan. D, Vascular mannose expression was increased in vessels when comparing across groups and CM2 had significantly higher levels of mannose residues when compared with non-CM controls (P = .01). E, Representative image of mannose expression in CM2. CD34 is shown in red; mannose is marked in cyan. F, Representative image of mannose expression in non-CM controls. CD34 is shown in red; mannose is marked in cyan. Scale bars = 100 μm. Images represent the median values in the groups. In A and D, each dot represents a subject. The median value is marked with a line, and bars show the interquartile ranges.
Levels of Fucose Residues on Cerebral Blood Vessels Are Unchanged While Sialic Acid Residues Are Reduced
The level of fucose residues on cerebral microvessels was unchanged when comparing with control group (P > .34) (Figure 3A). Levels of sialic acid residues were significantly reduced in patients with CM1 and CM2 (P = .002, ES = 0.96 and P = .01, ES = 0.7, respectively) (Figure 3B). Representative images of non-CM controls and CM1 patients are shown in Figure 3C and 3D.
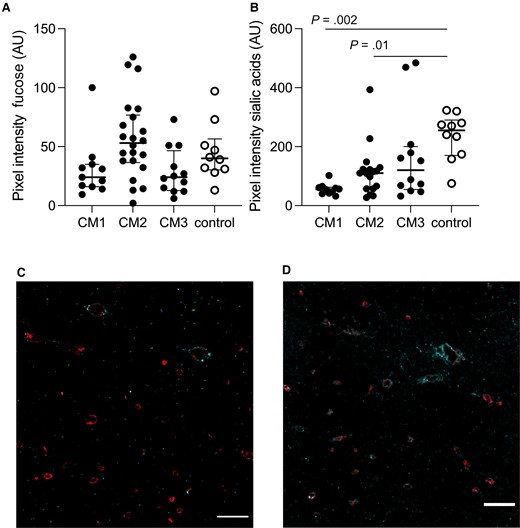
Fucose levels are unchanged and sialic acid residues are reduced in patients with cerebral malaria (CM). A, Fucose residues were present to the same extent in all groups (P > .34). B, Sialic acids were notably reduced in CM1 and CM2 patients (P = .002 and P = .01). C, Representative image shows levels of sialic acid residues in cyan in CM1 patients overlaid with CD34 in red. D, Representative image shows levels of sialic acid residues in cyan in the control group overlaid with CD34 in red. Scale bars = 100 μm. Images represent the median values in the groups. In A and B, each dot represents a subject. The median value is marked with a line, and bars show the interquartile ranges.
Specific GlcNac Residues Are Lost in CM Patients
The lectins sWGA and LEA both detect GlcNac residues. In this study, sWGA-binding did not differ between the groups (Figure 4A, P = .2). In contrast, LEA-specific epitopes were significantly reduced in all 3 CM groups (Figure 4B) (CM1: P = .009, ES = 0.96; CM2: P = .01, ES = 0.71; CM3: P = .0005, ES = 0.94). Representative images of non-CM controls as well as CM1–CM3 are shown in Figure 4C–F. In contrast, expression of GalNac residues detected using HPA did not differ in brain capillaries from study participants with and without CM (P = .7).
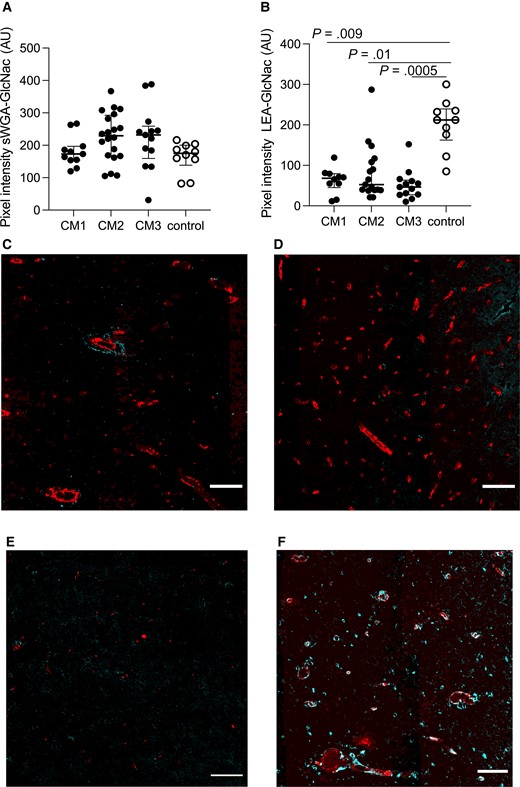
Specific regulation of N-acetyl glucosamine (GlcNac) residues on brain vessels. A, No significant changes for succinylated wheat germ agglutinin (sWGA)–specific GlcNac epitopes were seen. B, Tomato lectin (LEA)–specific GlcNac epitopes were significantly decreased in all 3 cerebral malaria (CM) groups (CM1: P = .009; CM2: P = .01; CM3: P = .0005). C–F, Representative images of LEA-specific GlcNac expression in cyan, overlaid with CD34 in red, in CM1 (C), CM2 (D), CM3 (E), and non-CM controls (F). Scale bars = 100 μm. Images represent the median values in the groups. In A and B, each dot represents a subject. The median value is marked with a line, and error bars show the interquartile ranges.
DISCUSSION
Preclinical studies as well as studies using plasma and urine biomarkers have suggested rearrangement and shedding of the endothelial glycocalyx in malaria [15, 18–22, 31]. This study aimed to study to what extent these changes are detectable in brain vessels in archived, pediatric CM samples postmortem. The analyses show a considerable reduction in GlcNac epitopes as detected by the lectin LEA. Sialic acid residues were significantly reduced in CM1 and CM2 patients. Inflammatory markers were correspondingly increased in the cerebral microvessels, as shown previously for ICAM-1 [4, 6].
GlcNac is part of O- as well as N-linked glycans [32]. Previous studies have described in detail how LEA and sWGA have preference for the same sugar epitope—namely, GlcNac—but that the constellation greatly affects binding affinity [33–36]. Our results suggest that only LEA-specific epitopes are affected during the course of malaria, while sWGA-specific epitopes did not change. sWGA is specific for terminal GlcNac epitopes only and preferably binds dimers and trimers, whereas LEA binding is facilitated by GlcNac oligomers [33–35]. The specific epitopes detected by the 2 related lectins could be present on different glycans and glycoproteins and thus are not identically remodeled or lost in late-stage malaria. Attempts have been made to characterize which glycoproteins carry which glycosylation patterns [37–39], but detailed information on the subject does not exist currently. Related to this finding, in terminal experimental CM, LEA-specific GlcNac epitopes were found to be increased in plasma [18].
We also found terminal mannose to be upregulated as detected by GNL. Mannose is not normally accessible for binding, but during stressful conditions N-glycans are hypoglycosylated and thus overexpress mannose residues [37]. Recently, it was shown that P. falciparum–infected erythrocytes were associated with increased levels of mannose residues and that this was associated with oxidative stress [40]. Some of the same mechanisms might also induce high mannose expression on the endothelium. High mannose expression on adhesion molecules such as ICAM-1 and vascular cellular adhesion molecule 1 has been shown to increase binding affinity [41] and thus can prime for more interactions with leukocytes. In relation to this finding, ICAM-1 expression on cerebral capillaries was also shown to be increased, as has been shown in previous studies [4, 5]. In contrast to what was seen for placental malaria where the syncytiotrophoblasts are lost, thereby exposing chondroitin sulfate A [23], loss of endothelial cells is not considered part of CM-induced changes and AT3, which is found on the basal side of the endothelium [27], did not change its expression in this cohort.
Besides GlcNac as detected by LEA and sWGA, HPA, UEA-1, and SNA are typically used as robust markers for human endothelial cells [42, 43]. Fucose and GalNac levels were not significantly changed but sialic acids were detected at significantly lower levels in subjects with CM1 and CM2, suggesting that the glycoproteins carrying this type of glycosylation are remodeled or truncated [38, 39, 44]. The α-2,6-linked sialic acids have previously been shown to be particularly prone to inflammation-induced proteolysis as compared with α-2,3-linked sialic acids [44], fitting well with increased ICAM-1 and exposure of mannose residues. Another report on the contrary showed α-2,6-linked sialic acids to be increased in response to inflammation, and also on adhesion molecules including ICAM-1 [39]. However, in the report the level of tumor necrosis factor is notably higher, suggesting differential regulation depending on concentration of the inflammatory stimulus [39, 44].
Glycan remodeling of the vasculature has previously been shown in experimental models of malaria, sepsis, and atherogenesis [17, 19, 37]. By injecting different lectins intravenously, it was shown that lectins including LEA that labeled the healthy vasculature consistently showed focal loss under acute inflammatory conditions and in these spots mannose residues were detected [36]. Thus, as is seen for luminal proteins [4, 5, 10], the glycans also remodel upon endothelial activation and thus also contribute to a changed luminal surface.
One limitation in the study is the number of subjects included in each group. The cohort has very well-characterized CM patients that are split into subcategories depending on pathological findings. Conservative methods were chosen and included nonparametric analyses of ES that indicate whether the observed changes could be of clinical significance. The numbers are based on 2 sections per subject and thus more robust values are to be expected. The fixation method used for the brain tissue in this study is also a limitation [45]. Immersion fixation has been shown to make some glycocalyx components (syndecan 1 and heparan sulfate) appear more thin and even scarce. The markers used in this study were not selective for glycosaminoglycans and proteoglycans and thus tissue processing is not expected to affect markers selectively and skew interpretations. Another limitation is the diversity of cerebral pathophysiology. In this study, we focus on a single region of the brain whereas magnetic resonance imaging studies show regional differences [7, 46]. This could affect interpretation of studies like this focusing on microvascular changes.
The endothelial glycocalyx has been shown to be involved either directly or indirectly in various infectious diseases [11, 12, 17, 47, 48]. In malaria, shedding of the endothelial glycocalyx seems to be part of pathogenesis and also associated with severity [15, 18, 21, 31]. It has previously been suggested [16] and later also supported that this structure could shield luminal antigens used for parasite cytoadhesion [13, 49]. Considering that glycocalyx remodeling can foster more cytoadhesion of leukocytes and infected erythrocytes, a more complete understanding of how the glycocalyx is involved in malaria pathogenesis is needed [11, 12, 25, 37, 50]. This first step using a lectin panel in pediatric CM patients indicates that notable rearrangement takes place and suggests that the endothelial glycocalyx could play an active role in cytoadhesion and malaria pathogenesis.
Notes
Acknowledgments. We acknowledge the use of microscopes at Core Facility for Integrated Microscopy at University of Copenhagen and their supportive staff. We acknowledge the use of the histology microwave oven at Copenhagen University Hospital (principal investigator: Jørgen Kurtzhals).
Disclaimer. The funder did not influence conduct or interpretations of findings.
Financial support. C. H. was funded by the Independent Research Fund in Denmark (grant number: 6110-00554).
References
Author notes
Potential conflicts of interest. The authors: No reported conflicts of interest.
All authors have submitted the ICMJE Form for Disclosure of Potential Conflicts of Interest. Conflicts that the editors consider relevant to the content of the manuscript have been disclosed.

