


Abstract
While detection of severe acute respiratory syndrome coronavirus 2 (SARS-CoV-2) by diagnostic reverse-transcription polymerase chain reaction (RT-PCR) is highly sensitive for viral RNA, the nucleic acid amplification of subgenomic RNAs (sgRNAs) that are the product of viral replication may more accurately identify replication. We characterized the diagnostic RNA and sgRNA detection by RT-PCR from nasal swab samples collected daily by participants in postexposure prophylaxis or treatment studies for SARS-CoV-2. Among 1932 RT-PCR–positive swab samples with sgRNA tests, 40% (767) had detectable sgRNA. Above a diagnostic RNA viral load (VL) threshold of 5.1 log10 copies/mL, 96% of samples had detectable sgRNA with VLs that followed a linear trend. The trajectories of diagnostic RNA and sgRNA VLs differed, with 80% peaking on the same day but duration of sgRNA detection being shorter (8 vs 14 days). With a large sample of daily swab samples we provide comparative sgRNA kinetics and a diagnostic RNA threshold that correlates with replicating virus independent of symptoms or duration of illness.
Coronaviruses such as severe acute respiratory syndrome coronavirus 2 (SARS-CoV-2), are large, positive-sense, single-stranded RNA viruses that generate structural and accessory proteins through a process of discontinuous transcription, with the resulting subgenomic RNAs (sgRNAs) encoding the leader transcription regulatory sequence in close proximity to the target gene [1, 2]. These sgRNA transcripts indicate active viral replication and may be used to discriminate recently transcribed viral RNA from residual genomic material [3, 4]. Prior studies have indicated that SARS-CoV-2 persistently detectable by diagnostic reverse-transcription polymerase chain reaction (RT-PCR) beyond 10 days may reflect residual genomic material rather than replicating virus, suggesting that findings of prolonged, positive RT-PCR findings in treatment and transmission studies may not accurately reflect replicating virus [5, 6]. This time course of infectious viral shedding is influenced by multiple factors including disease severity, degree of immunocompromise, and emerging immune responses [5, 7, 8].
Prolonged diagnostic RT-PCR positivity after an individual is no longer infectious poses public health challenges. For example, during the Omicron variant wave of coronavirus disease 2019 in the United States, such a large fraction of the populated tested positive that staff shortages were experienced in critical sectors such as healthcare, leading health authorities to shorten recommended self-isolation periods and recommend return to work even for individuals who continue to test positive with diagnostic RT-PCR.
Discrimination between replicating virus and residual genomic material could help optimize the period of self-isolation to reduce onward transmission while also reducing unnecessary loss of productivity. It could also help identify persons with SARS-CoV-2 infection who would benefit clinically from antivirals and inform prevention strategies among their contacts. Viral culture and quantification by plaque assays provide a reference standard for assessing infectivity but are not readily available at large scale for a diagnostic assay.
Detection of sgRNA in clinical samples has been suggested as an additional diagnostic tool to track infectious virus [6, 9]. We leveraged a large sample set from 2 outpatient studies that longitudinally collected nasal swab samples after exposure to or infection with SARS-CoV-2, capturing presymptomatic and asymptomatic infections in the postexposure prophylaxis (PEP) study and early infections (<72 hours) in high-risk outpatients in the Treatment study [10, 11]. Our goal was to investigate the relationship between sgRNA and diagnostic RNA viral loads (VLs), identify the diagnostic PCR VL that correlates with replicating virus independent of symptom onset or time from first positive test, and characterize the kinetics of sgRNA expression over time.
METHODS
Study Population and Procedures
The study population was derived from 2 double-blinded randomized controlled trials (NCT04328961 and NCT04354428) evaluating PEP and treatment for SARS-CoV-2 [10, 11]. The study enrolled participants from around the United States in a remote trial between March and August 2020. For PEP, we evaluated hydroxychloroquine compared with an ascorbic acid control for prevention of SARS-CoV-2 infection beginning a median of 2 days after exposure to a SARS-CoV-2–positive contact [10]. PEP participants self-collected daily nasal swab samples for 14 consecutive days, followed by a swab sample on day 28.
In the parallel Treatment study, infected participants diagnosed within the preceding 72 hours self-collected nasal swab samples on days 1–14, 21, and 28 and were treated with hydroxychloroquine with or without azithromycin [11]. The PEP participants were recruited based on early exposure (within 96 hours) to SARS-CoV-2 whereas Treatment participants represented recently infected individuals. Study procedures were conducted with institutional review board approval and informed consent was obtained from all study participants. Neither prophylactic nor treatment medication was found to be effective at reducing SARS-CoV-2 infections or shedding as determined by RT-PCR, and thus we used intervention and control samples for all analyses [10, 11].
Diagnostic RNA– and sgRNA-Positive Samples
Nasal swab samples were tested for SARS-CoV-2 RNA by means of real-time RT-PCR using the Centers for Disease Control and Prevention N1 and N2 primer sets targeting the nucleocapsid gene, as described elsewhere [12]. In brief, RNA was extracted using MagNA Pure LC or MagNA Pure 96, with 200-µL input and 50-µL elution volumes [13]. As an internal control, EXO RNA was added at the start of RNA extraction to ensure that any negative results were not the result of nonspecific inhibition of the assay [14]. RNase P amplification was performed on 1933 (14%) of the 13 839 swab samples collected across both studies as a sample integrity control; >99% (1915 samples) had RNase P detected. PCR for both N and sgE was performed on ABI 7500 thermocyclers using AgPath-ID One-Step RT-PCR kits, with cycle threshold cutoffs of 40. Diagnostic assays for N were initially performed as 2 separate assays (for N1 and EXO and for N2 and EXO) with 5 µL of RNA per reaction, then with a single triplex reaction (N1, N2, and EXO) with 10 µL of RNA per reaction after validation showed no difference in the limit of detection between the assays.
Samples with detectable SARS-CoV-2 RNA were tested for sgRNA targeting sgE with a paired leader and E primer set (5’-CCAACCAACTTTCGATCTCTTGT-3´, 5´-CGTACCTCTCTCTTCCGAAACG-3´) and a probe (5´-FAM-TCTCTAAACGAACTTATGTACTC-3MGBEC-3´) set on the leader/E junction [13]. Quantification standards were run with both assays to provide a VL as copies/mL during assay validation (Supplementary Material). Sample stability on swab samples over 7 days at room temperature was assessed before trial initiation, demonstrating a 2.1 (N1) and 0.6 (N2) cycle threshold loss for diagnostic RT-PCR and no appreciable loss over 7 days for sgRNA [13].
Statistical Analysis
Participant age and sex at enrollment were summarized overall and by study. RT-PCR test results were summarized on a participant level as well as a swab sample level, including counts of positive results and concordant results. The interval (in days) between the peak observed diagnostic RNA and sgRNA VLs was summarized with a histogram.
The Pearson correlation coefficients were calculated between the diagnostic RNA and sgRNA VLs among samples that were tested positive for both. We presented a scatterplot of the diagnostic RNA and sgRNA VLs and fit a hinge regression model with the sgRNA VLs as the outcome variable and the diagnostic RNA VLs as the explanatory variable [15]. The empirical receiver operating characteristic (ROC) curves for classification of sgRNA-positive samples based on diagnostic RNA VL thresholds were presented graphically for prepeak and postpeak diagnostic RNA VL and overall.
Three cohorts of participants were further defined based on the observed VL trajectories during the first 14 days of follow-up. First, the uncensored peak cohort consisted of participants who had an uncensored peak diagnostic RNA VL during the 14-day follow-up (ie, peak diagnostic RNA VL was not measured on the first or last swab sample collected). Second, the sustained shedding cohort was defined as the subset of the uncensored peak cohort who had ≥2 positive diagnostic RNA test results during the 14-day follow-up. Finally, the trajectory modeling cohort consisted of participants with ≥2 swab samples that tested positive for sgRNA during the 14-day follow-up.
Using data from the sustained shedding cohort, we calculated the sgRNA detection rate and the ratio of diagnostic RNA and sgRNA VLs over time. We also fit a linear mixed-effects model to test whether the difference between diagnostic RNA and sgRNA differed significantly before and after the peak diagnostic RNA VL (Supplementary Material).
Kaplan-Meier curves were generated for diagnostic RNA and sgRNA viral clearance since peak VL for participants in the uncensored peak cohort. Viral clearance was defined as 2 consecutive swab samples without diagnostic RNA/sgRNA detected after peak VL. Participants who did not reach the viral clearance end point were right censored. Cumulative incidence and median event time were calculated using the Kaplan-Meier method.
Using a piece-wise linear mixed-effects model (Supplementary Material), we estimated the diagnostic RNA and sgRNA VL trajectory with data from the trajectory modeling cohort [16]. We compared 3 viral dynamics characteristics between the diagnostic RNA and sgRNA VL trajectories: magnitude of peak VL, time from viral shedding onset to peak, and time from peak to viral clearance. Analyses were performed using R software, version 4.1, and JAGS software, version 4.3 [17, 18].
RESULTS
A total of 1060 participants from 40 states and the District of Columbia shipped 13 839 (90% of expected 15 302) nasal swab samples for the primary outcome, including 829 contacts enrolled in the PEP study and 231 Treatment study participants. Overall, 365 participants had ≥1 diagnostic RNA–positive swab sample and 202 had ≥1 swab sample testing positive for sgRNA (Table 1 and Supplementary Figure 1). Among the 202 participants who tested positive for both diagnostic RNA and sgRNA, 162 (80%) had their peak diagnostic RNA and peak sgRNA VL observed on the same day; 13 (6%) and 27 (13%) had their peak sgRNA VL observed before and after the peak diagnostic RNA VL, respectively. A total of 187 (93%) participants had their peak sgRNA VL observed within 1 day of the peak diagnostic RNA VL (Table 1 and Figure 1). Among the 75 participants with only a single diagnostic RNA–positive swab sample and a test for sgRNA, only 2 (2.7%) were positive for sgRNA (Table 1 and Supplementary Figure 2).
Individual-Level and Swab Sample–Level Summary Statistics for Diagnostic and Subgenomic RNA Data from the Postexposure Prophylaxis Study, the Treatment Study, and Both Studies Combined
| Demographics and Summary Statistics | Both Studies | PEP Study | Treatment Study |
|---|---|---|---|
| Demographic characteristics of intent-to-treat cohorts | |||
| Total no. of participants | 1060 | 829 | 231 |
| Female sex, no. (%) | 621 (59) | 491 (59) | 130 (56) |
| Age, median (IQR) | 38 (26–50) | 38 (26–50) | 37 (28–48) |
| Participant-level summary statistics | |||
| Participants with ≥1 diagnostic RNA–positive swab sample, no. | 365 | 188 | 177 |
| Participants with ≥1 diagnostic RNA–positive swab sample also tested for sgRNA, no. | 348 | 187 | 161 |
| Participants with ≥1 diagnostic RNA–positive swab sample also testing positive for sgRNA, no. | 202 | 97 | 105 |
| Participants with peak diagnostic RNA and sgRNA VLs observed on the same day, no.a | 162 | 78 | 84 |
| Participants with peak sgRNA VL observed before peak diagnostic RNA VL, no.a | 13 | 5 | 8 |
| Participants with peak sgRNA VL observed after peak diagnostic RNA VL, no.a | 27 | 14 | 13 |
| Proportion of participants testing positive for sgRNA (n1) among those with only 1 swab sample positive for diagnostic RNA (n2), presented as n1/n2 (%) | 2/75 (3) | 1/56 (2) | 1/19 (5) |
| Swab sample–level summary statistics | |||
| Samples positive for diagnostic RNA, no. | 2123 | 1012 | 1111 |
| Samples positive for diagnostic RNA also tested for sgRNA, no. | 1932 | 996 | 936 |
| Samples positive for diagnostic RNA and also sgRNA positive, no. (%) | 767 (40) | 450 (45) | 317 (34) |
| Samples with diagnostic RNA VL ≥5.1 log10 copies/mL also tested for sgRNA, no. | 627 | 386 | 241 |
| Samples with diagnostic RNA VL ≥5.1 log10 copies/mL and also sgRNA positive, no. (%) | 599 (96) | 377 (98) | 222 (92) |
| Pearson correlation coefficient between diagnostic RNA and sgRNA VLs among swab samples testing positive for both (no. of samples) | |||
| Among all samples testing positive for both diagnostic RNA and sgRNA | 0.93 (767) | 0.93 (450) | 0.90 (317) |
| Among samples before the observed peak diagnostic RNA VL | 0.93 (157) | 0.93 (95) | 0.90 (62) |
| Among samples at or after the observed peak diagnostic RNA VL | 0.93 (610) | 0.93 (355) | 0.90 (255) |
| Among samples with diagnostic RNA VL ≥5.1 log10 copies/mL | 0.94 (599) | 0.93 (377) | 0.93 (222) |
| Among samples with diagnostic RNA VL <5.1 log10 copies/mL | 0.28 (168) | 0.26 (73) | 0.29 (95) |
Abbreviations: IQR, interquartile range; PEP, postexposure prophylaxis; sgRNA, subgenomic RNA; VL, viral load.
The distribution of days from the observed peak diagnostic RNA VL to the observed peak sgRNA VL is presented in Figure 1.
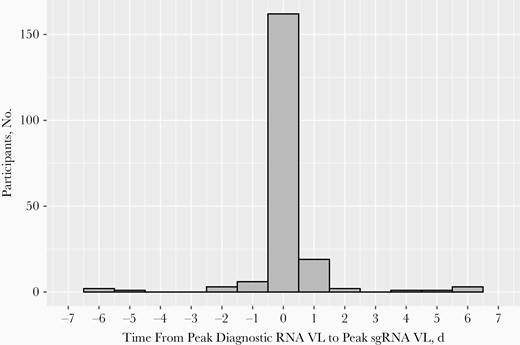
Distribution of days from the observed peak diagnostic RNA viral load (VL) to the observed peak subgenomic RNA (sgRNA) VL. Among the 202 participants with ≥1 diagnostic RNA–positive swab sample that also tested positive for sgRNA, 162 (80%) had their peak diagnostic RNA and peak sgRNA VLs observed on the same day, 13 (6%) had their peak sgRNA VL observed before the peak diagnostic RNA VL, and 27 (13%) had their peak sgRNA VL observed after the peak diagnostic RNA VL; 187 (93%) participants had both peaks observed within 1 day.
A total of 2123 swab samples were PCR positive for SARS-CoV-2, of which 1932 (91%) were tested for sgRNA. Of those tested for sgRNA, 767 (40%) had detectable sgRNA (Table 1). The overall Pearson correlation coefficient between the diagnostic RNA and sgRNA VLs was 0.93, similar in the PEP (0.93) and Treatment (0.90) samples. Despite fewer available swab samples collected before the peak diagnostic RNA VL, there was an overall Pearson correlation coefficient of 0.93 before and after the peak (Table 1). The sgRNA VL was consistently low in samples with low diagnostic RNA VL and appeared to follow a positive linear trend with the diagnostic RNA VL on the scale of log10 copies per milliliter beyond a certain threshold (Figure 2). Fitting a hinge regression model, at a diagnostic RNA VL of 5.1 log10 copies/mL (95% confidence interval [CI], 5.0–5.3 log10 copies/mL) there was a marked increase in positivity for sgRNA. Among the 627 samples with diagnostic RNA VL ≥5.1 log10 copies/mL that were tested for sgRNA, 599 (96%) were positive for sgRNA. The Pearson correlation coefficient for correlation between diagnostic RNA and sgRNA VLs among samples with diagnostic RNA VL ≥5.1 log10 copies/mL is 0.94, drastically higher than that among samples with diagnostic RNA VL <5.1 log10 copies/mL (0.28) (Table 1 and Figure 2).
![Scatterplot of subgenomic RNA (sgRNA) viral load (VL) against diagnostic RNA VL. For diagnostic RNA–positive swab samples that tested negative for sgRNA, the diagnostic RNA VL is plotted. A hinge regression model was fit using VL data from the 767 samples with detectable sgRNA, with the fitted line plotted in black. The estimated change point is at diagnostic RNA VL of 5.1 log10 copies/mL (95% confidence interval [CI], 5.0–5.3), which corresponds to a cycle threshold value of 30.1 (29.6–30.6). Abbreviations: LoD, limit of detection; PEP, postexposure prophylaxis.](https://oup.silverchair-cdn.com/oup/backfile/Content_public/Journal/jid/226/5/10.1093_infdis_jiac048/1/m_jiac048_fig2.jpeg?Expires=1750841371&Signature=LXJtZbaKfme3z1OsyHZ1h2WOTJAwqm26FOjM5RcfCCJvW68K6ud874jYzB9QWdZfhyY4txOb9Rmwybjgn08Muukrodm797NeQ4yJvKn7Mon-8t6xizM3LzuPg1HUsWnEyEYuYdTUWY9yY91Vc9a~FZCmttHkfdExznzlm0N6KOrW01yVr7zmzhw64OxCsVJQE9tQgDhUNUBaUUUMbAchzRh-fwXzab3QP98o4VM6gnavZK8fT58v1WTC2Dlb8vma~TPN2cwv-r9Ckr5RwpI8x04cgpo7Zanatx~csJsVWeVZMeQ1M7SXub8QP8N7o5-1lAUprx7ykWDjttCKA3y-0A__&Key-Pair-Id=APKAIE5G5CRDK6RD3PGA)
Scatterplot of subgenomic RNA (sgRNA) viral load (VL) against diagnostic RNA VL. For diagnostic RNA–positive swab samples that tested negative for sgRNA, the diagnostic RNA VL is plotted. A hinge regression model was fit using VL data from the 767 samples with detectable sgRNA, with the fitted line plotted in black. The estimated change point is at diagnostic RNA VL of 5.1 log10 copies/mL (95% confidence interval [CI], 5.0–5.3), which corresponds to a cycle threshold value of 30.1 (29.6–30.6). Abbreviations: LoD, limit of detection; PEP, postexposure prophylaxis.
To evaluate the accuracy of the diagnostic RNA VLs in identifying samples positive for sgRNA, we constructed the empirical ROC curves using various diagnostic RNA VL thresholds (Figure 3). We identify an “optimal” diagnostic RNA VL cutoff of 4.5 log10 copies/mL, which provided a sensitivity of 90% and specificity of 91%. This cutoff is optimal in the sense that it resulted in a point on the ROC that is closest to the true-positive rate (sensitivity) of 100% and false-positive rate (1 − specificity) of 0%. Samples from the prepeak subset demonstrated greater areas under the ROC, with an optimal cutoff of 4.8 log10 copies/mL, which provided a sensitivity of 90% and specificity of 95%.
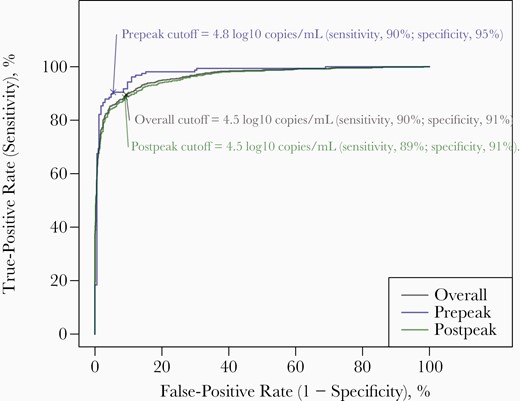
The empirical receiver operating characteristic curves for classification of subgenomic RNA (sgRNA)–positive samples based on diagnostic RNA viral loads (VLs) among the 1932 swab samples with positive results for diagnostic RNA that were tested for sgRNA. An “optimal” cutoff was calculated as the diagnostic RNA VL threshold that maximized the sum of sensitivity (true-positive rate) and specificity (1 − false-positive rate). This cutoff is optimal in the sense it weighs both sensitivity and specificity equally. Overall, to ensure a sensitivity of 90%, the highest diagnostic RNA VL threshold above which a sample was identified to be positive for sgRNA was 4.5 log10 copies/mL.
Within the sustained shedding cohort that consisted of 187 participants, the sgRNA detection rate culminated at 66% on the day of the observed peak diagnostic RNA VL (Figure 4A). Setting the sgRNA VL at 0 log10 copies/mL for swab samples without sgRNA detected, the mean ratio of sgRNA to diagnostic RNA VLs also peaked on the day of the peak diagnostic RNA, mimicking the trend of sgRNA detection rate (Figure 4B). For swab samples with detectable sgRNA, the mean sgRNA to diagnostic RNA VL ratio remained relatively constant over time (Figure 4B). Using a linear mixed-effects model (Supplementary Material), the mean difference between the sgRNA and diagnostic RNA VLs did not differ significantly before and after peak (P = .33).
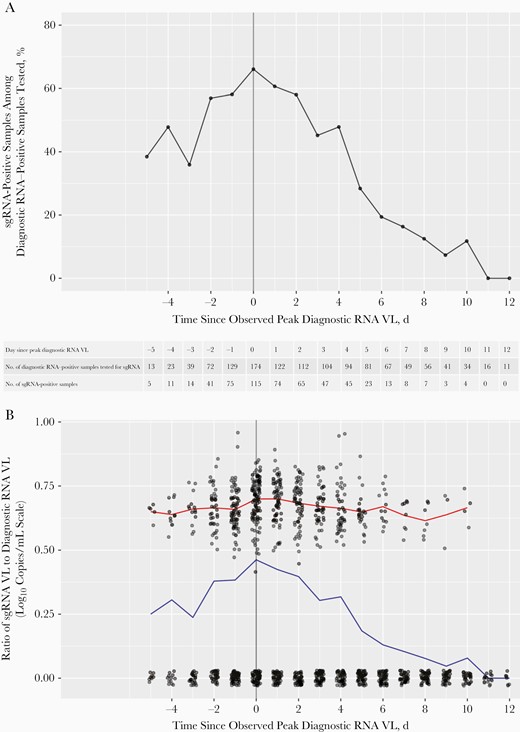
Subgenomic RNA (sgRNA) detection rates and ratio of sgRNA to diagnostic RNA viral load (VL) over time since peak diagnostic RNA VL among the 187 participants in the sustained shedding cohort, the subgroup of participants who had an uncensored peak diagnostic VL (ie, peak diagnostic RNA VL was not measured in the first or last swab sample collected) and ≥2 positive diagnostic RNA results during the 14-day follow-up. A, Percentage of sgRNA-positive samples among diagnostic RNA–positive samples tested by days since the observed peak diagnostic RNA VL. The number of diagnostic RNA–positive samples tested (ie, denominator for the percentage) and the number of sgRNA–positive samples (ie, numerator for the percentage) for each day are shown in the table. B, Ratio of sgRNA to diagnostic RNA VL by time before or after the observed peak diagnostic RNA VL. For swab samples that were positive for diagnostic RNA but negative for sgRNA, the sgRNA VL was set at 0 log10 copies/mL. Each dot represents a single sample. The x-axis coordinates and 0-valued y-axis coordinates were jittered for better visibility. Blue line tracks the mean VL ratio over time among all diagnostic RNA–positive samples tested for sgRNA; red line, the mean VL ratio over time among sgRNA–positive samples only.
Among the 238 participants in the uncensored peak cohort, we conducted a Kaplan-Meier analysis to calculate the median time to diagnostic RNA or sgRNA viral clearance, defined as 2 consecutive swab samples without diagnostic RNA or sgRNA detected (Figure 5). The median time to diagnostic RNA clearance was 8 days (95% CI, 7–9 days) among individuals with ≥1 positive sgRNA result and 1 day (1–1 day) for those with no positive sgRNA results; for those with ≥1 positive sgRNA result, the time to sgRNA clearance was 3 days (3–4 days).
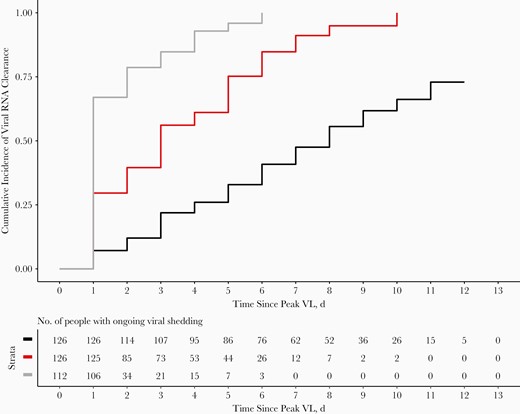
Time to diagnostic RNA and subgenomic RNA (sgRNA) viral clearance from peak viral load (VL) among the 238 participants in the uncensored peak cohort, the subgroup of participants who had an uncensored peak diagnostic RNA VL during the 14-day follow-up (ie, peak diagnostic RNA VL was not measured for the first or last swab sample collected). Time to diagnostic RNA viral clearance is depicted by Kaplan-Meier curves for individuals with ≥1 sgRNA-positive test result (black) or no results with detectable sgRNA (gray); red line represents clearance of detectable sgRNA for individuals with ≥1 sgRNA-positive result. Viral clearance was defined as 2 consecutive swab samples without diagnostic RNA or sgRNA detected.
We fit 2 separate piece-wise linear mixed-effects models for diagnostic RNA and sgRNA VL trajectories for the 153 participants in the trajectory modeling cohort. The estimated peak diagnostic RNA VL was 7.2 log10 copies/mL (95% credible interval [CrI], 7.0–7.3) and occurred on average 1.8 days (1.5–2.1) after the onset of shedding, with viral clearance reached 12.2 days (11.8–12.6) after the peak. In contrast, sgRNA VL was estimated to reach a lower peak of 5.7 log10 copies/mL (95% CrI, 5.5–5.8 log10 copies/mL) 1.2 days (95% CrI, 1.1–1.4 days) after the onset of shedding and to reach viral clearance much faster, about 6.7 days (6.3–7.1 days) after the peak (Figure 6). Additional results from the models are presented in the Supplementary Material (Supplementary Figures 3 and 4).
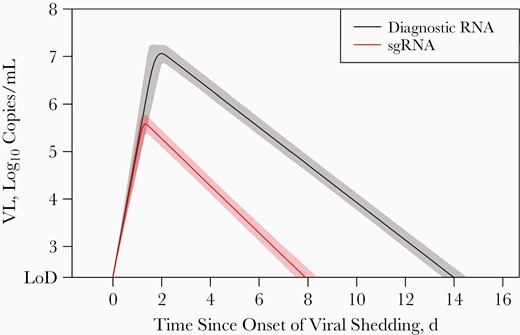
Model-estimated population-level viral load (VL) trajectories and the associated 95% credible intervals for diagnostic RNA and subgenomic RNA (sgRNA). Models were fitted to data from 153 participants in the trajectory modeling cohort, the subgroup whose participants had ≥2 swab samples testing positive for sgRNA during 14-day follow-up. Abbreviation: LoD, limit of detection.
DISCUSSION
From nearly 2000 nasal swab samples with SARS-CoV-2 detected by real-time RT-PCR collected from 1060 outpatients participating in a PEP and Treatment clinical trials, a minority (40%) had detectable sgRNA. We found that a diagnostic RNA VL of 5.1 log10 copies/mL correlates well with detectable sgRNA, suggesting that higher VLs could be used as a correlate of replicating virus without the need for additional diagnostic tests. The prepeak and postpeak samples from this longitudinal sampling demonstrated no significant difference in the ratio of sgRNA to diagnostic RNA VLs, which may support prior studies showing comparable rates of decay between genomic RNA and sgRNA, and strong agreement between sgRNA detection and culturable virus in samples from hospitalized patients [19, 20].
With repeated sampling that spanned preinfection, early asymptomatic infection, and early symptomatic infection we captured the full course of detectable viral RNA in an outpatient population. Positive samples from the PEP study, which captured the initial infection, more commonly had detectable sgRNA than the Treatment samples (which were collected after SARS-CoV-2 diagnosis), consistent with sampling later in the viral time course of the Treatment study group. In addition, for each of the included analyses, the prepeak subsets demonstrated better correlation between diagnostic RT-PCR and sgRNA results, with a greater proportion of PEP samples having detectable sgRNA and the prepeak subsets demonstrating a greater area under the ROC curve, reflecting the increased likelihood of detecting nonreplicating viral RNA in samples collected later in the course of infection. This is consistent with other studies that showed reduced detection of replicating virus after the development of neutralizing antibodies [21].
Studies of SARS-CoV-2 transmission and antiviral therapies may benefit from a better distinction between noninfectious viral genomic material and replicating virus, particularly if this distinction can be provided with PCR assays currently in use. The detection of sgRNA may indicate replicating virus without the potential loss of sensitivity or necessary BSL-3 containment of viral culture [3, 6]. In addition to the potential clinical utility of sgRNA assays themselves, a diagnostic PCR test with a validated cutoff below which sgRNA is reliably detected may similarly allow for improved identification and monitoring of individuals with actively replicating virus, which could have implications for isolation periods.
The trajectories of the diagnostic RNA and sgRNA VLs over time differed, with sgRNA peaking slightly sooner (1.2 vs 1.8 days after shedding onset) and with faster clearance at 6.7 days from peak compared with >12 days for diagnostic PCR. Although real-time prediction of peak VL is not feasible, available studies indicate that symptom onset occurs on or soon after peak VL in community cases [16]. Assuming individuals test soon after the onset of symptoms, the current Centers for Disease Control and Prevention recommendations for a 5-day isolation period approach the duration of detectable sgRNA in our study [22]. However, the onset of isolation may vary depending on access to testing. In addition, this study was conducted when the D614G variant was circulating and before the availability of vaccines, and results may vary with currently circulating variants or in vaccinated individuals.
One caveat of this study is that detection of sgRNA is not identical to detection of infectious virions, particularly at later timepoints after infection and when neutralizing antibodies are present [21]. Thus, this study may overestimate the potential infectiousness of later samples. In contrast, viral culture, while highly specific for infectious virus, is less sensitive and may underestimate replication-competent virus. In an outpatient study evaluating viral culture compared to detection by PCR, a threshold of 6.4 log10 copies/mL optimized sensitivity and specificity at 0.81 and 0.9, respectively [21]. In comparison, using detectable sgRNA as an indicator of replicating virus we show reliable detection with diagnostic RNA viral titers of ≥5.1 log10 copies/mL.
Another limitation of this study is that we did not target the same genes for sgRNA and diagnostic RNA assays. The lower VLs resulting from sgRNA PCR compared with paired diagnostic RNA may reflect the lower molar ratios of E transcript (sgE) compared with N transcript (sgN) for replicating virus [2, 3]. Genomic N is a common target for diagnostic SARS-CoV-2 assays. However, the transition from detectable to undetectable sgE transcripts appears to track better with the transition from infectious virus to residual genetic material than the detection of sgN, possibly owing to the relative abundance of sgE versus sgN transcripts [9, 19].
Compared with other studies of viral shedding, we had the advantage of capturing the full course of infection from first detectable virus by RT-PCR. These results may not be directly comparable to samples collected late after the onset of symptoms, and instrument variability, and differences in sample collection may limit reproducibility of precise VL cutoffs. Furthermore, the study population was entirely unvaccinated, and the diagnostic RNA and sgRNA VL correlations may be altered in vaccinated individuals. These data can complement studies of transmission, preexposure prophylaxis and PEP, and early therapy by providing a PCR threshold that can be correlated with replicating virus, independent of symptoms or duration of illness. In the context of frequent testing, these data could inform the threshold VL at which treatment and prevention interventions have the potential to decrease viral replication, with clinical benefits for persons with SARS-CoV-2.
Supplementary Data
Supplementary materials are available at The Journal of Infectious Diseases online. Supplementary materials consist of data provided by the author that are published to benefit the reader. The posted materials are not copyedited. The contents of all supplementary data are the sole responsibility of the authors. Questions or messages regarding errors should be addressed to the author.
Notes
Acknowledgments. The authors thank the study participants for their generosity, and the hydroxychloroquine coronavirus disease 2019 study teams (postexposure prophylaxis [PEP] and Treatment studies) for their tireless work and innovation.
Financial support. This work was supported by the Bill & Melinda Gates Foundation (BMGF; awards INV-016204 [PEP study] and INV-017062 [Treatment study] and grant funding to R. B.)
References
Author notes
M. E. D. and T. Q. D. contributed equally to this work.
E. B. and K. N. contributed equally to this work.
Potential conflicts of interest. M. E. D. is funded by the Infectious Diseases Clinical Research Consortium through the National Institute for Allergy and Infectious Diseases, National Institutes of Health (NIH; award UM1AI148684), outside the submitted work. M. L. W. H. and M. H. W. report funding from the BMGF, outside the submitted work. A. B. reports personal fees from Gates Ventures and grant funding from the NIH, the BMGF, and the New York City Department of Health and Mental Hygiene, outside the submitted work. H. Y. C. reports consulting with Ellume, Pfizer, the BMGF, GlaxoSmithKline, and Merck; she has also received research funding from Gates Ventures and Sanofi Pasteur and support and reagents from Ellume and Cepheid, outside the submitted work. H. C. S. K. is funded by the Research Supplement to Promote Diversity in Health-Related Research Program, the National Cancer Institute, NIH (grant R01 CA213130-S) and a Department of Medicine Diversity Academic Development Scholar Award from the University of Washington. C. M. J. reports consulting with AbbVie and Gilead, outside the submitted work. R. B. reports funding from BMGF and the NIH, outside the submitted work, and support for abstract and manuscript writing from Regeneron Pharmaceuticals, also outside the submitted work. All other authors report no potential conflicts. All authors have submitted the ICMJE Form for Disclosure of Potential Conflicts of Interest. Conflicts that the editors consider relevant to the content of the manuscript have been disclosed.

