


Abstract
The HIV Prevention Trials Network (HPTN) 074 study evaluated an integrated human immunodeficiency virus (HIV) treatment and prevention strategy among persons who inject drugs (PWID) in Indonesia, Ukraine, and Vietnam. We previously detected multiple HIV infection in 3 of 7 (43%) of seroconverters with 3–8 HIV strains per person. In this report, we analyzed multiple HIV infection and HIV superinfection (SI) in the HPTN 074 cohort.
We analyzed samples from 70 participants in Indonesia and Ukraine who had viral load >400 copies/mL at enrollment and the final study visit (median follow-up, 2.5 years). HIV was characterized with Sanger sequencing, next-generation sequencing, and phylogenetic analysis. Additional methods were used to characterize a rare case of triple-variant SI.
At enrollment, multiple infection was detected in only 3 of 58 (5.2%) participants with env sequence data. SI was detected in only 1 of 70 participants over 172.3 person-years of follow-up (SI incidence, 0.58/100 person-years [95% confidence interval, .015–3.2]). The SI case involved acquisition of 3 HIV strains with rapid selection of a strain with a single pol region cluster.
These data from a large cohort of PWID suggest that intrahost viral selection and other factors may lead to underestimation of the frequency of multiple HIV infection and SI events.
People who inject drugs (PWID) have disproportionately high human immunodeficiency virus (HIV) incidence and prevalence [1], especially in low- to middle-income countries [2]. Intravenous drug use is the main mode of HIV transmission in Eastern Europe and South Asia [3]. This disparity in HIV risk is attributed to high-risk behaviors, such as sharing of needles and injection drug preparation equipment [4, 5]. Phylogenetic studies of HIV infections in PWID are limited. Prior studies have identified infections with 2 or more HIV strains (dual/multiple infection) or HIV superinfection (SI, acquisition of 1 or more HIV strains after initial infection) in PWID [6–10]. The reported frequency of SI varies in different settings and study populations [11] and in different cohorts of PWID [6, 7, 12, 13]. The relative rates of primary HIV infection and SI also vary from study to study [14–16]. However, it is difficult to compare SI rates across studies because of differences in the methods used to detect SI events, the low frequency of SI events, differences in sampling frequency, and other factors.
SI is often associated with a transient increase in HIV viral load (VL) and can lead to loss of viral suppression in viremic controllers [17, 18]. SI can also lead to viral breakthrough in persons on antiretroviral treatment (ART) if the newly acquired strain is resistant to 1 or more of the drugs in the treatment regimen, although this appears to be relatively rare [19–22]. The longer-term impact of SI on VL set point appears to vary case to case and may be impacted by the type of SI (eg, intra- vs intersubtype) and the timing of SI (eg, near the time of infection vs during established infection). SI has been shown to induce de novo antibody responses [23] with variable effects on the expression of neutralizing antibodies [23, 24] and has been associated with poor clinical outcomes in some cases [18, 25]. SI and dual HIV infection could also potentially impact the performance of vaccines or monoclonal antibodies for HIV treatment. Poor clinical outcomes may be more likely to follow SI if the newly acquired strains are CXCR-4 tropic or are more pathogenic for other reasons [26]. More rapid disease progression and increased end-organ damage have also been associated with dual HIV infection [25, 27]. Multiple infection could also impact estimates of duration of HIV infection and HIV incidence that are based on HIV diversity measures [28–30].
The HIV Prevention Trials Network (HPTN) 074 study was a randomized clinical trial in Ukraine, Indonesia, and Vietnam that evaluated the impact of an integrated intervention strategy on HIV transmission from HIV-positive PWID to their HIV-negative injection partners [31]; 7 participants acquired HIV infection during the trial. In a previous report, we found that 3 of the 7 (43%) seroconverters were multiply infected at the first HIV-positive visit with 3–8 HIV strains per participant [10]. In this report, we analyzed multiplicity of infection and HIV SI in participants who were HIV positive at study enrollment. To maximize the observation period, we selected participants who completed follow-up in a 1-year extension study [32].
METHODS
Study Cohort
HPTN 074 was conducted in Kyiv, Ukraine; Thai Nguyen, Vietnam; and Jakarta, Indonesia (NCT 02935296; enrollment 2015–2016). Enrollment criteria for HIV-positive participants included age 18–60 years, active injection drug use, and HIV VL ≥1000 copies/mL at screening. Participants in the intervention arm received enhanced support for HIV and substance use treatment and ART referral regardless of CD4 cell count. The control group received standard of care (SOC) services for HIV and substance use treatment. After 52 weeks of follow-up, participants in the intervention arm were significantly more likely to report being on ART and to be virally suppressed [31]. The intervention group was also more likely to report being in substance use treatment and had lower mortality than the control group [31]. After demonstration of the effectiveness of the intervention, HIV-positive participants were invited to enroll in a 1-year extension study [32]. In the extension study, participants in the SOC arm who were not already on ART and medication-assisted treatment for substance use were offered the intervention package [32]. Participants from Vietnam were not included in this report because they did not complete the additional year of follow-up. Participants from Indonesia and Ukraine were included if they had paired baseline and end-of-study samples available for analysis with VL >400 copies/mL at both visits.
Laboratory Testing
Retrospective testing was performed at the HPTN Laboratory Center (Johns Hopkins University, Baltimore, Maryland; Figure 1). HIV genotyping was performed using the ViroSeq HIV-1 Genotyping System, v2.0 (Abbott Molecular, Des Plaines, Illinois); this system uses Sanger sequencing to generate a single pol consensus sequence for each sample. Antiretroviral (ARV) drug testing was performed using a method that detects 22 ARV drugs in 5 drug classes [33]. HIV VL testing was performed using the RealTime HIV-1 Viral Load Assay (Abbott Molecular). Recency testing was performed using the SEDIA HIV-1 LAg-Avidity enzyme immunoassay (Sedia Biosciences, Beaverton, Oregon).
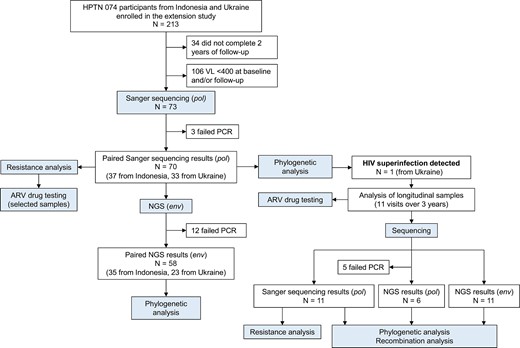
Overview of study design. The figure shows a summary of the testing conducted for study participants from Indonesia and Ukraine. Abbreviations: ARV, antiretroviral; HPTN, HIV Prevention Trials Network; NGS, next-generation sequencing; PCR, polymerase chain reaction; VL, viral load.
Next-generation sequencing (NGS) was performed using the MiSeq System (reagent kit version 3; Illumina, San Diego, California) as described previously [34, 35]. For env analysis, reverse-transcription polymerase chain reaction (RT-PCR) was used to amplify a region of gp41 (env, HXB2 coordinates: 7938–8292, 354 base pairs [bp]). This region encodes the C-terminus of helical region 1, helical region 2, and the membrane-proximal external region of gp41. If amplification failed, an overlapping region of env was amplified (HXB2 coordinates: 7950–8299, 349 bp). For pol analysis, RT-PCR was used to amplify a region of HIV reverse transcriptase (pol, HXB2 coordinates: 2696–3252, 556 bp). This region encodes the majority of HIV reverse transcriptase. Amplicons were barcoded using the Nextera XT index primer set and sequenced (2 × 300 cycles). Paired-end reads were trimmed and collapsed into full-length amplicons using Cutadapt 1.8 [36] and AdapterRemoval [37]. Reads with ambiguous bases were removed and consensus sequences were generated with an identity threshold of 0.98 using Usearch [38].
Phylogenetic Analysis
Phylogenetic analysis was performed using pol sequences generated by Sanger sequencing and env and pol sequences generated by NGS. Multiple pairwise sequence alignment was performed using MAFFT version 7.471. Phylogenetic trees were constructed using Fast (Approximate) maximum likelihood tree construction (FastTreeMP v2.1.10). Tools for phylogenetic analysis were accessed through the Cyber Infrastructure for Phylogenetic Research (CIPRES) Science Gateway [39]. The Basic Local Alignment Search Tool (BLAST, https://blast.ncbi.nlm.nih.gov/Blast.cgi) was used to identify up to 50 sequences most closely related to each study sequence (background sequences); duplicate sequences were removed. All phylogenetic trees included 170 HIV subtype reference sequences. Background sequences and HIV subtype reference sequences were retrieved from the Los Alamos National Laboratory HIV Sequence Database (www.hiv.lanl.gov). Phylogenetic trees were visualized using FigTree v1.4.4, Interactive Tree of Life v6.5.2, and MEGA v7.0.26. Pairwise Tamura-Nei 93 genetic distance was calculated using R v4.1.2 [40], and the ape package v5.6–1 [41]. Recombination analysis was performed using the Recombination Detection Program v4.101 [42]. Phylogenetic trees were considered to indicate potential HIV SI if sequences from baseline and follow-up formed distinct, unlinked clusters. HIV subtyping was performed by phylogenetic analysis.
Ethics Statement
Written informed consent was obtained from participants in the HPTN 074 trial. The study was approved by institutional review boards and ethics committees of each participating institution.
RESULTS
Study Cohort
HPTN 074 reenrolled 213 HIV-positive participants from Indonesia and Ukraine in the 1-year extension study; 179 participants completed the final extension study visit. Seventy-three of those participants had a VL >400 copies/mL at baseline and the last study visit (follow-up, Figure 1). Baseline HIV genotyping results were obtained previously for all 73 participants [43]. HIV genotyping results at follow-up were obtained in this study for 70 of those participants (GenBank accession numbers: OP034730–OP034808). This study includes analysis of the 70 participants with paired genotyping results (37 from Indonesia, 33 from Ukraine). The median time between baseline and follow-up visits for these participants was 2.5 years (interquartile range, 2.3–2.7 years; total follow-up time: 172.3 person-years [PY]). Baseline characteristics for the 70 participants are shown in Table 1.
Baseline Characteristics of the Study Cohort
| Characteristic | Participants Included (N = 70) |
|---|---|
| HIV viral load, copies/mL, median (IQR) | 11 753 (4330–34 261) |
| Study arm | |
| Intervention | 16 (22.9) |
| Standard of care | 54 (77.1) |
| HIV drug resistance detected at baseline | |
| Yes | 7 (10.0) |
| No | 63 (90.0) |
| Antiretroviral drugs detected at baselinea | |
| Yes | 5 (7.1) |
| No | 62 (88.6) |
| Sex | |
| Male | 52 (74.3) |
| Female | 18 (25.7) |
| Age, y | |
| 18–29 | 11 (15.7) |
| 30–39 | 51 (72.9) |
| 40–60 | 8 (11.4) |
| Study site | |
| Indonesia | 37 (52.9) |
| Ukraine | 33 (47.1) |
| Marital status | |
| Married/have partner but not married | 37 (52.9) |
| Single/divorced/separated/widowed | 33 (47.1) |
| Education | |
| None or primary school | 6 (8.6) |
| Secondary school | 59 (84.3) |
| Higher education | 5 (7.1) |
| Injected amphetamines (3 mo prior) | |
| Yes | 3 (4.3) |
| No | 67 (95.7) |
| Noninjection stimulant use (3 mo prior)b | |
| Yes | 38 (54.3) |
| No | 32 (45.7) |
| Noninjection opiate use (3 mo prior)c | |
| Yes | 1 (1.4) |
| No | 68 (97.1) |
| Hazardous alcohol use | |
| Yes | 19 (27.1) |
| No | 51 (72.9) |
| Medication-assisted treatment for substance used | |
| Yes | 18 (25.7) |
| No | 19 (27.1) |
| No. of sexual partners (1 mo prior)e | |
| 0 | 1 (1.4) |
| 1 | 40 (57.1) |
| ≥ 2 | 8 (11.4) |
| No. of injection partners (3 mo prior) | |
| 1 | 5 (7.1) |
| 2–4 | 31 (44.3) |
| ≥5 | 34 (48.6) |
Data are presented as No. (%) unless otherwise indicated.
Abbreviations: HIV, human immunodeficiency virus; IQR, interquartile range.
Three of 70 participants did not have a result from antiretroviral drug testing.
One participant was missing data for noninjection stimulant use.
One participant was missing data for noninjection opiate use.
Thirty-three of 70 participants were missing data on medication-assisted treatment for substance use.
Twenty-one of 70 participants were missing data on the number of sexual partners.
Phylogenetic Analysis of HIV pol Sequences Generated by Sanger Sequencing
We first performed phylogenetic analysis of HIV pol sequences generated by Sanger sequencing. Most participants from Indonesia had CRF01_AE HIV (2 had a unique recombinant form); all participants from Ukraine had HIV subtype A6. Baseline and follow-up sequences were phylogenetically linked (monophyletic) for 69 of the 70 participants with bootstrap support ranging from 61% to 100%. One participant from Ukraine had baseline and follow-up sequences that did not group on the same branch, indicating potential SI (Figure 2A, case UA-01).
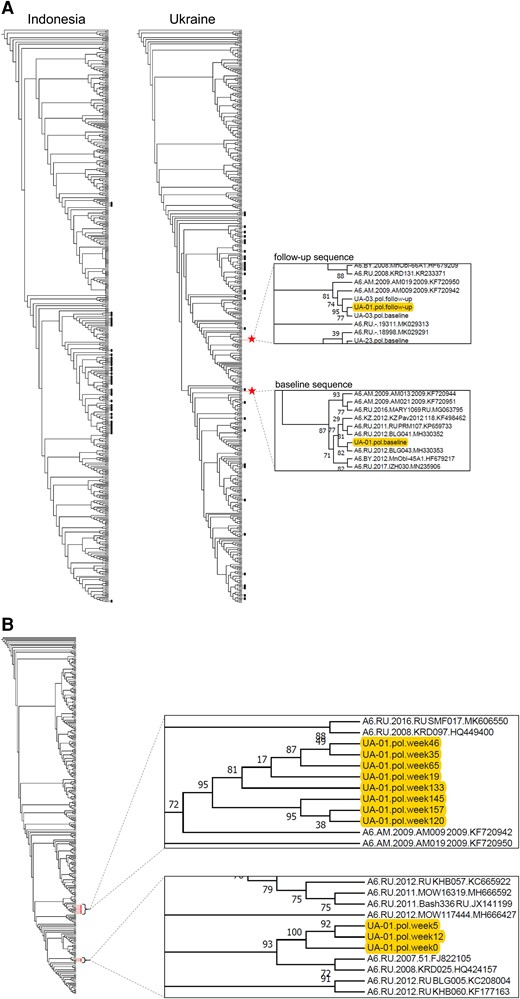
Phylogenetic analysis of pol sequences from Sanger sequencing: case UA-01. A, Phylogenetic trees were constructed using pol sequences that were generated by Sanger sequencing. The trees include baseline and follow-up sequences from 37 participants from Indonesia (with 277 background sequences) and 33 participants from Ukraine (with 299 background sequences). In 69 of 70 cases, the baseline and follow-up sequences from each participant clustered together on a monophyletic branch with high bootstrap support (black dots). Red stars indicate the position of the baseline and follow-up sequences from a participant in Ukraine (case UA-01); in this case, the 2 sequences were located in distinct polyphyletic clusters. The inserts on the right show enlarged views of the sections of the tree that include the baseline and follow-up consensus sequences from participant UA-01. B, A second phylogenetic tree was generated that included additional pol sequences from case UA-01 that were generated by Sanger sequencing. This included sequences from 11 study visits (red dots): the baseline visit (week 5, study enrollment), the follow-up visit (week 157, end of study), and 9 other visits (week 0, study screening; weeks 12, 19, 35, 46, 65, 120, 133, and 145, interim visits); 132 background sequences were included. The inserts on the right show enlarged views of the sections of the tree that include the sequences from participant UA-01. Sequences from earlier visits (weeks 0–12) and later visits (weeks 19–157) form 2 distinct clusters.
Pol sequences were generated by Sanger sequencing for additional study visits for case UA-01. Eleven visits were analyzed: study screening (week 0), study enrollment (baseline, week 5), interim visits (weeks 12, 19, 35, 46, 65, 120, 133, and 145), and end of study (follow-up, week 157). A phylogenetic tree was constructed using the 11 pol sequences (Figure 2B). The sequences formed 2 distinct clusters. One cluster included sequences from the first 3 study visits (weeks 0–12); the other cluster included sequences from the following 8 visits (weeks 19–157). Bootstrap support for the 2 clusters was 100% and 95%, respectively. The median pairwise genetic distance between sequences in the 2 clusters was 1.18%. These findings indicated that an SI event occurred between weeks 12 and 19.
Phylogenetic Analysis of HIV pol Sequences Generated by NGS: Case UA-01
We next analyzed pol NGS sequences from case UA-01; NGS was successful for 6 of the 11 samples (weeks 12, 19, 35, 65, 120, and 157; mean: 1384 sequence reads/sample [range, 181–2269]). The reasons for assay failure in 5 samples was not clear; assay failure was not associated with HIV VL. Sequence reads from the 6 samples were compiled into 13 consensus sequences based on sequence homology (6 from week 35; 3 from week 19; 1 each from weeks 12, 65, 120, and 157). A phylogenetic tree was constructed using the 13 consensus sequences (Figure 3). The consensus sequences grouped into 4 clusters. A single cluster was observed at the earliest study visit (cluster 1, week 12). Three different clusters were observed at the next 2 visits (clusters 2–4, weeks 19 and 35). The genetic distance between cluster 1 and clusters 2–4 ranged from 4.88% to 5.51%. This analysis indicated that the SI event may have involved the introduction of 3 distinct HIV variants. Cluster 4 was the only cluster observed at the next visit (week 65) and over an additional 1.8 years of follow-up (through week 157).
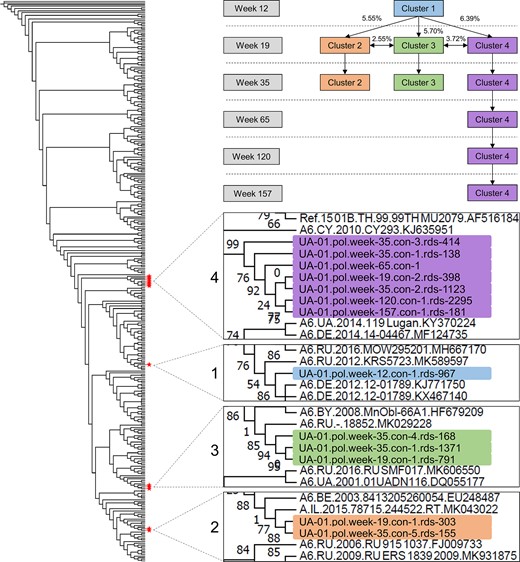
Phylogenetic analysis of pol sequences from next-generation sequencing (NGS): case UA-01. The figure on the left shows a phylogenetic tree constructed using 13 pol consensus sequences generated with NGS from 6 study visits for case UA-01 (6 sequences for week 35; 3 for week 19; 1 for weeks 12, 65, 120, and 157); 277 background sequences were included. Red stars indicate the position of the 13 sequences. The sequences formed 4 distinct clusters (clusters 1–4). The diagram at upper right shows which clusters were present at each study visit and the median pairwise genetic distance between the clusters. The 4 inserts in the lower right show enlarged views of the sections of the tree that include sequences from case UA-01. Branch labels are highlighted with a different color for each cluster. The following information is included in the branch label for each sequence: case designation (UA-01); HIV region analyzed (pol); study visit (eg, week 19); the consensus sequence number (eg, con 1); and the number of individual sequence reads (rds) used to generate the consensus sequence (eg, rds 303).
Analysis of HIV Drug Resistance and Antiretroviral Drug Use: Case UA-01
We next evaluated whether HIV drug resistance or ARV drug use was related to the virologic changes observed in case UA-01. Drug resistance mutations were not detected at any visit in this case; the participant did not report prior or current ART, and ARV drugs were not detected at any of the 11 visits. Results from drug resistance and ARV drug testing for the other 69 participants are presented in Supplementary File 1.
Phylogenetic Analysis of HIV env Sequences Generated by NGS: Case UA-01
To characterize case UA-01 in more detail, we analyzed env sequences from NGS; this analysis was successful for all 11 longitudinal samples (mean of 176 309 sequence reads/sample [range, 21 452–327 481]). Sequence reads from the 11 samples were compiled into 2257 consensus sequences based on sequence homology (mean number of consensus sequences/sample, 205 [range, 89–272]). A phylogenetic tree was constructed using 2257 NGS consensus sequences from case UA-01 (Figure 4). The consensus sequences grouped into 5 distinct clusters with bootstrap support >80%. A single cluster was observed at the first 3 study visits (cluster 1, weeks 0–12). Three additional clusters were observed at the next study visit (clusters 2–4, week 19); this was consistent with the timing for the introduction of new pol variants. The original cluster (cluster 1) and 2 of the 3 new clusters (clusters 3 and 4) were observed at 7 of the 8 subsequent visits. A fifth cluster was observed at 2 follow-up visits (cluster 5, weeks 133 and 145). Recombination events were detected in env sequences from 5 of the visits analyzed (weeks 19, 35, 65, 120, 145); 13 distinct recombination events were observed over the 2.7 years following the SI event. There was no evidence that cluster 5 arose through recombination of sequences in other clusters. Self-reported data did not reveal any increased risk factors for SI near the time of the SI event (Supplementary File 2).
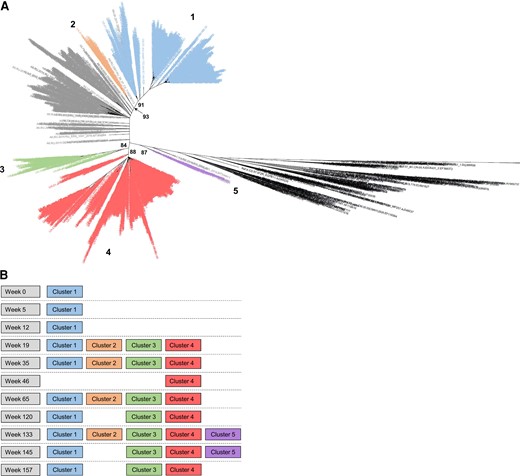
Phylogenetic analysis of env sequences from next-generation sequencing (NGS): case UA-01. A, A phylogenetic tree was constructed using env consensus sequences generated with NGS of longitudinal samples from case UA-01; 504 background sequences were included. Human immunodeficiency virus (HIV) subtype references are shown in black and background sequences are shown in gray. Sequences from case UA-01 grouped into 5 distinct clusters with bootstrap support >80% (numbered 1–5) and are colored according to the cluster that contains them. Bootstrap support for each cluster is shown. B, Clusters that were present at each study visit. In A and B, the same color coding is used for each sequence cluster.
Association of HIV Viral Load and Virologic Events: Case UA-01
We next evaluated the association of HIV VL and virologic events in case UA-01 (Figure 5). The VL was <40 000 copies/mL during the first 12 weeks of follow-up and then increased to >100 000 copies/mL by week 19, after the SI event. The sharp increase in VL corresponded to a shift from a single pol cluster to 3 new distinct pol clusters and the introduction of new env clusters. These events were reflected by increases in genetic diversity (maximum genetic distance) in pol and env between weeks 12 and 19. The VL declined to approximately 40 000 copies/mL over the next 6 months (weeks 19 to week 46) with parallel decreases in env and pol diversity; pol diversity continued to decline over the next 9 weeks and returned to baseline (zero diversity) by week 65.
![Relationship between human immunodeficiency virus (HIV) viral load and virologic events: case UA-01. The x-axis shows the timing of sample collection (week 0, study screening; week 5, study enrollment [baseline]; week 157, end of study [follow-up]). Black symbols show the HIV viral load. Blue symbols show the maximum pairwise genetic distance for pol sequences generated by next-generation sequencing (NGS). Green symbols show the maximum pairwise genetic distance for env sequences generated by NGS. Blue-shaded boxes above the plot show clusters identified by analysis of pol sequences generated by NGS (see Figure 3). Green shaded boxes above the plot show clusters identified by analysis of env sequences generated by NGS (see Figure 4); the asterisk indicates that different combinations of env were present at different visits between week 19 and week 157 (see Figure 4B). Red stars show visits with recombination detected in env NGS sequences. Abbreviation: SI, human immunodeficiency virus superinfection.](https://oup.silverchair-cdn.com/oup/backfile/Content_public/Journal/jid/226/12/10.1093_infdis_jiac441/5/m_jiac441f5.jpeg?Expires=1750270591&Signature=cgyt-HPGkGgzlOt0ArFfA7ntqy7q1pT69pMl-yBuOAfsJbNM5kom~L1Wdu0WEl~ReDx3ZD1K-k7ni-nl9P42uPjH7GG1S1dMHXnKHiTpTyq7NrFVMZL2VLMP1RCOzKhWHC6Ygos2LBiMyg4OG5N5taLo9BP0nHGNxcdixSgcxjC4M-YaTxAkjmKqUqyX0sGRR2lybrzHN9X35H7c6xr2a9w3PZWQ-LWHd~LxCQrJ6swOFWoJ2whqovGl2gIqw-6VlMiMFg1errtTA6nQw24ohpxYXKmKKLhUX3huPN64pgVpzWuUbOA8m8Ne-RxmNK2wR0~zzHra54erUVzDH4mSMg__&Key-Pair-Id=APKAIE5G5CRDK6RD3PGA)
Relationship between human immunodeficiency virus (HIV) viral load and virologic events: case UA-01. The x-axis shows the timing of sample collection (week 0, study screening; week 5, study enrollment [baseline]; week 157, end of study [follow-up]). Black symbols show the HIV viral load. Blue symbols show the maximum pairwise genetic distance for pol sequences generated by next-generation sequencing (NGS). Green symbols show the maximum pairwise genetic distance for env sequences generated by NGS. Blue-shaded boxes above the plot show clusters identified by analysis of pol sequences generated by NGS (see Figure 3). Green shaded boxes above the plot show clusters identified by analysis of env sequences generated by NGS (see Figure 4); the asterisk indicates that different combinations of env were present at different visits between week 19 and week 157 (see Figure 4B). Red stars show visits with recombination detected in env NGS sequences. Abbreviation: SI, human immunodeficiency virus superinfection.
Only 1 of the 3 newly introduced pol variants (cluster 4) was detected at week 65, reflecting viral selection (Figure 5); this was also the only variant detected over the remaining 1.8 years of follow-up. During this period (week 65 to week 145), VL, env diversity, and pol diversity were fairly constant despite ongoing recombination in the env region. At the last visit (week 157), there was a modest increase in VL (from 46 350 to 71 373 copies/mL), which was accompanied by a decrease in env diversity; this may have reflected selection of viral variants with enhanced replication capacity.
Phylogenetic Analysis of env NGS Data From the Study Cohort
Samples from the other 69 participants in the cohort were also analyzed with env NGS to evaluate whether any of the participants were multiply infected at baseline or had evidence of SI that was not detected by analyzing pol consensus sequences. Results from paired baseline and follow-up samples were obtained for 58 of the 70 participants (35 from Indonesia, 23 from Ukraine; 12 samples failed amplification with both primer sets: 5 failed at baseline only, 4 failed at follow-up only, 3 failed at both visits). Assay failure was more frequent for samples with lower HIV VL (data not shown).
A phylogenetic tree was constructed for each study site. The tree for Indonesia included 3713 consensus sequences from 35 participants; the tree from Ukraine included 6585 consensus sequences from 23 participants. In 54 of 58 cases, baseline and follow-up sequences from each participant grouped together in monophyletic clusters with bootstrap support ranging from 63% to 100% with no evidence of multiple infection or SI. The phylogenetic relationships between sequences from the other 4 cases (ID-01, ID-03, ID-24, and ID-29) was more complex (Supplementary File 3). Each case had 2 distinct sequence clusters that included baseline and/or follow-up sequences. In 1 case (ID-03), 1 sequence cluster included follow-up sequences only; further analysis would be needed to determine whether this represented an SI event. These 4 participants did not report behaviors associated with increased risk for multiple infection at baseline, and recency testing indicated that they were not recently infected (Supplementary File 2).
In 3 of the 4 cases with polyphyletic env sequences, sequences from other study participants were included in the sequence clusters (Supplementary File 3). We analyzed phylogenetic trees from env NGS sequences from all 58 participants to identify additional multiperson sequence clusters (Supplementary File 4). Six multiperson clusters were identified (4 from Indonesia, 2 from Ukraine) with 2–5 participants per cluster. Two of the 6 clusters included participants with drug resistance; there was no evidence of transmitted resistance or “shared” resistance mutations in these clusters.
DISCUSSION
In this study, we detected SI in only 1 of 70 participants over 172.3 PY of follow-up (incidence, 0.58/100 PY [95% confidence interval {CI}, .015–3.2]). This is similar to the rate of primary HIV incidence in HPTN 074 (intervention arm: 0.0/100 PY [95% CI, .0–1.7]; control arm: 1.0/100 PY [95% CI, .4–2.1]) [31]. We also observed a low rate of dual/multiple infection at study entry. The low rates of primary infection and SI in this cohort may have reflected a Hawthorne effect (eg, participants may have reduced their risk behaviors after study enrollment). However, 2 findings suggest that the true rate of multiple infection and SI infection in this cohort may be higher than what we observed. First, the low rate of multiple infection that we observed at study entry (3/58 cases [5.2%]) contrasts with the high rate of multiple infections previously observed in the seroconverters in this cohort (3/7 cases [43%]; 3–8 variants per case) [10]. This discrepancy suggests that the rate of dual/multiple infection in this population is likely to be high early in infection with a single HIV strain predominating later in infection. The second finding was the rapid selection of HIV with a single pol variant in case UA-01 following a triple-variant SI event. In this case, the original HIV strain was rapidly replaced by the 3 superinfecting strains. Based on analysis of HIV pol sequences, only 1 of the 3 superinfecting strains was detected a few weeks later, and that strain was the only strain detected over the next 1.8 years. This triple-variant SI event would have been interpreted as a single-variant SI event if this testing was not performed close to the time of SI, underscoring the value of frequent sampling for detection of SI. These findings suggest that rapid viral selection after multiple infection or SI may impact detection and characterization of these events. In contrast, analysis of env NGS sequences in this case revealed persistence of env variants from multiple superinfecting strains; these sequences were likely retained in HIV variants that arose following intergenic recombination events. This highlights the importance of analysis of multiple genomic regions when characterizing SI events.
Other factors may have impacted our ability to detect multiple infection and SI in this cohort. First, the cohort included 6 clusters of infections with up to 5 participants/cluster. Lower interperson diversity, often observed among PWID due to close networks and needle sharing, would make it more difficult to detect multiple infection and SI. Frequent recombination events, such as those observed in case UA-01, may also complicate analysis of these events. Second, these events are more easily detected in settings where different HIV subtypes circulate; in this study, all participants in Ukraine had HIV subtype A6 and all but 2 participants in Indonesia had CRF01_AE HIV. Technical factors may also have impacted detection of multiple infection and SI. For example, baseline/follow-up env NGS results were only obtained for 58 of 70 cases. In 9 of the 12 cases that failed analysis, only 1 of the paired samples failed to amplify. PCR bias may also have limited our ability to detect multiple infection and SI events if the proportion of 1 HIV strain was low. Finally, this study only included participants who were viremic; this subset of PWID may have higher-risk behaviors and may be at greater risk for HIV superinfection than those who are in care and are virally suppressed on ART.
The SI case reported here is unusual. Reported cases of SI usually involve single-variant SI events. Rare cases of “triple HIV infection” have been described that involve multiple infection with 3 HIV strains [44–47], dual infection with a subsequent SI event [47], 2 sequential SI events [47–49], or a 2-variant SI event [50]. We are not aware of other reports of an SI event with 3 superinfecting strains. Given the short time interval when SI occurred in this case (7 weeks), it seems likely that the 3 variants were transmitted at the same time; however, we cannot rule out the possibility of rapid sequential transmission of these 3 HIV strains. Concurrent transmission of multiple HIV variants may be more likely among PWID than in sexual transmission since dual or multiple infection may be more common, the viral exposure may be greater, and there is no mucosal barrier to transmission. In case UA-01, we found a close association between VL and virologic events. ARV drug testing and drug resistance testing confirmed that the decrease in VL following SI was not due to ART initiation or a change in ART regimen.
In summary, we found low rates of multiple infection and SI among nonseroconverters in a cohort of PWID. Our findings suggest that rapid viral selection and other factors may have hampered detection of these events. Detailed characterization of a rare triple-variant SI event demonstrated an association between virologic events and changes in HIV VL. Optimization of study design and methods used to detect multiple infection and SI will help assess the true frequency of these events and their clinical impact in different settings and cohorts.
Supplementary Data
Supplementary materials are available at The Journal of Infectious Diseases online. Consisting of data provided by the authors to benefit the reader, the posted materials are not copyedited and are the sole responsibility of the authors, so questions or comments should be addressed to the corresponding author.
Notes
Acknowledgments. The authors thank the HPTN 074 study team and participants for providing the samples and data used in this study.
Financial support. Overall support for the HPTN is provided by the National Institute of Allergy and Infectious Diseases (NIAID); Office of the Director, National Institutes of Health; the National Institute on Drug Abuse; the National Institute of Mental Health; and the Eunice Kennedy Shriver National Institute of Child Health and Human Development under award numbers UM1AI068619–15 (HPTN Leadership and Operations Center), UM1AI068617–15 (HPTN Statistical and Data Management Center), and UM1AI068613–15 (HPTN Laboratory Center). The study was also supported in part by the Division of Intramural Research, NIAID.
References
Author notes
Potential conflicts of interest. S. H. E. has collaborated on research studies with investigators from Abbott Diagnostics; Abbott Diagnostics has provided reagents for collaborative research studies. All other authors report no potential conflicts.
All authors have submitted the ICMJE Form for Disclosure of Potential Conflicts of Interest. Conflicts that the editors consider relevant to the content of the manuscript have been disclosed.

