


Abstract
Long-term studies of vaccine recipients are necessary to understand severe acute respiratory syndrome coronavirus 2 (SARS-CoV-2) antibody durability and assess the impact of booster doses on antibody levels and protection from infection. The identification of vaccine breakthrough infections among fully vaccinated populations will be important in understanding vaccine efficacy and SARS-CoV-2 vaccine escape capacity.
SARS-CoV-2 spike (S) receptor-binding domain and nucleocapsid (N) immunoglobulin (Ig) G levels were measured in a longitudinal study of 1000 Chicago healthcare workers who were infection naive or previously infected and then vaccinated. Changes in S and N IgG were followed up through 14 months, and vaccine breakthrough infections were identified by increasing levels of N IgG.
SARS-CoV-2 S IgG antibody levels among previously infected and previously noninfected individuals decreased steadily for 11 months after vaccination. Administration of a booster 8–11 months after vaccination increased S IgG levels >2-fold beyond those observed after 2 doses, resulting in S IgG levels that were indistinguishable between previously infected and uninfected individuals. Increases in N IgG identified vaccine breakthrough infections and showed >15% breakthrough infection rates during the Omicron wave starting in December 2021.
These results demonstrate SARS-CoV-2 antibody changes after vaccination and breakthrough infections and identify high levels of vaccine breakthrough infections during the Omicron wave, based on N IgG increases.
The severe acute respiratory syndrome coronavirus 2 (SARS-CoV-2) pandemic has shown few signs of slowing down, and the emergence of variants with increased symptom severity (Delta [1]) and transmissibility (Omicron [2, 3]) has continued to fuel renewed waves of global infections. While vaccines against SARS-CoV-2 have proved instrumental in reducing symptom severity and mortality, even among Delta and Omicron variants [4], important questions remain regarding the durability of vaccine protection, the length of time that vaccine-induced antibodies are detectable [5], and what impact prior infection may have on vaccine response. Furthermore, the recommendation for individuals to receive a booster dose raises questions about antibody responses, protection from severe infection, and antibody durability after booster administration [6]. Finally, identifying vaccine breakthrough infections using nucleocapsid (N) immunoglobulin (Ig) G in vaccinated populations will be important for estimating the prevalence of SARS-CoV-2 infections and will play a key role in identifying vaccine breakthrough infections [7].
Earlier reports have highlighted the effect of “hybrid immunity” on SARS-CoV-2 vaccine responses, showing that previous infection leads to both higher antibody levels as well as neutralizing antibody titers in vaccinated individuals who were infected before vaccination [8–10]. This hybrid immunity difference was shown to persist ≥3 months after 2 vaccine doses and was normalized when infection-naive individuals were given a third vaccine dose [9]. These studies focused on a small number of individuals (<100), and larger studies following up individuals for longer periods of time will be important to confirm the impact of hybrid immunity on vaccine driven antibody responses, especially in light of new vaccine-evading variants.
Previous SARS-CoV-2 antibody studies have primarily focused on quantitating spike (S) IgG antibody levels after vaccination or booster dose [11, 12] or on N IgG as part of seroprevalence studies [13]. Studies that use both S and N serology are needed to understand vaccine antibody kinetics as well as identify vaccine breakthrough cases among fully vaccinated individuals.
In the current study, we enrolled 1000 Rush University Medical Center healthcare workers who were fully vaccinated with Pfizer/BioNTech BNT162b2 and either previously infected with SARS-CoV-2 or infection naive. We report longitudinal S antibody levels collected at 3-month intervals spanning 14 months and approximately 3–6 weeks after a booster dose. Finally, we used longitudinal changes in N antibody levels and self-reported positive tests to identify likely vaccine breakthrough infections and show that routine N antibody testing can be used to track SARS-CoV-2 incident infections among a fully vaccinated/boosted population.
METHODS
This study was designed to test blood antibody levels to the SARS-CoV-2 S and N proteins in participants receiving a messenger RNA (mRNA)–based vaccine. Samples were collected at 6 time points (1, 5, 8, 11, and 14 months after full vaccination and approximately 3–6-weeks after a booster dose). This study was approved by the Rush University Medical Center Institutional Review Board. Study participants were Rush University Medical Center healthcare workers who enrolled between January and March 2021 and provided informed consent to provide up to 20 mL of venous blood, from which plasma was isolated, deidentified, and shipped to Abbott Diagnostics (Abbott Park, Illinois) on dry ice for testing. Participants self-reported demographic data, including age (in years), race/ethnicity (black, white, Asian, or Hispanic), sex (male or female), and history of coronavirus disease 2019 (COVID-19) infection, including symptoms and SARS-CoV-2 test results. In total, 1000 individuals were enrolled in the study. After removal of participants who were self-reported to be immunocompromised (n = 32), had received only 1 vaccine (n = 10), or did not return for blood sampling (n = 21), 937 participants remained.
Baseline screening, testing, and participant history questionnaires identified 805 participants with no evidence of prior SARS-CoV-2 infection and 132 with evidence of such prior infection. Owing to scheduling conflicts or inability to return, timing of booster vaccination, or identified vaccine breakthrough infection, 934, 868, 583, 359, and 465 participant samples were available for testing at 1, 5, 8, 11, and 14 months, respectively. Postbooster samples were available for 666 participants and were collected approximately 3–6 weeks after the booster dose. Individuals who received a booster were analyzed separately from those who did not for the remaining time points of the study. At the 14-month time point, the participants who returned for antibody testing were similar to those who did not return with respect to mean age ± standard deviation (mean [standard deviation], 45.3 [13.4] vs 40.4 [12.1] years, respectively; range, 21–84 vs 22–81), sex (79.7% vs 74.1 female race (79.7% vs 80.0% white), and previous infection status (13.6% vs 14.4% previously infected).
SARS-CoV-2 Antibody Detection
All samples were assayed with an Abbott ARCHITECT i2000SR instrument and tested using the EUA SARS-CoV-2 IgG and SARS-CoV-2 IgG II Quant assays, approved under emergency use authorization by the Food and Drug Administration. The assays were performed according to the ARCHITECT operations manual and package insert instructions. Briefly, the SARS-CoV-2 IgG assay is an automated chemiluminescent microparticle immunoassay used for the qualitative detection of IgG antibodies directed against the SARS-CoV-2 N protein. Assay results are measured in relative light units and reported as an index value of the ratio of specimen to calibrator relative light unit signal (S/C). Index values ≥1.4 S/C indicate a SARS-CoV-2 IgG–seropositive result with an overall specificity rate of 99.63% at the cutoff specified in the package insert. To identify vaccine breakthrough infections using N IgG, an increase in SARS-CoV-2 IgG index values of ≥0.8 over the baseline sample was used. An alternative cutoff index value of 0.8 was shown to have a specificity of 99.6% in an external study [14] and was further supported in additional studies [15, 16], particularly with regard to seroprevalence.
The SARS-CoV-2 IgG II Quant assay is an automated chemiluminescent microparticle immunoassay used for the quantitative detection of IgG antibodies directed against the receptor-binding domain of the SARS-CoV-2 S protein, with assay results reported in arbitrary units (AU) per milliliter. Assay calibration is performed using 6-point calibration and referencing an internal reference standard at each concentration level. Results <50.0 AU/mL are reported as negative and results ≥50.0 AU/mL as positive; samples with results ≥40 000 AU/mL were diluted, retested, and corrected for the dilution factor.
Statistical Analysis
Study participants (n = 937) were grouped into 2 cohorts based on previous evidence of SARS-CoV-2 infection (previous positive polymerase chain reaction and/or positive SARS-CoV-2 N IgG at baseline). In total, 805 participants did not have evidence of previous SARS-CoV-2 infection and 132 participants did have evidence. Participants (n = 167) who acquired a self-reported confirmed/suspected vaccine breakthrough infection during the study (self-reported positive SARS-CoV-2 test and/or increase in N IgG index value of ≥0.8 over baseline) were excluded from later time points and analyzed separately as part of the vaccine breakthrough cohort.
The date 1 December 2021 was used to define the start of the Omicron wave in the Chicago area, based on increasing reported prevalence of sequenced Omicron infections. Data reported by the Chicago Department of Public Health indicates that Omicron variants were >20% by 4 December 2021 and reached >95% of cases sequenced at Northwestern University by 14 December 2021 [17].
All graphing and statistical analysis was conducted using GraphPad Prism software, version 8.0.2. Specifically, Mann-Whitney U and χ2tests were used to assess differences in SARS-CoV-2 IgG and vaccine breakthrough levels between time points in the cohorts described above. Differences were considered significant at P < .05m and exact values are reported to 3 decimal places. Descriptive statistics such as medians and interquartile ranges (IQRs) were also computed with GraphPad Prism software. Age versus antibody response graphs, including best-fit lines, 95% confidence intervals, and R2and slope P values were calculated using Prism's linear regression analysis.
RESULTS
In total, 1000 individuals were enrolled in the study. After we removed participants who were self-reported to be immunocompromised (n = 32), had received only 1 dose of vaccine (n = 10), or did not return (n = 21), 937 participants remained. Self-reported participant demographics are shown in Table 1, and participants were largely white (63.8%) and female (72.9%) and had a median (IQR) age of 41 (33–54) years (7.1% were aged ≥65 years). Evidence of previous SARS-CoV-2 infection was identified in 132 individuals (14.1%). Quantitative S–receptor-binding domain antibody levels in study participants were measured 1, 5, 8, 11, and 14 months after administration of a second SARS-CoV-2 mRNA vaccine dose. In participants who received a third (booster) dose, an additional sample was obtained approximately 3–6 weeks later. Participants who received a booster dose during the study (n = 666) received it 8–11 months after their second dose. Participants with a prior SARS-CoV-2 infection showed a nonsignificant correlation between age and S IgG levels 1 month after full vaccination (r = 0.17; P = .051) (Figure 1A). Participants without evidence of a previous SARS-CoV-2 infection showed a negative correlation between age and S IgG levels 1 month after full vaccination (r = −0.23; P < .001) (Figure 1B).
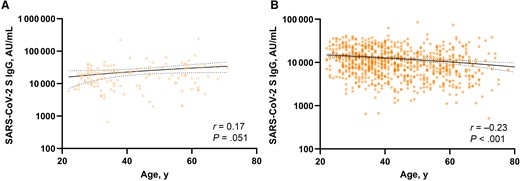
Linear regression and correlation between age and severe acute respiratory syndrome coronavirus 2 (SARS-CoV-2) spike (S) immunoglobulin (Ig) G levels 1 month after full vaccination in previously infected (A) or previously uninfected (B) individuals. Solid and dotted lines indicate linear regression and 95% confidence intervals, respectively. Spearman r correlation in GraphPad Prism software (version 8.0.2.) was used, and differences were considered significant at P < .05. Abbreviation: AU, arbitrary units.
Participant Demographic Characteristics and Severe Acute Respiratory Syndrome Coronavirus 2 Spike Receptor-Binding Domain Immunoglobulin G Results
| Characteristic or Result | All Participants (n = 937) | Previously Infected (n = 132) | Infection Naive (n = 805) |
|---|---|---|---|
| Age by sex group, median (IQR), ya | |||
| Combined groups | 41 (33–54) (n = 921) | 37 (31–55) (n = 132) | 41 (33–53) (n = 789) |
| Male (n = 172; 18.4%) | 44 (36–58) (n = 172) | 52 (35–62) (n = 18) | 44 (36–56) (n = 154) |
| Female (n = 683; 72.9%) | 40 (32–53) (n = 676) | 36 (30–53) (n = 106) | 40 (33–53) (n = 570) |
| Unknown sex (n = 82; 8.8%) | 38 (33–45) (n = 73) | 32 (31–36) (n = 8) | 39 (33–45) n = 65) |
| Race, no. (%) | |||
| White | 598 (63.8) | 87 (65.9) | 511 (63.5) |
| Black | 108 (11.5) | 19 (14.4) | 89 (11.1) |
| Asian | 81 (8.6) | 9 (6.8) | 72 (8.9) |
| Native American | 5 (0.5) | 0 (0) | 5 (0.6) |
| Mixed race | 13 (1.4) | 3 (2.3) | 10 (1.2) |
| Unknown/other | 132 (14.1) | 14 (10.6) | 118 (14.7) |
| SARS-CoV-2 IgG S level, median (IQR), AU/mLb | |||
| 1 mo | 10 394 (6149–17 413) (n = 934) | 18 156 (9656–28 821) (n = 132) | 9801 (5686–15 520) (n = 802) |
| 5 mo | 1568 (920–2579) (n = 869) | 3026 (1582–6635) (n = 117) | 1448 (864–2342) (n = 752) |
| 8 mo | 782 (478–1346) (n = 583) | 1809 (931–4818) (n = 81) | 725 (450–1142) (n = 502) |
| 3–6 wk after booster dose | 23 255 (13 756–35 551) (n = 666) | 21 694 (14 006–33 386) (n = 91) | 23 546 (13 755–35 919) (n = 575) |
| 11 mo with booster | 14 443 (7871–29 850) (n = 304) | 13 022 (5559–25 530) (n = 32) | 14 472 (7916–30 360) (n = 272) |
| 11 mo without booster | 890 (423–11 317) (n = 55) | 6254 (1906–14 256) (n = 18) | 500 (387–3358) (n = 37) |
| 14 mo with booster | 10 711 (5105–28 487) (n = 466) | 11 251 (5402–26 929) (n = 63) | 10 619 (5078–28 816) (n = 403) |
Abbreviations: AU, arbitrary units; IgG, immunoglobulin G; IQR, interquartile range; SARS-CoV-2, severe acute respiratory syndrome coronavirus 2.
Self-reported ages were not available for 16 individuals (7 women and 9 of unknown sex).
Not all participants were able to provide a sample at every time point.
The median (IQR) S antibody levels of the combined study participants were 10 394 (6149–17 413), 1568 (920–2579), 782 (478–1346), and 890 (423–11 317) AU/mL at 1, 5, 8, and 11 months (without a booster dose), respectively (Figure 2A). The steadily decreasing antibody levels were significantly different at each measured time point. In the 666 participants who received a booster, median (IQR) S antibody levels increased to 23 255 (13 756–35 551) AU/mL, >2-fold higher than the peak observed 1 month after the second dose (P < .001). The median (IQR) S antibody levels at 11 months in individuals who received a booster were 14 443 (7871–29 850) AU/ml, dropping to 10 711 (5105–28 487) AU/mL at 14 months (P = .005).
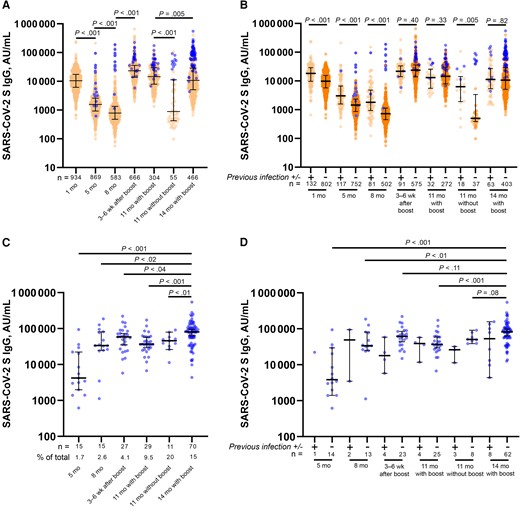
Severe acute respiratory syndrome coronavirus 2 (SARS-CoV-2) spike (S) receptor-binding domain immunoglobulin (Ig) G levels after vaccination and identification of vaccine breakthrough infections. A, B, SARS-CoV-2 S IgG levels in all participants (A) and in individuals with (+) or without (−) evidence of previous SARS-CoV-2 infection (B) at the indicated time points after full vaccination. C, D, SARS-CoV-2 S IgG antibody levels at each individual time point for all individuals with breakthrough infections (C) and those with (+) or without (−) evidence of previous SARS-CoV-2 infection (D). The number of participants analyzed at each time point and vaccine breakthrough infections as a percentage of total samples are reported under the graph. Blue circles represent the first time point when a participant was identified as having evidence of a vaccine breakthrough infection based on a self-reported test and/or increase in nucleocapsid IgG index value of ≥0.8 over baseline. Mann-Whitney U tests were used for all statistical comparisons, and differences were considered significant at P < .05. Abbreviation: AU, arbitrary units.
Breaking out the results by infection status at the beginning of the study showed higher median (IQR) 1-month S IgG levels in participants who had previously been infected (n = 132) than in those without prior infection (n = 802) (18 156 [9656–28 821] vs 9801 [5686–15 520] AU/mL, respectively; P < .001) (Figure 2B). This was also observed at 5, 8, and 11 months (without a booster; P < .001 for all time points). This difference disappeared 3–6 weeks after the administration of a booster dose, resulting in median (IQR) S antibody levels of 21 694 (14 006–33 386) and 23 546 (13 755–35 919) AU/mL in previously infected and uninfected participants, respectively (P = .40) and continued at 11 and 14 months with booster (P = .33 and P = .82, respectively).
Individuals with vaccine breakthrough infections (n = 167) were identified based on self-reporting of a positive SARS-CoV-2 test and/or an increase in N IgG index value of ≥0.8 over baseline. Analyzing SARS-CoV-2 S IgG in the subset of participants with vaccine breakthrough infections revealed significantly higher median (IQR) antibody levels (80 809 [39 108–108 715] AU/mL) in individuals who were infected at the 14-month time point than in those who had breakthrough infections at previous time points (Figure 2C). The percentage of vaccine breakthrough infections identified at each time point steadily increased from 1.7% at 5 months after full vaccination to 15% at 14 months in individuals who received a booster.
At the 11-month time point, there was a significant difference between the rate of breakthrough infections in individuals who had already received a booster and those who had not (9.5% [29 of 304) vs 20% [11 of 55], respectively; χ2P = .02), and median (IQR) antibody levels were significantly higher (P < .001) in the boosted than in the nonboosted population (14 443 [7871–29 850] vs 890 [423–11 317] AU/mL) (Figure 2A and 2C). Separating breakthrough infections based on previous infection status showed similar trends of higher S IgG levels at 14 months (with booster) than in individuals infected earlier in the study (Figure 2D). Infection-naive individuals with breakthrough infections identified at 14 months had significantly higher S IgG levels than those with breakthrough infections at 5, 8, or 11 months (with booster). Owing to lower overall numbers, comparisons were not made between individuals with a previous infection.
Based on increasing numbers of vaccine breakthrough infections occurring over time, even among boosted individuals, we wondered whether the Omicron variant wave might be associated with the observations. Plotting the vaccine breakthrough sample collection date against the S IgG result showed higher S IgG levels and numbers of vaccine breakthrough infections after the introduction of the Omicron variant in the United States (Figure 3A). Among individuals with vaccine breakthrough infections, median (IQR) S IgG levels were significantly higher in those whose infections occurred after 1 December 2021 (n = 134) than in those whose infections occurred between 1 June and 30 November 2021 (n = 33) (58 477 [34 174–91 747] vs 26 335 [3478–72 067] AU/mL, respectively; P < .001) (Figure 3B).
![Severe acute respiratory syndrome coronavirus 2 (SARS-CoV-2) spike (S) receptor-binding domain (RBD) and nucleocapsid (N) immunoglobulin (Ig) G levels in vaccine breakthrough infections by sample date. A, C, SARS-CoV-2 S IgG (in arbitrary units [AU] per milliliter) (A) and SARS-CoV-2 N IgG (index value) (C) results from suspected/confirmed vaccine breakthrough infections plotted against the collection date of the sample. B, D, SARS-CoV-2 S IgG (AU/mL) (B) and SARS-CoV-2 N IgG (index value) (D) results from individuals infected between 1 June and 30 November 2021 were compared with those from individuals infected between 1 December 2021 and 31 March 2022. Solid black trendlines were calculated with GraphPad Prism software, version 8.0.2. Vertical dotted lines indicate 1 December 2021, which was considered the start of the Omicron wave in the United States. Mann-Whitney U tests were used for all statistical comparisons, and differences were considered significant at P < .05.](https://oup.silverchair-cdn.com/oup/backfile/Content_public/Journal/jid/226/11/10.1093_infdis_jiac420/1/m_jiac420f3.jpeg?Expires=1750870022&Signature=Dbv2GpP00t66hKuuG7EaxxCUog8ikMT-ku4OgrzzVOcZlmgMWkzIO9skWs5N~q31qsWcPJOnJYtnOhwlux9u7bJpuNEy-QW8pIa7jfejDoBB~13Q-3coCTwhmQzpF5ZwuHaoL7X2f6dbH3V65hCvdX4y8aHzD8oNXo8AmFTXVUwA8Kt-oiEKcVH9kD0h6wqmwHsu-QK~9BGJTWDMiVZzHM8y830WQ2q3QFOewj1R7lyqtjXgH35J6LJrxGeDFdHIUoqOUKl7-rKlJRWbmj8mIuRNmnDaBlVlXf~YLS2OlV5e0q3BwLyVY4XNq0SGmk1XmAiTYNoP5goMgj7PaKMrhQ__&Key-Pair-Id=APKAIE5G5CRDK6RD3PGA)
Severe acute respiratory syndrome coronavirus 2 (SARS-CoV-2) spike (S) receptor-binding domain (RBD) and nucleocapsid (N) immunoglobulin (Ig) G levels in vaccine breakthrough infections by sample date. A, C, SARS-CoV-2 S IgG (in arbitrary units [AU] per milliliter) (A) and SARS-CoV-2 N IgG (index value) (C) results from suspected/confirmed vaccine breakthrough infections plotted against the collection date of the sample. B, D, SARS-CoV-2 S IgG (AU/mL) (B) and SARS-CoV-2 N IgG (index value) (D) results from individuals infected between 1 June and 30 November 2021 were compared with those from individuals infected between 1 December 2021 and 31 March 2022. Solid black trendlines were calculated with GraphPad Prism software, version 8.0.2. Vertical dotted lines indicate 1 December 2021, which was considered the start of the Omicron wave in the United States. Mann-Whitney U tests were used for all statistical comparisons, and differences were considered significant at P < .05.
Because the introduction of vaccine boosters began shortly before the Omicron wave in the United States, we wondered whether the higher measured S IgG levels may be in part explained by participants having recently received a booster before an Omicron breakthrough infection. Among nonboosted individuals with vaccine breakthrough infections, median (IQR) S IgG levels were significantly higher among those with breakthrough infections occurring after 1 December 2021 (n = 17) than among those whose breakthrough infections occurred between 1 June and 30 November 2021 (n = 30) (49 715 [32 575–82 660] vs 24 444 [3387–38 997] AU/mL; P = .005) (Supplementary Figure 1). We did not observe any significant differences (P = .44) in S IgG levels between boosted (n = 117) and nonboosted (n = 17) individuals with breakthrough infections occurring after 1 December 2021. N IgG index values and total infections also showed higher trends in individuals infected after 1 December 2021, compared with those infected between 1 June and 30 November 2021 (Figure 3C). Median (IQR) N IgG index values of 3.11 (2.03–4.56) were significantly higher in individuals infected after 1 December 2021 than in those with breakthrough infections occurring between 1 June and 30 November 2021 (3.11 [2.03–4.56] vs 2.06 [1.15–3.38], respectively; P = .002) (Figure 3D).
The number of days between the N IgG–positive blood sampling and self-reported positive tests with respect to pre- and post-Omicron infections showed no significant difference (P = .32), supporting the observation that the lower IgG levels in the pre-Omicron breakthrough infections were not due to antibody waning between a positive test result and N IgG blood sampling (Supplementary Figure 2). Similarly, the group of participants who had breakthrough infections during the Omicron wave were demographically similar to participants who had breakthrough infections during pre-Omicron waves, with respect to age (mean [standard deviation], 42.5 [12.6] vs 41.0 [13.0] years, respectively; range, 22–70 vs 23–66 years), sex (81.3% vs 71.9% female), and race (84.3% vs 75.8% white).
Among individuals with a vaccine breakthrough infection, 108 (64.7%) both reported a positive test result and had an increase in SARS-CoV-2 N IgG index values of ≥0.8 over baseline. There were 41 (24.6%) individuals with such an increase who did not test or had a negative test result. An additional 11 (6.6%) reported a positive test result but did not have increases in N IgG index values ≥0.8 over baseline, and 7 individuals (4.2%) did not respond. There was no significant difference in median (IQR) SARS-CoV-2 N IgG index values between individuals with and those without a self-reported positive result (2.86 [1.72–4.51] vs 2.88 [1.91–4.32]; P = .61) (Figure 4A). Among individuals who self-reported a positive SARS-CoV-2 result, there was a significant difference in the median number of days between those who had increases in SARS-CoV-2 N IgG index values of ≥0.8 at their next time point (37.5 days; n = 108) and those who did not (62 days; n = 11; P = .03), suggesting antibody waning in the latter group as a potential explanation (Figure 4B).
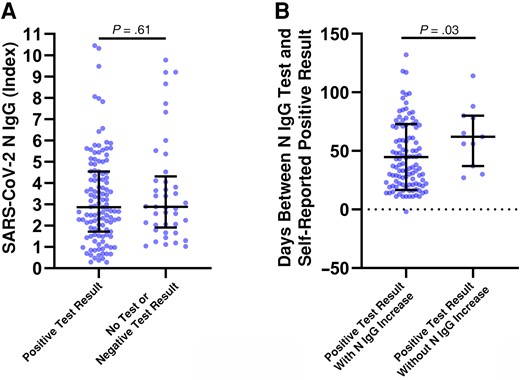
Severe acute respiratory syndrome coronavirus 2 (SARS-CoV-2) nucleocapsid (N) immunoglobulin (Ig) G levels in individuals with or without a self-reported positive test result. A, SARS-CoV-2 N IgG (index value) results from individuals with identified vaccine breakthrough infections and a self-reported positive test result or with no test or a negative result. B, The number of days between a self-reported positive test result and N IgG blood sampling was compared between individuals with both a positive result and an N IgG increase and those with a positive result but without an N IgG increase. An increase in N IgG was considered positive if the measured index value was ≥0.8 over baseline testing. Mann-Whitney U tests were used for all statistical comparisons, and differences were was considered significant at P < .05.
The timing of breakthrough infections was also analyzed by separating them into before and after the Omicron wave, and these findings are reported in Table 2. The majority, of breakthrough infections in the study—80.2% (n = 134)—occurred after November 2021, compared with 19.8% (n = 33) between May and the end of November 2021. Positive SARS-CoV-2 test results were self-reported for 51.5% in the pre-Omicron waves and 76.1% during the Omicron wave, with an overall self-reported positive test rate of 71.3%. Within the study, 41 (24.6%) of the breakthrough infections were identified on the basis of SARS-CoV-2 N IgG index value increases of ≥0.8 over baseline alone.
Timing of Self-Reported Test Result and/or Nucleocapsid Immunoglobulin G Identification of Severe Acute Respiratory Syndrome Coronavirus 2 Breakthrough Infections
| Breakthrough Infection Timing | No. (%) of Infectionsa | |||
|---|---|---|---|---|
| Self-Reported SARS-CoV-2 Test Result | No Responseb | Total | ||
| Positive | No Test or Negative | |||
| May–November 2021 (pre-Omicron) | 17 (51.5) | 12 (36.4) | 4 (12.1) | 33 (19.8) |
| December 2021 to May 2022 (post-Omicron) | 102 (76.1) | 29 (21.6) | 3 (2.2) | 134 (80.2) |
| May 2021 to May 2022 (total) | 119 (71.3) | 41 (24.6) | 7 (4.2) | 167 (100) |
Abbreviation: SARS-CoV-2, severe acute respiratory syndrome coronavirus 2.
Values represent no. (row %), except in the “Total” column, where they represent no. (column %).
The participants did not report any SARSCoV-2 test results to the research staff.
DISCUSSION
We characterized longitudinal SARS-CoV-2 vaccine antibody levels in a large cohort of both previously infected and uninfected individuals with up to 14 months of follow-up and found significant amounts of antibody waning in both groups over time. As in our previous study in a smaller cohort [10], we observed a negative correlation between age and S IgG levels among individuals who were not previously infected, which was not observed in those who were previously infected. It remains unclear why prior infection may lead to higher antibody levels after vaccination in older adults, and future studies may be useful to explore the potential immunological mechanisms behind this observation.
S antibody levels were consistently higher in previously infected individuals after vaccination, and we found that a third mRNA dose given as a booster 8–11 months after primary vaccination increased median S IgG levels to >2-fold higher than initial vaccination in both groups. The results from our large study support previous findings showing that hybrid immunity leads to higher antibody levels after vaccination, and we further show that this effect continues for at least 11 months after the second vaccine dose. Furthermore, we similarly observed that a third dose removed the difference in observed S IgG levels between previously infected and uninfected individuals, and this effect persisted >3 months later. Combined, these results provide strong additional support for the presence of hybrid immunity in previously infected and vaccinated individuals and highlight the importance of booster administration in people who have already been infected with SARS-CoV-2 as well as those who have not yet been infected.
One key aspect of this study is the use of longitudinal S and N antibody testing, which allowed us to identify and track individuals who had acquired a vaccine breakthrough infection by comparatively measuring increased levels of N IgG. Through self-reporting we identified that about 25% of individuals with breakthrough infections had never had a positive SARS-CoV-2 test result. This could have important implications for studies measuring SARS-CoV-2 community transmission based on positive test rates alone and may suggest that the true number of SARS-CoV-2 infections might be up to 33% higher than positive test results alone would indicate. Importantly, increases in N IgG were observed in people who had previously been infected with SARS-CoV-2 and had been reinfected. Thus, routine longitudinal antibody testing using N IgG can be used to identify ongoing SARS-CoV-2 infections in fully vaccinated as well as previously infected populations, and even in boosted individuals. This approach could possibly underestimate the number of breakthrough infections, particularly if longer periods (>90 days) between sampling occur, given that in this study we observed 6.6% of individuals who did not have a N IgG increase yet reported a positive COVID-19 test result.
In a 2021 Belgium study, before the Delta and Omicron waves, seroconversion did not occur in 22.2% of patients with mild infections nor did seroconversion to N IgG in 2.6% of those with severe infection; by 6 months after infection, 61.1% of patients with mild infection had seroreverted [18]. It is not clear why some individuals do not seroconvert after infection. In addition, in our study a number of infections were not reported by self-testing, perhaps because individuals did not experience symptoms that would have prompted testing. This has important implications for prevalence studies, as new waves of highly infectious, immune-evasive variants such as Omicron [19] infect fully vaccinated and/or previously infected populations and may be circulating at higher-than-reported levels. Indeed, we observed a large increase in the number of vaccine breakthrough infections occurring in our cohort after 1 December 2021, which directly coincided with the Omicron variant wave that occurred in the United States during late 2021 and into 2022. These results highlight previous reports on the enhanced immune escape potential of the Omicron variant [20]. Given published reports on Omicron's immune evasion potential [21–24], we expect to identify more such cases in later study time points and as new BA.4 and BA.5 variants begin circulating.
Interestingly, we observed that both S and N antibody responses in vaccine breakthrough cases were higher during the Omicron wave compared with waves of previous variants. The increased level of S antibody could possibly be explained by the booster that most individuals received before Omicron; however, 17 nonboosted individuals with Omicron-wave breakthrough infections also showed higher S IgG levels than individuals with pre-Omicron breakthrough infections. Furthermore, the higher N IgG levels observed would also not be explained by booster doses. There was no significant difference between the pre- and post-Omicron infection groups in the number of days between sampling for breakthrough infection serology and self-reported positive test results, suggesting that the lower N IgG level observed in pre-Omicron infections is not due to timing differences. Because the assays we used were developed to detect antibodies against the D614G variant, the measured levels of S and N IgG may have been underestimated for Omicron infections owing to the significant number of mutations occurring in this variant. Even so, we still observed significantly higher S and N IgG levels in individuals with vaccine breakthrough infections during the Omicron wave. Additional studies using sequence-confirmed infections will be useful to confirm these observations and identify potential biological explanations.
Considered together, the results of the current study highlight the utility of regular SARS-CoV-2 IgG testing for both S and N antibody levels and for tracking the seroprevalence of SARS-CoV-2 infections in a fully vaccinated population. We also found that rates of vaccine breakthrough infections were much higher during the Omicron wave and that a considerable number of infections occurred without a positive test. These results should inform future studies assessing ongoing seroprevalence as Omicron and new variants continue to circulate. Limitations of the current study include a lack of uniformity in the timing of boosters and blood sample collection, reliance on self-reporting of positive test results, and a lack of sequence-confirmed infections.
Supplementary Data
Supplementary materials are available at The Journal of Infectious Diseases online. Consisting of data provided by the authors to benefit the reader, the posted materials are not copyedited and are the sole responsibility of the authors, so questions or comments should be addressed to the corresponding author.
Notes
Author contributions. A. L. and J. M. conceived and designed the study. M. S. performed the receptor-binding domain immunoglobulin G assays. M. A., A. G., T. M., M. B., R. T. S., D. B., and J. M. collected and analyzed the data. M. A., A. L. G. C., and J. M. wrote the manuscript, with input from all authors.
Financial support. This work was supported by Abbott Diagnostics Division Research and Development.
References
Author notes
Potential conflicts of interest. M. A., M. S., and G. C. are employees and shareholders of Abbott Laboratories. A. L. has received consulting fees from Abbott Laboratories. All other authors report no potential conflicts. All authors have submitted the ICMJE Form for Disclosure of Potential Conflicts of Interest. Conflicts that the editors consider relevant to the content of the manuscript have been disclosed.

