


Abstract
Persistent immune activation is thought to contribute to heightened atherosclerotic cardiovascular disease (ASCVD) risk among people with human immunodeficiency virus (PWH).
Participants (≥18 years) with or without human immunodeficiency virus (HIV) and without history of clinical ASCVD were enrolled. We hypothesized that increased macrophage-specific arterial infiltration would relate to plaque composition and systemic immune activation among PWH. We applied a novel targeted molecular imaging approach (technetium-99m [99mTc]–tilmanocept single photon emission computed tomography [SPECT]/CT) and comprehensive immune phenotyping.
Aortic 99mTc-tilmanocept uptake was significantly higher among PWH (n = 20) than participants without HIV (n = 10) with similar 10-year ASCVD risk (P = .02). Among PWH, but not among participants without HIV, noncalcified aortic plaque volume related directly to aortic 99mTc-tilmanocept uptake at different uptake thresholds. An interaction (P = .001) was seen between HIV status and noncalcified plaque volume, but not calcified plaque (P = .83). Systemic levels of caspase-1 (P = .004), CD14–CD16+ (nonclassical/patrolling/homing) monocytes (P = .0004) and CD8+ T cells (P = .005) related positively and CD4+/CD8+ T-cell ratio (P = .02) inversely to aortic 99mTc-tilmanocept uptake volume.
Macrophage-specific arterial infiltration was higher among PWH and related to noncalcified aortic plaque volume only among PWH. Key systemic markers of immune activation relating to macrophage-specific arterial infiltration may contribute to heightened ASCVD risk among PWH.
NCT02542371.
Atherosclerotic cardiovascular disease (ASCVD) is increased among people with human immunodeficiency virus (PWH) [1–3]. We and others have hypothesized that persistent monocyte activation among PWH [4, 5] contributes to accelerated atherogenesis through downstream arterial inflammation. We previously utilized fluorine-18 fluorodeoxyglucose (18F-FDG) positron emission tomography/computed tomography (PET/CT) to quantify aortic arterial inflammation, demonstrating that PWH have higher aortic 18F-FDG uptake [6]. 18F-FDG uptake on PET/CT, however, represents metabolically active cells and is not macrophage-specific at the receptor level [7].
Subsequently, we performed the first-in-human application of the macrophage-specific radiotracer, technetium-99m diethylenetriamine penta-acetic acid–mannosyl–dextran (99mTc-tilmanocept) to determine feasibility for assessment of vascular inflammation [8]. 99mTc-tilmanocept is currently US Food and Drug Administration (FDA)–approved for the identification of lymph nodes in select solid tumors and binds to the macrophage cell surface mannose receptor, CD206, through its dextran backbone, conferring the radiotracer its specificity to CD206+ macrophages [9, 10]. CD206+ macrophages are traditionally classified as M2 macrophages. However, in recent years, dichotomous classifications of macrophages into either classically differentiated (M1) or alternatively differentiated (M2) have come into question given that macrophages can change their phenotype/polarization in response to their microenvironment [11, 12]. Additionally, CD206+ macrophages can be found at a higher density within thin-cap (high-risk) fibro-atheromatous plaque compared to plaques with a thick fibrous cap, which are less prone to rupture [13].
To identify potential mechanisms of accelerated atherogenesis among PWH, we assessed differences in aortic CD206+ macrophage-specific arterial infiltration (assessed using 99mTc-tilmanocept single photon emission computed tomography [SPECT]/CT) in relationship to atherosclerotic plaque composition and systemic immune activation indices, comparing groups with and without human immunodeficiency virus (HIV) with similar ASCVD risk. The immune parameters investigated for this study were selected because of either their association to atherogenesis in the general population (including NOD-like receptor protein family pyrin domain containing 3 [NLRP3] inflammasome activation) [14, 15] and/or immune dysfunction among PWH (including monocyte activation [16] and T-cell senescence) [17, 18]. We hypothesized that PWH would have a higher level of aortic macrophage-specific arterial infiltration in relation to noncalcified aortic plaque and select systemic markers of immune activation and immune cell subpopulations.
METHODS
Study Design and Participants
People with and without HIV group-matched based on age, body mass index (BMI), and ASCVD risk scores were recruited from the Boston area between September 2015 and August 2021 (Supplementary Figure 1). Eligible participants were ≥18 years of age and had no history of myocardial infarction, angina, coronary artery stenting or surgery, current or recent treatment with anti-inflammatory medications (including prescription systemic steroids, anti-inflammatory/immunosuppressant medications and/or statins), and no contraindications to aortic CT angiography or SPECT/CT. Participants with HIV were eligible if receiving antiretroviral therapy (ART) without a change in regimen within 3 months of enrollment and a CD4 count >50 cells/mm3 but were not required to be virally suppressed. Evaluable SPECT/CT data were available for 20 PWH and 10 participants without HIV. The first 6 participants with HIV were recruited with known subclinical atherosclerosis to establish feasibility of 99mTc-tilmanocept SPECT/CT to investigate vascular inflammation [8]. The remainder of the participants enrolled (14 PWH and 10 participants without HIV) were recruited without regard to the presence of subclinical atherosclerosis. One participant with HIV displayed abnormally low liver uptake of 99mTc-tilmanocept as well as high 99mTc-tilmanocept signal throughout the heart and aorta, consistent with reduced hepatic clearance and high blood-pool activity. At the time of imaging, this subject did not have a confirmed diagnosis of liver disease but subsequently has received a diagnosis of cirrhosis thought to be secondary to viral hepatitis. To be conservative, this participant’s high aortic 99mTc-tilmanocept activity was excluded from our data analysis. Additionally, 1 participant without HIV who underwent SPECT/CT imaging did not have an evaluable thoracic CT angiography due to a technical error and was thus not included in subsequent analyses. This study was approved by Mass General Brigham Institutional Review Board and registered at ClinicalTrials.gov (NCT02542371). All subjects provided written informed consent.
99mTc-Tilmanocept SPECT/CT
99mTc-tilmanocept SPECT/CT was performed using a Symbia T6 SPECT/CT system. For further details, see Supplementary Methods. Approximately 2 mCi (50 μg) (median, 1.9 [interquartile range, 1.7–2.1] mCi) of 99mTc-tilmanocept was injected subcutaneously at a uniform injection site among study participants; the subcutaneous route of administration was chosen given that it is the FDA-approved route of administration for 99mTc-tilmanocept. Due to the spatial resolution of SPECT imaging and prognostic capabilities of thoracic aortic atherosclerosis [19], the thoracic aorta was chosen as the vessel of interest. Approximately 180 minutes after the 99mTc-tilmanocept injection, participants underwent 90 minutes of thoracic SPECT imaging acquisition. Study procedures regarding the timing of SPECT image acquisition after injection are described in our prior publication [8]. CT imaging acquisition occurred directly after SPECT imaging acquisition. All SPECT/CT scans were read, blinded to HIV status, by a single reader (M. Q. W.) to reduce variability. For each participant, we calculated the total volume within the aortic volume of interest that was at or above a range of radioactivity thresholds. These measures gave an indication of both the severity and extent of aortic 99mTc-tilmanocept uptake. Given the novelty of this approach and the complex nature of macrophage infiltration into plaque, we assessed 99mTc-tilmanocept uptake across a range of thresholds reflecting increasing tilmanocept uptake to further quantify differences in global aortic uptake activity between study cohorts. These thresholds were set at 3–6 times the background 99mTc-tilmanocept activity of the muscle. Percentage of the total volume at or above each activity threshold level was also computed. Image analysis was performed using AMIDE software (http://amide.sourceforge.net/).
CT Angiography
Iodinated contrast-enhanced CT angiography of the thoracic aorta (ascending, arch, descending, and thoracic aorta to the level of the diaphragm) was performed using a second- or third-generation dual-source CT scanner (SOMATOM Definition Flash or SOMATOM Force, Siemens; Supplementary Methods). Noncalcified plaque was defined as having a Hounsfield unit (HU) cutoff of <130, whereas calcified plaque was defined as having a HU cutoff of ≥130 [20].
Immune Phenotyping
Plasma levels of the following circulating markers of immune activation were assessed using commercially available enzyme-linked immunosorbent assay kits (Supplementary Table 1): caspase-1, CXCL10/interferon-γ–induced protein 10 (IP-10), CCL2/monocyte chemoattractant protein 1 (MCP-1), high-sensitivity interleukin 6 (hsIL-6), interleukin 18 (IL-18), lipoprotein-associated phospholipase A2 (Lp-PLA2), soluble CD14 (sCD14), oxidized low-density lipoprotein (oxLDL), and soluble CD163 (sCD163). All samples were run in duplicate with assay controls and standard curves. Flow cytometry was performed using ethylenediaminetetraacetic acid–coagulated whole blood using a BD FACSAria IIIu System, which was stained within 120–240 minutes from the time of collection [4]. Monocyte (classical: CD14+CD16–; inflammatory/intermediate: CD14+CD16+; nonclassical/patrolling/homing: CD14–CD16+), and lymphocyte subpopulations (CD4+ and CD8+ T lymphocytes) were identified (Supplementary Methods and Supplementary Figure 2).
Metabolic Phenotyping
Fasting lipid levels and medical history were prospectively obtained. Ten-year ASCVD risk score was determined [21].
Statistical Analysis
The primary endpoint was the between-group difference in aortic 99mTc-tilmanocept uptake (macrophage-specific arterial infiltration) on SPECT/CT among participants with or without HIV. Secondary endpoints included assessment of the relationship between aortic 99mTc-tilmanocept uptake and aortic atherosclerotic plaque volume as well as the relationship between aortic 99mTc-tilmanocept uptake and measures of immune activation/inflammation. For our primary endpoint analysis, a repeated measures analysis of variance (ANOVA) including all observations with the percentage aortic volume above a given threshold of 99mTc-tilmanocept uptake, controlling for sex, was used. The relationship between aortic atherosclerotic plaque volume and aortic volume at a given threshold of 99mTc-tilmanocept uptake was determined in a series of linear mixed-effects regression models using restricted maximum likelihood estimation with aortic volume with 99mTc-tilmanocept uptake as the dependent variable, individual (enrollment number) as a random effect, and independent fixed effects of HIV status, 99mTc-tilmanocept uptake threshold, aortic plaque volume, and an interaction term for HIV status and plaque volume, in models for each plaque type (calcified and noncalcified). The relationship between aortic 99mTc-tilmanocept uptake and immune parameters as well as aortic plaque volume and immune parameters, respectively, was also assessed in similar modeling. Sensitivity analyses were performed excluding any participant with aortic plaque volume >1000 mm3 to determine if the significant relationship found between aortic atherosclerotic plaque volume and 99mTc-tilmanocept uptake was driven by participants with higher atherosclerotic plaque volumes. One participant with HIV was excluded as an outlier in primary and secondary endpoint analyses given that his aortic atherosclerotic plaque volume was 4 standard deviations above the mean of participants with HIV. Given that this was an exploratory analysis, a formal sample size calculation was not performed. Statistical tests were performed using JMP software (version 15 and 16; SAS Institute) and SAS version 9.4.
RESULTS
Demographic Parameters
Study participants had a mean age of 56 ± 7 years. Participants with and those without HIV did not differ with respect to race, BMI, lipid levels, or current smoking status. Ten-year ASCVD risk score was similar between groups (7.3 ± 4.7% for PWH vs 8.1 ± 5.3% for participants without HIV; P = .70). Among PWH, the mean ± standard deviation duration of HIV infection was 22 ± 9 years, CD4+ T-cell count was 633 ± 269 cells/mm3, and baseline log viral load was 1.28 (1.28–1.42 [interquartile range]) copies/mL, with 95% of PWH having a viral load below the limit of detection (<20 copies/mL). Aortic plaque volume tended to be higher among participants with HIV (Table 1).
Baseline Characteristics Among Participants With and Without Human Immunodeficiency Virus
| Characteristic | Participants With HIV (n = 20) | Participants Without HIV (n = 10) | P Value |
|---|---|---|---|
| Baseline demographics | |||
| Age, y | 55 ± 7 | 58 ± 4 | .12 |
| Sex, % | |||
| Male | 80 (16/20) | 80 (8/10) | 1.00 |
| Female | 20 (4/20) | 20 (2/10) | |
| Race, % | |||
| White | 50 (10/20) | 70 (7/10) | .52 |
| Black | 40 (8/20) | 30 (3/10) | |
| Asian | 5 (1/20) | 0 (0/10) | |
| Other | 5 (1/20) | 0 (0/10) | |
| 10-year ASCVD risk score, %a | 7.3 ± 4.7 | 8.1 ± 5.3 | .70 |
| BMI, kg/m2 | 25.7 ± 4.7 | 27.6 ± 5.3 | .34 |
| Total cholesterol, mg/dL | 185 ± 33 | 188 ± 36 | .85 |
| LDL-C, mg/dL | 111 ± 27 | 107 ± 33 | .73 |
| HDL-C, mg/dL | 49 (42–54) | 57 (45–73) | .06 |
| Triglycerides, mg/dL | 103 (77–178) | 104 (77–160) | .79 |
| Current HTN, % | 15 (3/20) | 10 (1/10) | .70 |
| Current smoking, % | 30 (6/20) | 30 (3/10) | 1.00 |
| HIV-specific parameters | |||
| Duration since HIV diagnosis, y | 22 ± 9 | … | |
| CD4+ T-cell count, cells/mm3 | 633 ± 269 | … | |
| Log HIV viral load, copies/mL | 1.28 (1.28–1.42) | … | |
| HIV viral load, copies/mLb | 19 (19–27) | … | |
| Aortic atherosclerotic plaque volume on CTAc | |||
| Total (noncalcified and calcified) aortic plaque volume, mm3 | 284.5 (0.0–578.6) | 109.1 (0.0–350.1) | .45 |
| Noncalcified aortic plaque volume, mm3 (HU <130) | 79.8 (0.0–481.0) | 28.1 (0.0–206.0) | .42 |
| Calcified aortic plaque volume, mm3 (HU ≥130) | 97.6 (0.0–262.4) | 34.3 (0.0–114.1) | .32 |
Normally distributed data are reported as mean ± standard deviation. Nonnormally distributed data are reported as median (interquartile range). Between-group differences of baseline demographic characteristics were assessed using a Student t test, Wilcoxon rank-sum test, or χ2 test as appropriate. Aortic atherosclerotic plaque volume was quantified on thoracic CTA. Calcified and noncalcified plaque volumes are presented with a threshold of ≥130 HU differentiating calcified from noncalcified plaque.
Abbreviations: ASCVD, atherosclerotic cardiovascular disease; BMI, body mass index; CTA, computed tomography angiography; HDL-C, high-density lipoprotein cholesterol; HIV, human immunodeficiency virus; HTN, hypertension; HU, Hounsfield units; LDL-C, low-density lipoprotein cholesterol.
LDL-C level was imputed as 70 mg/dL for the 10-year ASCVD risk score calculation for 1 study participant without HIV due to an LDL-C of <70 mg/dL.
For participants with HIV whose viral load was undetectable, a value of 19 copies/mL was imputed given that the lower limit of detection for the HIV viral load assay was 20 copies/mL.
One participant with HIV was not included because his total aortic plaque volume was 4 standard deviations above the median total aortic plaque volume among participants with HIV. Furthermore, 1 participant without HIV did not complete his CTA and thus did not have aortic plaque volume data available.
Systemic Levels of Markers of Immune Activation and Immune Cell Subpopulations
PWH had significantly higher levels of CCL2/MCP-1, CXCL10/IP-10, caspase-1, percentage of circulating monocytes, and number of CD14–CD16+ (nonclassical/patrolling/homing) monocytes and CD8+ T cells, as well as lower CD4+ T cells and median CD4+/CD8+ T-cell ratio (Table 2).
Systemic Immune Parameters Among Participants With and Without HIV and Its Relationship to Aortic 99mTc-Tilmanocept Uptake
| Parameter | Participants With HIV (n = 19) | Participants Without HIV (n = 9) | P Value for Between-Group Comparisona | β-Estimate for Relationship With 99mTc-Tilmanocept Uptakeb | Normalized β-Estimate per SD for Relationship With 99mTc-Tilmanocept Uptakeb | P Value for Relationship With 99mTc-Tilmanocept Uptakeb |
|---|---|---|---|---|---|---|
| Circulating systemic markers of immune activation | ||||||
| sCD14, ng/mL | 1653.8 ± 282.3 | 1500.8 ± 217.8 | .13 | 13.7 | 3688.3 | .08 |
| sCD163, ng/mL | 617.0 (515.0–1101.2) | 540.5 (453.8–675.4) | .26 | 1.1 | 608.8 | .80 |
| CCL2/MCP-1, pg/mL | 217.7 ± 60.6 | 172.3 ± 34.8 | .02 | −161.2 | −9222.6 | .0001 |
| CXCL10/IP-10, pg/mL | 161.4 (111.9–230.2) | 76.7 (58.6–87.3) | .0004 | −13.3 | −1612.6 | .43 |
| Lp-PLA2, ng/mL | 131.8 ± 71.9 | 145.8 ± 65.8 | .61 | 22.9 | 1582.9 | .44 |
| IL-18, pg/mL | 147.9 (101.8–193.4) | 147.3 (97.0–189.1) | .75 | −5.3 | −765.7 | .77 |
| Caspase-1, pg/mL | 77.3 (48.5–97.5) | 45.6 (38.4–55.5) | .01 | 137.4 | 5728.2 | .004 |
| hsIL-6, pg/mL | 2.4 (1.5–4.8) | 1.8 (1.0–4.1) | .46 | −1160.4 | −5164.6 | .13 |
| oxLDL, U/L | 47.1 (39.7–53.6) | 42.1 (34.8–55.6) | .66 | −144.4 | −1946.8 | .33 |
| Circulating monocyte subpopulationsc | ||||||
| % of monocytes from total PBMCs | 7.5 ± 1.8 | 4.6 ± 1.5 | .0003 | 2028.9 | 4439.7 | .04d |
| Absolute No. of CD14+CD16– cells/µL | 310.9 (214.6–381.7) | 241.7 (159.9–313.1) | .19 | 66.9 | 10 285.4 | <.0001d |
| Absolute No. of CD14+CD16+ cells/µL | 29.8 (21.0–40.2) | 24.4 (12.2–30.2) | .07 | 202.6 | 4125.9 | .08 |
| Absolute No. of CD14–CD16+ cells/µL | 23.9 ± 14.2 | 14.9 ± 4.9 | .02 | 554.2 | 6981.4 | .0004 |
| Circulating lymphocyte subpopulationsc | ||||||
| % of lymphocytes from total PBMCs | 40.4 ± 11.5 | 28.8 ± 6.3 | .002 | −264.6 | −3015.8 | .14 |
| % CD4+ T cells | 31.0 (24.7–35.8) | 53.5 (45.0–75.7) | <.0001 | −240.3 | −4234.7 | .04d |
| Absolute No. of CD4+ T cells/µL | 569.0 (408.2–736.9) | 728.2 (600.5–1100.6) | .03 | 12.5 | 4424.9 | .04d |
| % CD8+ T cells | 43.9 (31.6–60.6) | 20.9 (14.9–26.3) | .0006 | 343.8 | 6629.2 | .009 |
| Absolute No. of CD8+ T cells/µL | 887.3 ± 457.7 | 366.9 ± 261.1 | .001 | 13.3 | 6244.3 | .005d |
| CD4+/CD8+ T-cell ratio | 0.6 (0.5–1.3) | 2.8 (1.8–4.9) | .0002 | −3166.8 | −4775.2 | .02 |
Normally distributed data are reported as mean ± standard deviation. Nonnormally distributed data are reported as median (interquartile range). P values <.05 were considered significant and are bolded.
Abbreviations: 99mTc, technetium-99m; hsIL-6, high-sensitivity interleukin 6; HIV, human immunodeficiency virus; IL-18, interleukin 18; IP-10, interferon-γ–induced protein 10; Lp-PLA2, lipoprotein-associated phospholipase A2; MCP-1, monocyte chemoattractant protein 1; PBMC, peripheral blood mononuclear cell; oxLDL, oxidized LDL; sCD14, soluble CD14; sCD163, soluble CD163; SD, standard deviation.
Between-group P values were determined by Student 2-tailed t test for normally distributed variables and by Wilcoxon rank-sum test for nonnormally distributed variables.
β-estimate and P value for the relationship between each parameter and aortic volume with 99mTc-tilmanocept uptake determined by linear mixed-effects regression modeling using restricted maximum likelihood estimation. Aortic volume with 99mTc-tilmanocept uptake was the dependent variable in each model; the parameter and threshold were independent fixed effects; and individual was a random effect. To facilitate comparisons of β-estimates across different indices of immune activation, β-estimates have been normalized by the standard deviation of each respective immune parameter.
Flow cytometric assessments were not performed for 1 study participant with HIV; thus, n = 18 for analyses pertaining to circulating monocyte and lymphocyte subpopulations.
Indicates a significant interaction between the systemic level of the immune parameter and HIV status demonstrated in linear mixed-effects modeling with aortic volume with 99mTc-tilmanocept uptake as the dependent variable, the immune parameter, threshold, and HIV status as independent fixed effects, and individual (enrollment number) as a random effect.
Aortic 99mTc-Tilmanocept Uptake on SPECT/CT
Aortic 99mTc-tilmanocept uptake was characterized by the percentage of aortic volume with activity at or above specific thresholds: 3–6 times the background muscle 99mTc-tilmanocept uptake, as described in the Methods. A curve was generated for each participant with the percentage uptake across each threshold (Figure 1Aand 1B). In a repeated-measures ANOVA controlling for sex, aortic 99mTc-tilmanocept uptake was higher among PWH than in participants without HIV (P = .02), particularly at the higher thresholds of 5, 5.5, and 6 times background activity (Figure 1B).
![Aortic technetium-99m (99mTc)–tilmanocept single photon emission computed tomography (SPECT/CT) imaging among participants with or without human immunodeficiency virus (HIV). A, Aortic99mTc-tilmanocept SPECT/CT. Representative axial SPECT/CT cuts from a participant with HIV (left) and a participant without HIV (right). Higher signal-to-background ratio (ie, 99mTc-tilmanocept uptake signal-to-background ratio [SBR]) is depicted by red-orange on SPECT/CT images whereas a lower SBR is depicted by blue-purple on SPECT/CT images. The SPECT/CT image from the participant with HIV demonstrates a higher level of aortic 99mTc-tilmanocept uptake. B, Aortic99mTc-tilmanocept uptake on SPECT/CT. The percentage of aortic volume with 99mTc-tilmanocept on SPECT/CT is demonstrated across different thresholds (3–6 times) at or above muscle activity. Each line (red for participants with HIV and blue for participants without HIV) connects the data for a single participant. Participants with HIV had a significantly higher percentage aortic volume with 99mTc-tilmanocept uptake across different thresholds above muscle activity compared to participants without HIV (P = .02).](https://oup.silverchair-cdn.com/oup/backfile/Content_public/Journal/jid/226/10/10.1093_infdis_jiac301/6/m_jiac301f1.jpeg?Expires=1750210547&Signature=e~EhR8UAZMLZJKnAnNTs1zLaWlp2cXhOusbBurRIG2xjY0oGJuMuy8QfGmnShsiMpHz-~GHo87ypSEhLXtYQ3-dVdQ8zwqQdjxeLmE6TOh4sPTNxlAwlRGtqJmu8K9BxnaahlVCwmkT~Acesai6EtqcZa01kA23EOYBmXoPVIgXJD6qvWjQDFeZVnxYzKh5E~fxrG5RrdL35cHBTRGXjypeCZodkoo2U2gPg79zI3GpaXcuZyJN7RK91uXZsAybPxvlRA8gfATvvW-sbbhuYiCRnllygAafdR1GpyLe~CgHcvY4CGw1Hc0rwr~3YL7mHQv3mr2cqNp2l4oYoEILbMw__&Key-Pair-Id=APKAIE5G5CRDK6RD3PGA)
Aortic technetium-99m (99mTc)–tilmanocept single photon emission computed tomography (SPECT/CT) imaging among participants with or without human immunodeficiency virus (HIV). A, Aortic99mTc-tilmanocept SPECT/CT. Representative axial SPECT/CT cuts from a participant with HIV (left) and a participant without HIV (right). Higher signal-to-background ratio (ie, 99mTc-tilmanocept uptake signal-to-background ratio [SBR]) is depicted by red-orange on SPECT/CT images whereas a lower SBR is depicted by blue-purple on SPECT/CT images. The SPECT/CT image from the participant with HIV demonstrates a higher level of aortic 99mTc-tilmanocept uptake. B, Aortic99mTc-tilmanocept uptake on SPECT/CT. The percentage of aortic volume with 99mTc-tilmanocept on SPECT/CT is demonstrated across different thresholds (3–6 times) at or above muscle activity. Each line (red for participants with HIV and blue for participants without HIV) connects the data for a single participant. Participants with HIV had a significantly higher percentage aortic volume with 99mTc-tilmanocept uptake across different thresholds above muscle activity compared to participants without HIV (P = .02).
Aortic 99mTc-Tilmanocept Uptake in Relation to Atherosclerotic Plaque
In our multivariable regression modeling with aortic 99mTc-tilmanocept uptake as the dependent variable, the interaction term for HIV status and aortic plaque volume was significant for the model of noncalcified plaque (overall model R2 = 0.72, interaction term: β-estimate = 27 mm3, P < .001 for interaction), but not for calcified plaque (overall model R2 = 0.79, interaction term: β-estimate = 5 mm3, P = .83 for interaction; Supplementary Table 2). Furthermore, the relationships between noncalcified aortic plaque volume and aortic volume of 99mTc-tilmanocept uptake at or above each threshold were significant among PWH (all P < .01) but not among those without HIV (Table 3; Figure 2).
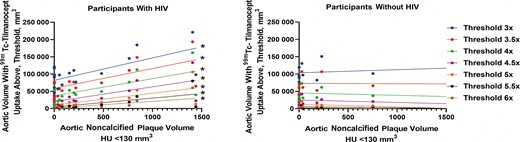
Aortic volume with technetium-99m (99mTc)–tilmanocept uptake across different thresholds in relation to aortic noncalcified plaque volume. The relationship between aortic volume with 99mTc-tilmanocept uptake and aortic noncalcified plaque volume is demonstrated here. Each vertical set of circles represents the aortic volume with 99mTc-tilmanocept uptake at a given threshold as a function of the aortic noncalcified plaque volume for each participant. Furthermore, linear regression lines for each uptake threshold are also shown. Using linear regression modeling, aortic volume with 99mTc-tilmanocept uptake across different thresholds related significantly to aortic noncalcified plaque volume among participants with human immunodeficiency virus (HIV) (and not among participants without HIV). *P < .05.
Aortic Volume With 99mTc-Tilmanocept Uptake Across Different Thresholds in Relation to Aortic Noncalcified Plaque Volume
| 99mTc-Tilmanocept Uptake Threshold | Participants With HIVa (n = 18) | Participants Without HIVb (n = 9) | ||||
|---|---|---|---|---|---|---|
| R2 | β-Estimate | P Value | R2 | β-Estimate | P Value | |
| 3× muscle activity | 0.46 | 64.8 | .002 | 0.008 | 9.0 | .81 |
| 3.5× muscle activity | 0.43 | 57.4 | .003 | 0.0001 | −1.0 | .98 |
| 4× muscle activity | 0.41 | 49.5 | .004 | 0.009 | −6.8 | .81 |
| 4.5× muscle activity | 0.43 | 42.8 | .003 | 0.03 | −7.0 | .68 |
| 5× muscle activity | 0.44 | 34.1 | .003 | 0.08 | −7.6 | .45 |
| 5.5× muscle activity | 0.44 | 25.9 | .003 | 0.05 | −3.1 | .56 |
| 6× muscle activity | 0.44 | 19.5 | .003 | 0.14 | −2.4 | .32 |
R2, β-estimate, and P value from simple (bivariate) linear regression modeling at the indicated uptake threshold and HIV status, with 99mTc-tilmanocept uptake as the dependent variable and aortic noncalcified volume as the independent variable. Bivariate regression analyses results for the aortic noncalcified volume with Hounsfield unit <130 are shown. P values <.05 were considered significant and are bolded.
Abbreviations: 99mTc, 99m-technetium; HIV, human immunodeficiency virus.
One participant with HIV was not included because his total aortic plaque volume was 4 standard deviations above the median total aortic plaque volume among participants with HIV. Another participant with HIV was not included because he had high levels of 99mTc-tilmanocept uptake, which were thought to be likely due to decreased hepatic clearance.
One participant without HIV did not complete his computed tomography angiography and thus did not have aortic plaque volume data available.
Sensitivity Analysis for Aortic Plaque Volume
A sensitivity analysis was performed, excluding any participants with aortic plaque volume >1000 mm3. With this sensitivity analyses, the interaction term for noncalcified plaque and HIV status remained significant (overall model R2 = 0.77, interaction term: β-estimate = 29 mm3, P < .0001 for interaction), and the interaction term for calcified plaque remained nonsignificant (overall R2 = 0.74, interaction term: β-estimate = −7 mm3, P = .76 for interaction). Furthermore, noncalcified plaque volume continued to relate significantly to aortic volume of 99mTc-tilmanocept uptake at every threshold among PWH but not among participants without HIV (Supplementary Table 3). Total, noncalcified, and calcified aortic plaque volume also related to systemic levels of markers of immune activation and immune cell subpopulations (Supplementary Table 4).
Aortic 99mTc-Tilmanocept Uptake in Relation to Systemic Levels of Markers of Immune Activation and Immune Cell Subpopulations
Among all participants, aortic volume with 99mTc-tilmanocept uptake related positively to caspase-1 (β-estimate = 137.4 mm3, P = .004) but inversely to CCL2/MCP-1 (β-estimate = −161.2 mm3, P = .0001) (Table 2). Aortic volume with 99mTc-tilmanocept uptake, however, did not relate to systemic levels of sCD14 and sCD163 (Table 2). Moreover, among all participants, there was a significant relationship between the percentage of monocytes and aortic volume of 99mTc-tilmanocept uptake (β-estimate = 2028.9 mm3, P = .04). With respect to monocyte subpopulations, the number of circulating CD14+CD16– (classical) monocytes (β-estimate = 66.9 mm3, P < .0001) and the number of CD14–CD16+ (nonclassical/patrolling/homing) monocytes (β-estimate = 554.2 mm3, P = .0004) related positively to aortic volume with 99mTc-tilmanocept uptake. With respect to lymphocyte subpopulations, aortic volume with 99mTc-tilmanocept uptake related inversely to the percentage of CD4+ T cells (β-estimate = −240.3 mm3, P = .04) and positively to the percentage of CD8+ T cells (β-estimate = 343.8 mm3, P = .009). Notably, the CD4+/CD8+ T-cell ratio related inversely to aortic volume with 99mTc-tilmanocept uptake (β-estimate = −3166.8 mm3, P = .02). The percentage of circulating monocytes, absolute number of CD14+CD16– (classical) monocytes, percentage of CD4+ T cells, and absolute number of CD8+ T cells differed in relationship to arterial inflammation by HIV status with a positive interaction term in regression modeling (Table 2).
DISCUSSION
Among a relatively small cohort, we demonstrated significantly higher thoracic aortic 99mTc-tilmanocept uptake on SPECT/CT across different uptake thresholds among PWH, reflective of increased CD206+ macrophage-specific arterial infiltration in this population, compared to participants without HIV. Noncalcified plaque volume directly related to aortic 99mTc-tilmanocept uptake across different uptake thresholds among PWH but not among participants without HIV. Aortic volume with 99mTc-tilmanocept uptake also related positively to systemic caspase-1 and CD14–CD16+ (nonclassical/patrolling/homing) monocyte levels but was inversely related to the CD4+/CD8+ T-cell ratio. Our results highlight key differences in CD206+ macrophage-specific arterial infiltration in PWH, limited to noncalcified atherosclerotic plaque, and demonstrate key systemic levels of markers of immune activation and immune cell subpopulations, such as the NLRP3 inflammasome and T-cell senescence, which were significantly related to arterial inflammation.
Aortic volume with 99mTc-tilmanocept uptake on SPECT/CT was significantly higher among participants with than those without HIV, particularly at higher uptake thresholds. We previously published on ex vivo studies demonstrating a high degree of co-localization and specificity between immunofluorescent probes of tilmanocept and CD206 in the aortic wall [8]. Thus, given that 99mTc-tilmanocept binds to CD206+ macrophages, our current findings suggest that CD206+ macrophage-specific arterial infiltration is higher among asymptomatic PWH on ART compared to participants without HIV with similar ASCVD risk scores. Macrophages play a key role in atherogenesis and are often classified as either classically differentiated (M1) or alternatively differentiated (M2). M2 macrophages, in particular, express high levels of CD206 on their surface and have multiple roles within atherosclerotic plaque, including tissue remodeling, phagocytosis of apoptotic cells, and the secretion of low levels of the proinflammatory cytokines IL-1β and IL-6 and high levels of the anti-inflammatory cytokine IL-10 [22]. Despite these dichotomous classifications, macrophages may change their phenotype/polarization depending on their microenvironment, resulting in significant changes in their transcriptome [23–27]. Moreover, histopathological studies have demonstrated that CD206+ macrophage-specific arterial infiltration is higher within high-risk atherosclerotic plaque compared to plaque less prone to rupture [13].
Although participants with and without HIV had similar ASCVD risk scores, CD206+ macrophage-specific arterial infiltration related significantly to aortic plaque volume among participants with HIV but not among participants without HIV. Furthermore, among PWH, arterial inflammation was differentially related to aortic plaque volume based on plaque subtype with a significant relationship found with noncalcified plaque and not with calcified plaque. The data from this study extend prior work identifying the potential significance of increased rupture-prone [28] noncalcified plaque in PWH [29] to increased arterial inflammation through macrophage-specific imaging. Though aortic plaque volume did not differ by group, we performed a sensitivity analysis to ensure our results were not driven by the higher aortic plaque volume seen among some of the participants with HIV and demonstrated similar results.
CD206+ macrophage-specific arterial infiltration also significantly related to systemic levels of a key marker of NLRP3 inflammasome activation, caspase-1, in our study cohort. Caspase-1, which was higher among our participants with HIV, plays a central role in the generation of proinflammatory cytokines in response to NLRP3 inflammasome activation [14, 30, 31]. General population studies [32] and animal studies [33] suggest that NLRP3 inflammasome activation promotes atherogenesis. Furthermore, caspase-1 also plays a role in CD4+ T-cell depletion in HIV by triggering pyroptosis—a highly inflammatory form of programmed cell death [34]. In Toribio et al, systemic caspase-1 levels did not relate to aortic 18F-FDG PET uptake, unlike in the current study, where we did find a significant relationship between aortic 99mTc-tilmanocept uptake and systemic caspase-1 levels [15]. Differences in the imaging techniques and study populations (PWH newly initiated on ART in the prior study vs chronically treated with ART in current) could have contributed to these observed differences. Our study also found an inverse relationship between systemic levels of a proinflammatory cytokine involved in monocyte recruitment to the endothelium, CCL2/MCP-1 [35], and CD206+ macrophage-specific arterial infiltration. Furthermore, our study did not find a significant relationship between systemic levels of the markers of monocyte activation, sCD14 and sCD163—markers that have been associated with ASCVD among PWH in prior studies [16, 36]. While histopathologic studies have demonstrated that CD163 macrophages co-localize with CD206 macrophages within atherosclerotic plaque, it is unclear whether systemic levels of sCD163 relate to CD206+ macrophage-specific arterial infiltration [13]. Thus, the absence of significant relationships between systemic markers of monocyte activation, such as sCD163, and CD206+ macrophage-specific arterial infiltration in our current study may suggest that only select markers of immune activation associate with tissue level CD206+ macrophage infiltration. Together, these findings highlight the need for additional studies that target NLRP3 inflammasome and monocyte activation, respectively, to understand the physiologic relevance of the directionality and significance of these relationships with respect to C206+ macrophage-specific arterial infiltration and downstream atherogenesis among PWH.
In addition to systemic markers of immune activation, CD206+ macrophage-specific arterial infiltration also related to select systemic levels of immune subpopulations such as nonclassical/homing (CD14–CD16+) monocytes. Nonclassical/homing monocytes are also referred to as patrolling monocytes given that the high expression of the cell surface adhesion receptor CX3CR1 allows them to patrol the vascular endothelium and, while doing so, facilitate the removal of damaged endothelial cells [37, 38]. In addition to being found within the luminal side of the vascular endothelium, nonclassical monocytes also have been found within atherosclerotic plaque [39]. Higher levels of nonclassical monocytes among PWH may occur in response to inflammatory stimuli, such as lipopolysaccharide and oxLDL [40]. Furthermore, studies have suggested that CD16+ monocytes, including nonclassical monocytes, may be more susceptible to HIV viral entry and viral replication, facilitating viral persistence among PWH on ART [41].
Arterial inflammation among our study cohort also related to systemic CD8+ T-cell levels and the CD4+/CD8+ T-cell ratio. CD8+ T cells have both proatherogenic (through the release of proinflammatory cytokines and cytotoxicity toward cells involved in lesion stability) and anti-atherogenic effects (through its cytotoxicity of antigen presenting cells and inhibition of CD4+ T-cell polarization to a proatherogenic phenotype), depending on their cytokine and/or chemokine receptor expression [42]. Furthermore, pathological studies have demonstrated that CD8+ T-cell infiltration in the vascular intima increases with atherosclerotic disease severity [43] and consists of highly activated CD8+ T cells [44]. Among PWH on ART, CD8+ T cells remain elevated despite CD4+ T-cell recovery [45]; CD8+ T-cell dysregulation through T-cell exhaustion and senescence is thought to contribute to this persistent elevation of CD8+ T cells [17] and, in turn, a lower CD4+/CD8+ T-cell ratio. The CD4+/CD8+ T-cell ratio is a key marker of immune recovery, with lower levels reflective of immune senescence [18]. Senescent T cells have been implicated in atherosclerosis due to their proinflammatory cytokine profile and secretion of granzymes and perforin that result in the lysis of vascular smooth muscle cells and endothelial cells [46].
Our study was limited by its cross-sectional study design and recruitment from 1 geographic region. The relatively small sample size may have precluded the detection of small differences in demographic parameters and secondary endpoints related to immune parameters and atherosclerotic plaque but was sufficient to detect significant differences in our prespecified primary endpoint of CD206+ macrophage-specific arterial infiltration across HIV status. The results from this study are hypothesis-generating but provide key biological insights into advanced atherogenesis in people with HIV. These limitations notwithstanding, our study is the first to apply the novel noninvasive targeted imaging modality, 99mTc-tilmanocept SPECT/CT, to investigate CD206+ macrophage-specific arterial infiltration among PWH on ART in relationship to detailed assessment of plaque type and immunophenotyping, comparing participants with HIV and without HIV, across a range of increased uptake thresholds.
It is currently unknown whether CD206+ macrophage-specific arterial infiltration, reflected by 99mTc-tilmanocept SPECT/CT uptake, represents uptake among resident-tissue vs monocyte-derived macrophages or both of these macrophage subtypes. Furthermore, it is also unknown whether CD206+ macrophage-specific arterial infiltration is compensatory or causal to atherosclerotic plaque development. Future studies applying this novel imaging strategy, including both in vivo and ex vivo studies, may elucidate this and thus provide insights into how persistent systemic immune activation among PWH contributes to accelerated atherogenesis in the setting of HIV infection as well as other inflammatory conditions. Additionally, studies investigating the relationship between circulating CD206+ monocytes and CD206+ macrophage-specific arterial infiltration are also needed. Preclinical and recent clinical studies have investigated the use of fluorescently labeled tilmanocept [47–50], which could potentially be used together with other imaging modalities such as PET to image other vessels, including the coronary vasculature. Clinical applications in the development of this imaging modality could include use of 99mTc-tilmanocept SPECT/CT imaging to follow dynamic changes in CD206+ macrophage-specific arterial infiltration in relation to changes over time in immune function and in response to targeted interventions to reduce immune activation.
These data suggest that increased CD206+ macrophage-specific arterial infiltration of noncalcified plaque may be a unique mechanism of increased cardiovascular disease risk in PWH. Use of this CD206+ macrophage-specific imaging modality may help to identify future targets for novel immunomodulatory therapies to reduce ASCVD risk among PWH.
Supplementary Data
Supplementary materials are available at The Journal of Infectious Diseases online (http://jid.oxfordjournals.org/). Supplementary materials consist of data provided by the author that are published to benefit the reader. The posted materials are not copyedited. The contents of all supplementary data are the sole responsibility of the authors. Questions or messages regarding errors should be addressed to the author.
Notes
Acknowledgments. We thank the participants of this study; the nursing and nutrition staff at the MGH Translational and Clinical Research Center; and Dr Edwin Palmer, Dr David Chow, Kayla Seaman, Courtney Telles, Allegra DePietro, and Nicole Corrao from the MGH Division of Nuclear Medicine and Molecular Imaging.
Disclaimer. The study funders had no role in the analysis of the data nor in the decision to publish the data.
Financial support. This research was funded by a Developmental Core Grant from the Harvard Center for AIDS Research (P30AI060354 to M. T.) and investigator-initiated funding to S. K. G. from Navidea Pharmaceuticals. This work was also supported by the Nutrition Obesity Research Center at Harvard (P30DK040561) and by grants to the Harvard Clinical and Translational Science Center from the National Center for Research Resources (8 UL 1TR000170 and 1 UL 1TR001102). M. T. is supported by the National Institutes of Health/National Heart, Lung, and Blood Institute (1K23HL147799-01) and the American Heart Association–Harold Amos Medical Faculty Development Program through the Robert Wood Johnson Foundation. M. V. Z. was supported in part through the National Institutes of Health/ National Institute of Allergy and Immunology (K24AI157882).
References
Author notes
M. T. and M. Q. W. contributed equally to this work.
Presented in part: Conference on Retroviruses and Opportunistic Infections (CROI), Denver, CO, USA, February 14, 2022.
Potential conflicts of interest. M. T. L. reports grant funding to his institution from AstraZeneca/MedImmune and Kowa Pharmaceuticals and consulting fees from PQBypass, unrelated to the present project. T. L. S. reports unrelated grant funding to her institution from Pfizer and Novo Nordisk. M. V. Z. is principal investigator of an industry-sponsored research grant from Gilead Sciences to her institution, unrelated to the present project. S. K. G. has grant funding to his institution from Gilead Sciences, KOWA Pharmaceuticals, and Theratechnologies, unrelated to the present project, and serves as a consultant for Theratechnologies, Regeneron, and ViiV Healthcare. All other authors report no potential conflicts.
All authors have submitted the ICMJE Form for Disclosure of Potential Conflicts of Interest. Conflicts that the editors consider relevant to the content of the manuscript have been disclosed.

