


Abstract
Persistent exposure to antigen leads to T-cell exhaustion and immunologic dysfunction. We examined the immune exhaustion markers T cell immunoglobulin and ITIM domain (TIGIT) and programmed cell death protein 1 (PD-1) in human immunodeficiency virus (HIV)–infected and healthy individuals and the relationship with cytotoxic CD8+ T-lymphocyte activity. Frequencies of TIGIT but not PD-1 were positively correlated with CD8+ T-lymphocyte activity in HIV-aviremic and healthy individuals; however, there was no correlation in HIV-viremic individuals. Transcriptome analyses revealed up-regulation of genes associated with antiviral immunity in TIGIT+CD8+ versus TIGIT−CD8+ T cells. Our data suggest that TIGIT+CD8+ T cells do not necessarily represent a state of immune exhaustion and maintain an intrinsic cytotoxicity in HIV-infected individuals.
Current treatments for human immunodeficiency virus (HIV) infection require continuous and lifelong antiretroviral therapy (ART) [1]. Although ART allows indefinite control of HIV replication in infected individuals, many challenges remain with regard to the financial burden, potential development of resistant virus, and cumulative toxic effects associated with lifelong therapy. To address these concerns, considerable efforts have been made in recent years to eradicate the persistent HIV reservoir and/or develop therapeutic strategies to achieve ART-free virologic remission. To this end, multiple approaches aimed at targeting the latent HIV reservoir have been investigated and shown to be unsuccessful at imparting durable virologic control in the absence of ART [2]. Given the inability to eradicate HIV in vivo [3], the field has shifted its focus toward developing immune-based therapies to harness host immunity against the virus and to achieve durable virologic remission in the absence of ART [4].
During acute infection, naïve CD8+ T cells differentiate into effector T cells in order to eliminate infected target cells and to clear pathogens. In chronic infections, such as HIV, the persistent exposure to antigen leads to T-cell exhaustion and inefficient control of the pathogen [5]. Exhausted CD8+ T cells are characterized by loss of their effector functions, persistent and elevated expression of inhibitory receptors, and abnormal metabolic states [5]. To reverse the state of immunologic abnormality and to reinvigorate exhausted T cells, therapeutic strategies involving the blockade of inhibitory receptors have been under active investigation, especially in cancer research.
The recent success of immune checkpoint inhibitor therapies in cancer treatments [6] has led to consideration of similar pathways in HIV infection. Currently, programmed cell death protein 1 (PD-1) and cytotoxic T-lymphocyte–associated antigen 4 (CTLA-4) blockade are the most well-characterized, but T cells in the setting of persistent viral infection may also express other immune exhaustion markers, such as T cell immunoglobulin and mucin domain-containing protein 3 (Tim-3), Lymphocyte-activation gene 3 (LAG-3), and T cell immunoglobulin and ITIM domain (TIGIT) [7]. TIGIT is a member of the poliovirus receptor nectin family that binds to CD155, also known as the poliovirus receptor, and is expressed on multiple cell types including CD4+ and CD8+ T lymphocytes and natural killer cells [8]. It has been shown that the blockade of TIGIT could lead to the clearance of tumors in mouse models. While coinhibition of both PD-1 and TIGIT may be necessary to fully reverse immune exhaustion, these data suggest a role for TIGIT in the restoration of cytolytic CD8+ T-cell functions [9]. Furthermore, previous studies have shown that the blockade of TIGIT and PD-1 could significantly improve T-cell function in HIV and simian immunodeficiency virus infection [10, 11]. However, the mechanism by which TIGIT modulates immune exhaustion and its impact on intrinsic cytotoxic T lymphocyte (CTL) activity in HIV infection remains unclear. We conducted the present study to address this issue.
METHODS
Study Subjects
Blood and leukapheresed products were collected from HIV-infected and healthy donors in accordance with clinical protocols approved by the institutional review boards of the National Institute of Allergy and Infectious Diseases and the Clinical Center at the National Institutes of Health. All study participants provided informed consent.
Flow Cytometric Analysis
Peripheral blood mononuclear cells were isolated from whole blood and leukapheresed products by Ficoll-Hypaque density gradient centrifugation. Cryopreserved peripheral blood mononuclear cells were thawed, washed, and stained with the following fluorophore-conjugated antibodies: CD3-allophycocyanin-H7 (clone SK7; BD no. 560176), CD4-allophycocyanin (clone SK3; BD no. 340443), TIGIT-phycoerythrin (PE) (clone MBSA43; eBioscience no. 12–9500), and PD-1–PE–cyanine 7 (clone eBioJ105; eBioscience no. 25–2799). Data were acquired on a BD FACSCanto II flow cytometer (on average 70 000 CD8+ T cells per sample) using the FACSDiva software (version 8.0.1, Becton Dickinson) and analyzed using FlowJo software (version 10.1r5; Tree Star).
CD8+ T Cell–Mediated Killing Assay
Highly enriched CD8+ T cells (0.1 × 10⁶ cells per well) were incubated at 37°C for 48 hours with a CEM–NKR–CCR5 T-cell lymphoblastoid leukemia cell line chronically infected with HIV-1 IIIB (CEM-IIIB; 0.15 × 10⁶ cells per well) in the presence of 5 µg/mL of an HIV 3BNC117×CD3 dual-affinity retargeting (DART) molecule (MacroGenics) comprising two arms: (1) an anti-HIV Env arm (specific for the CD4 binding site of glycoprotein 120) derived from broadly neutralizing monoclonal antibody 3BNC117 and (2) an anti-human CD3ε arm derived from humanized monoclonal antibody hXR32. The DART molecule targets and eliminates cells expressing HIV Env by effector T cells expressing CD3[12]. An RSV×CD3 DART molecule (anti–respiratory syncytial virus and anti-CD3 specificities) was used as a control. Death of target cells was assessed using Sytox Orange nucleic acid dye (Invitrogen). The percentage of DART molecule and CD8+ T cell–mediated killing of HIV-infected targets was calculated by subtracting the percentage of death in cultures incubated with RSV×CD3 from that in cultures incubated with HIV 3BNC117×CD3.
Enrichment of TIGIT+CD8+ and TIGIT−CD8+ T Cells
CD8+ T cells were isolated using a negative cell separation technique (StemCell Technologies). TIGIT+ and TIGIT− cells were further enriched using TIGIT-PE antibody (eBioscience) and anti-PE magnetic beads (StemCell Technologies).
Transcriptome Analysis
Total RNA from TIGIT+CD8+ and TIGIT−CD8+ T cells were isolated using an RNeasy Mini kit (Qiagen), according to the manufacturer’s specifications. First, 100 ng of total RNA was amplified and labeled using GeneChip Whole Transcript (WT) PLUS Reagent Kit (Affymetrix), according to the manufacturer’s instructions. Next, 6 µg of labeled complementary RNA was hybridized to Affymetrix Human Genome WT Array Strip at 48°C for 20 hours. The arrays were washed using the GeneAtlas Hybridization, Wash, and Stain Kit for WT Array Strips. Raw CEL files were obtained from the GeneAtlas Software and were normalized by robust multiarray average. The normalized expression values were batch corrected for array preparation and array identification. Differential expression was performed on batch-corrected expression values, using the Linear Models for Microarray Analysis (LIMMA) package [13]. Preranked gene set enrichment analysis (GSEA) was carried out using the GSEA tool version 3.0 and Kegg pathways from MSigDb software, version 7.1. A heat map for visualization of gene expression and a normalized enrichment score were generated using the heat map.2 function from the R package gplots, version 3.0.1.1.
Statistical Analysis
For 3-group comparisons, a global Kruskal-Wallis test was performed and, if results were significant, it was followed by the Mann-Whitney U test. Correlation coefficients were determined using a 2-tailed Spearman correlation method.
RESULTS
TIGIT and PD-1 Expression on CD8+ T Cells
We first investigated the expression of exhaustion markers on CD8+ T cells of HIV-aviremic (n = 81), HIV-viremic (n = 42), and healthy (n = 74) individuals (Supplementary Table 1). As shown in Figure 1A, frequencies of TIGIT+, PD-1+, and TIGIT+PD-1+CD8+ T cells were significantly higher in HIV-viremic than in HIV-aviremic and healthy individuals. Of note, frequencies of PD-1 on CD8+ T cells of HIV-aviremic and healthy individuals did not differ significantly (Figure 1A). However, frequencies of TIGIT on CD8+ T cells from both HIV groups remained elevated regardless of plasma viremia status when compared to frequencies in healthy individuals, suggesting that the exhaustion markers TIGIT and PD-1 are differentially regulated in HIV infection.
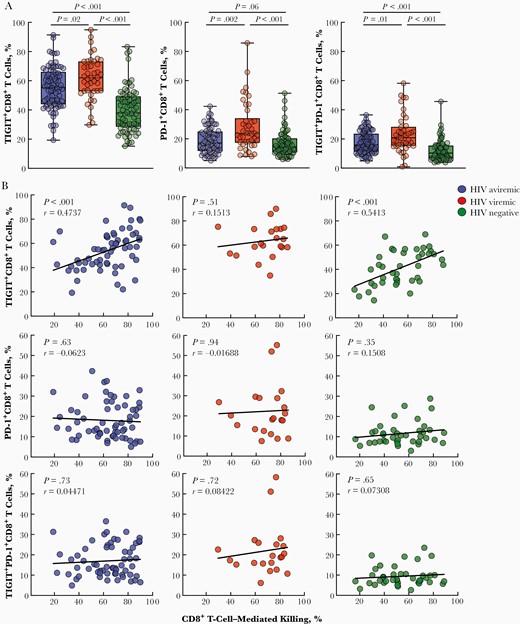
Phenotypic and functional analyses of CD8+ T cells expressing markers of immune exhaustion. A, Peripheral blood mononuclear cells of human immunodeficiency virus (HIV)–infected aviremic (n = 81), HIV-infected viremic (n = 42), and healthy individuals (n = 74) were subjected to flow cytometry to determine the levels of T cell immunoglobulin and ITIM domain (TIGIT)+CD8+, programmed cell death protein 1 (PD-1)+CD8+, and TIGIT+PD-1+CD8+ T cells. Black vertical lines represent minimum to maximum data points; black horizontal lines, interquartile range and median values. P values were determined using the Mann-Whitney test. B, Enriched CD8+ T cells of HIV-infected aviremic (n = 61) and viremic (n = 21) and healthy individuals (n = 40) were cocultured with CEM-IIIB cells in the presence of a HIV-specific dual-affinity retargeting (DART) molecule or a control molecule. The cytotoxic activity of CD8+ T cells was determined by the percentage of dead CEM-IIIB cells, using a nucleic acid dye and flow cytometry. The relationship between the CD8+ T-cell–mediated killing and the level of TIGIT+CD8+, PD-1+CD8+, and TIGIT+PD-1+CD8+ T cells is shown for all study groups. Correlations were determined using the Spearman method.
TIGIT Expression and CD8+ T-Cell–Mediated Cytolytic Activity
It has been shown that TIGIT+CD8+ T cells exhibit impaired cytokine production on antigenic stimulation, but levels of perforin and granzyme B remain higher in TIGIT+CD8+ than in TIGIT−CD8+ T cells [10]. To directly assess the intrinsic CTL capacity of cells expressing TIGIT and/or PD-1, enriched CD8+ T cells were cocultured with CEM-IIIB cells with the HIV 3BNC117×CD3 DART or RSV×CD3 control molecule. Frequencies of TIGIT, but not PD-1 or TIGIT/PD-1, were positively correlated with the degree of DART-mediated CTL activity in HIV-aviremic and healthy individuals but not in HIV-viremic individuals (Figure 1B). Of note, the vast majority of HIV Gag-specific CD8+ T cells (by expression of intracellular cytokines interferon γ, tumor necrosis factor α, and macrophage inflammatory protein 1β or CD107a) were found in the TIGIT+ population (Supplementary Figure 1), further corroborating the above observation. The lack of significant correlation in HIV-viremic individuals suggests that factors other than TIGIT and immune exhaustion may contribute toward the impairment of intrinsic CTL functions during active viral replication.
Distinct Gene Expression Profiles in TIGIT+CD8+ and TIGIT−CD8+ T-Cell Subsets
To further delineate the relationship between TIGIT and CTL activity, we conducted transcriptome analyses of enriched TIGIT+CD8+ versus TIGIT−CD8+ T cells from HIV-aviremic (n = 8), HIV-viremic (n = 6), and healthy (n = 15) individuals (Supplementary Table 2). The principal component analysis and the Venn diagram revealed distinct transcriptional profiles of TIGIT+ versus TIGIT− cells within each study group, and a greater relatedness of such differentially expressed genes between HIV-aviremic and healthy individuals (Figure 2A and 2B). Gene ontology analysis of the 180 differentially expressed genes between the TIGIT+CD8+ and TIGIT−CD8+ T cells common for HIV-aviremic and healthy individuals (Figure 2B) revealed the enrichment of genes in categories involving defense response, innate immune response, cell activation, positive regulation of cytokine production, and immune effector process (Figure 2C).
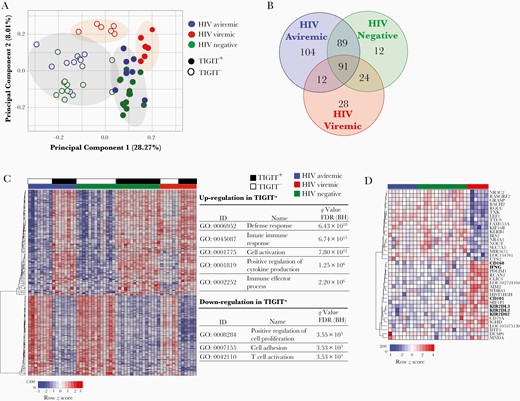
Transcriptome analyses of TIGIT+CD8+ and TIGIT−CD8+ T-cell subsets. Enriched TIGIT+CD8+ and TIGIT−CD8+ T cells from human immunodeficiency virus (HIV)–aviremic (n = 8), HIV-viremic (n = 6), and healthy individuals (n = 15) were subjected to RNA microarray analysis. A, Principal component analysis. B, Venn diagram of genes differentially expressed in TIGIT+CD8+ versus TIGIT−CD8+ T cells of the 3 study groups. Numbers of genes commonly expressed among the study groups are indicated. C, Hierarchically clustered heat map of 180 differentially expressed genes between TIGIT+CD8+ and TIGIT−CD8+ T-cell subsets in HIV-aviremic and healthy individuals. Top categories of gene ontology (GO) analyses are listed. D, Hierarchically clustered heat map of differentially expressed genes in the TIGIT+CD8+ T-cell subsets of HIV-viremic versus HIV-aviremic and healthy individuals. Differences in relative levels of gene expression (z score) are indicated in color, where red indicates up-regulation and blue, down-regulation. Abbreviation: BH, Benjamini-Hochberg; FDR, false discovery rate; ID, identifier.
The genes up-regulated in TIGIT+CD8+ T cells included costimulatory receptor tumor necrosis factor receptor superfamily member 9, cytokine interferon γ, cytotoxic molecules granzyme (GZM)A, GZMH, GZMK, and master transcription factors Eomesodermin (EOMES) and thymocyte selection-associated high mobility group box protein (TOX) (Supplementary Table 3). Certain inhibitory receptors, including PD-1, CTLA-4, CD160, and CD244, were also shown to be up-regulated in the TIGIT+CD8+ T cells. Furthermore, when gene expression profiles in the TIGIT+CD8+ T cells were compared across all 3 study groups, genes encoding inhibitory receptors CD101 and CD160 and killer cell immunoglobulin-like receptors were significantly up-regulated in HIV-viremic individuals compared with the other groups (Figure 2D). These observations provide a plausible explanation for the lack of correlation between the level of TIGIT expression and DART-mediated CTL activity in HIV-viremic individuals.
DISCUSSION
An effective antiviral CD8+ T-cell response requires antigen-specific priming, differentiation into effector cells, trafficking to the site of infection, and elimination of infected targets. However, inefficient control of pathogens, such as HIV in the absence of ART, leads to T-cell exhaustion, in part owing to persistent antigenic exposure [14]. CD8+ T-cell exhaustion may lead to poor health outcomes in HIV-infected individuals. As such, the blockade of 2 major exhaustion pathways, namely, those involving PD-1 and TIGIT, could theoretically restore anti-HIV CD8+ T-cell functions in infected individuals and lead to more effective viral suppression. In the present study, we demonstrated that TIGIT expression was significantly higher on CD8+ T cells from HIV-infected (both aviremic and viremic) compared with healthy individuals; however, the frequencies of TIGIT but not PD-1 were positively correlated with CTL activity in HIV-aviremic and healthy individuals. Although genes associated with antiviral immunity were shown to be up-regulated in TIGIT+CD8+ compared with TIGIT− CD8+ T cells irrespective of plasma viremia, a number of genes encoding inhibitory molecules were up-regulated in TIGIT+CD8+ T cells of HIV-viremic versus HIV-aviremic or healthy individuals.
It has been suggested that TIGIT is a negative modulator of T-cell function, is elevated in HIV infection, and is associated with higher frequencies of HIV-specific T cells [10, 15]. Given the strong correlation between the level of TIGIT expression and the intrinsic cytotoxic activity of CD8+ T cells, our data suggest that TIGIT+CD8+ T cells are capable of killing the intended targets ex vivo in HIV-aviremic and healthy donors. These findings cast doubt on whether all TIGIT+CD8+ T cells are truly immune exhausted and dysfunctional. It is plausible that elevated levels of multiple inhibitory receptors on the TIGIT+CD8+ T cells of HIV-viremic individuals could potentially diminish the capacity of CTLs to effectively eliminate infected targets in vivo. Although our DART molecule-mediated CTL assay may not fully recapitulate physiologically relevant conditions (such as the involvement of inhibitory receptor ligands and/or antigen-specific major histocompatibility complex I–T-cell receptor interactions), it enables us to measure the intrinsic and direct cytolytic capacity of CD8+ T-cell subsets in a highly consistent manner. In addition, we further demonstrated that the vast majority of HIV Gag-specific CD8+ T cells reside within the TIGIT+ subset, corroborating the above observation.
Collectively, our data clearly suggest that subsets of TIGIT+CD8+ T cells, especially those lacking the expression of certain inhibitory receptors, do not represent a state of immune exhaustion and maintain an intrinsic capacity to kill targets in HIV-infected individuals in the absence of active viral replication. Comprehensive evaluation of other immune exhaustion markers and inhibitory receptors, as well as an examination of HIV epitopes in the setting of active viral replication, may shed light on potential mechanisms responsible for the impairment of antiviral CD8+ T cells and lead to new therapeutic strategies for treating infected individuals.
Supplementary Data
Supplementary materials are available at The Journal of Infectious Diseases online. Consisting of data provided by the authors to benefit the reader, the posted materials are not copyedited and are the sole responsibility of the authors, so questions or comments should be addressed to the corresponding author.
Notes
Acknowledgments. We are grateful to the study volunteers for their participation in this study. We thank the National Institute of Allergy and Infectious Diseases HIV Outpatient Clinic staff for their assistance in the execution of this study.
Financial support. This research was supported by the Intramural Research Program of the National Institute of Allergy and Infectious Diseases, National Institutes of Health.
Potential conflicts of interest. J. L. N. is a full-time employee of MacroGenics and owner of the company’s stock. All other authors report no potential conflicts. All authors have submitted the ICMJE Form for Disclosure of Potential Conflicts of Interest. Conflicts that the editors consider relevant to the content of the manuscript have been disclosed.
References
Author notes
J. B. and E. D. H. contributed equally to this work.

