


Abstract
Precise and cost-efficient human immunodeficiency virus (HIV) incidence and drug resistance surveillances are in high demand for the advancement of the 90-90-90 “treatment for all” target.
We developed microdrop HIV sequencing for the HIV incidence and drug resistance assay (HIDA), a single-blood-draw surveillance tool for incidence and drug resistance mutation (DRM) detection. We amplified full-length HIV envelope and pol gene sequences within microdroplets, and this compartmental amplification with long-read high-throughput sequencing enabled us to recover multiple unique sequences.
We achieved greater precision in determining the stage of infection than current incidence assays, with a 1.2% false recency rate (proportion of misclassified chronic infections) and a 262-day mean duration of recent infection (average time span of recent infection classification) from 83 recently infected and 81 chronically infected individuals. Microdrop HIV sequencing demonstrated an increased capacity to detect minority variants and linked DRMs. By screening all 93 World Health Organization surveillance DRMs, we detected 6 pretreatment drug resistance mutations with 2.6%–13.2% prevalence and cross-linked mutations.
HIDA with microdrop HIV sequencing may promote global HIV real-time surveillance by serving as a precise and high-throughput cross-sectional survey tool that can be generalized for surveillance of other pathogens.
Real-time monitoring of the current human immunodeficiency virus (HIV) spread and drug resistance mutations (DRMs) is one of the major challenges to achieving the UNAIDS 90-90-90 goal [1]. The current recommendation by the World Health Organization (WHO) for incidence surveillance is the recent infection testing algorithm which showed a <1% false recency rate (FRR; the proportion of chronically infected individuals misclassified as recently infected) [2–4]. However, the mean duration of recent infection (MDRI; the average time span in which persons are classified as recently infected) [5] remains relatively low and highly variable depending on HIV subtype [2, 3, 6], negating the precision of HIV incidence estimates from cross-sectional surveys.
Genomic HIV incidence assays have shown great promise in precise incidence determination [5, 7–9], but there are still limitations. Genomic assays detect the presence of similar sequences within circulating HIV strains as a signature of recent infection. The optimal assay involves single-genome amplification (SGA), followed by Sanger sequencing [9, 10]. However, SGA is labor intensive and high in cost, requiring multiple polymerase chain reaction (PCR) replicates with end-point limit dilutions. Therefore, developing a streamlined and cost-effective workflow for full-length envelope gene sequencing is pivotal for the routine use of genomic incidence surveillances.
Genomic incidence screening can be combined with HIV drug resistance surveillance. Integrase strand transfer inhibitor (INSTI)–based treatment efficacy over 144 weeks was reported to be <80% [11]. One of the main causes for antiretroviral therapy (ART) failure is the development of DRMs [12, 13], and the current standard of DRM detection is population sequencing [14]. However, this method cannot detect minority variants that constitute less than about 20% of the total viral population [15]. To detect minority variants, short-read deep sequencing methods have been proposed [16]. However, we cannot detect linked mutations using these approaches, because they fail to probe for multiple mutations across different drug classes present in a single virus. These linked, cross-class DRMs increase the risk of treatment failure in combination therapy.
Herein, we describe a single-blood-draw genomic assay that we devised, the HIV incidence and drug resistance assay (HIDA), for simultaneous screening of HIV incidence and DRMs with both high precision and low cost. This assay produces full-length HIV envelope and pol gene sequences using a newly developed technique, microdrop HIV sequencing.
METHODS
HIV RNA Extraction and Complementary DNA Synthesis
HIV RNA was extracted from plasma specimens using a MagMAX-96 Viral RNA Isolation Kit (Thermo Fisher Scientific). The extracted HIV RNA was then subjected to complementary DNA (cDNA) synthesis using unique molecular identifier (UMI) primers [17–23]. cDNA synthesis with UMI-tagging was carried out, following published procedures with minor modifications [20].
Microdrop Sequencing
UMI-tagged HIV cDNA, PCR mix, and PicoSurf-1 oil (Sphere Fluidics) were loaded into the QX200 Droplet Generator (BioRad) for droplet generation. The droplets were then PCR cycled, broken with perfluoro-N-octane (Sigma Aldrich), purified with Ampure XP beads (Beckman Coulter), and then subjected to index droplet PCR. After amplification, the droplets were again broken, and product bands were confirmed by means of 1% agarose gel electrophoresis. We pooled equimolar amounts of each specimen, accounting for differences in amplicon size between envelope and pol sequences. This final pooled library was sequenced by long-read, single-molecule, real-time (SMRT) sequencing on the PacBio Sequel II system (PacBio) using a SMRT cell 8M [24, 25].
Bulk PCR
To compare microdrop sequencing using conventional bulk PCR methods, we amplified a subset of specimens with a bulk PCR method. The bulk PCR used the same PCR mix and cycle conditions as the microdrop amplification described above, except without the droplet generation step. This bulk PCR method was also used to recover specimens that did not successfully amplify target bands via microdrop sequencing, with a minimum of 3 replicates.
Consensus Sequence Construction
Full-length envelope and pol gene reads were demultiplexed based on their index sequences, creating one FASTA file for each specimen’s envelope gene reads and another for pol gene reads. The UMI region was then identified by aligning each read with the specimen’s PCR primers, using a dynamic programming algorithm in the Python pairwise2 module. The consensus sequence of the reads sharing the same UMI was then obtained. The set of consensus sequences was then aligned and trimmed, producing either full-length envelope gene (HXB2 6225–8795) or pol gene (HXB2 2085–5096) sequences. The obtained envelope and pol gene sequences are available in the GenBank database (accession nos. MW188677-MW189821 and MW189822-MW190060).
DRM Profiling
Each specimen’s pol gene consensus sequences in FASTA format were converted to a JavaScript Object Notation format, and this file was submitted to the Stanford University HIV Drug Resistance Database (hivdb.stanford.edu), using the database’s Sierra Web Service 2. The output from the Stanford database was then processed to obtain all DRMs from each of pol gene sequence.
pol Gene Sanger Sequencing
Five HIV specimens’ full-length pol gene sequences were obtained by means of SGA and Sanger sequencing [5], which are available in the GenBank database (accession nos. MW190061-MW190073). cDNA from specimens 1430, 1133, 1599, 9544, and 4241 was diluted to approximate the SGA condition and PCR cycled. After the PCR product was Ampure cleaned and diluted to 6 ng/μL, 10 μL of that dilution and 5 μL of each of 7 Sanger sequencing primers (5 μmol/L) were subjected to Sanger sequencing. More detailed methods are provided in the Supplementary Materials.
RESULTS
Microdrop HIV Sequencing
We developed microdrop HIV sequencing by combining droplet technologies [26, 27] and long-read sequencing [24, 25] to obtain full-length envelope and pol gene sequences for precise incidence and drug resistance surveillance. Importantly, microdrop sequencing looks to overcome the drawbacks of antecedent methods such as bulk PCR and SGA, in which the former is prone to unequal template amplification and template recombination [28] while the latter is more precise, yet expensive and labor intensive [10, 28]. To approximate a SGA setting in an efficient manner, we specifically turned to droplet technology, which uses around 20 000 microreactors to isolate templates before amplification. PCR in droplet has proved effective in reducing PCR bias [26] and limiting chimeric recombination [27, 29]. Short-read droplet digital PCR [30] has achieved improved accuracy for the quantification of cell-associated HIV DNA [31, 32]. Furthermore, droplet technologies have been used for the barcoding and amplification of DNA libraries for short-read deep sequencing [33, 34]. We further optimized droplet techniques to sequence multiple full-length envelope and pol gene templates.
Microdrop HIV sequencing is the first method to amplify long-read templates >3000 bases long in droplet and directly sequence those in a high-throughput manner. As depicted in Figure 1A, extracted HIV RNA is subject to cDNA synthesis, where each unique envelope and pol gene sequence is tagged by a UMI to reduce PCR and sequencing errors and recombination artifacts [17–23]. UMI-tagged envelope and pol gene cDNAs are then separately amplified within microdroplets for incidence and drug resistance screening, respectively. Droplets are then broken, and multiple unique envelope and pol gene sequences are recovered (Figure 1A).
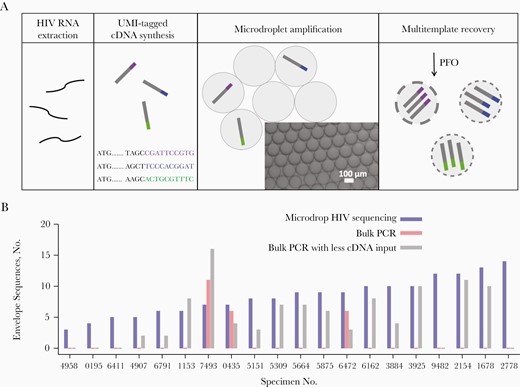
Microdrop human immunodeficiency virus (HIV) sequencing. A, HIV RNA is extracted from plasma specimens of HIV-positive individuals, from which unique molecular identifier (UMI)–tagged complementary DNA (cDNA) is synthesized. Three distinct UMIs are shown in purple, blue, and green. The UMI-tagged HIV cDNA templates are compartmentalized and amplified within droplets. These amplified full-length HIV envelope or pol gene templates are then recovered from the droplets by the addition of perfluoro-N-octane (PFO) for downstream long-read, high-throughput sequencing. B, Comparisons of HIV full-length envelope gene sequence recovery between microdrop sequencing, bulk polymerase chain reaction (PCR), and bulk PCR with less cDNA input across 20 Consortium for the Evaluation and Performance of HIV Incidence Assays (CEPHIA) specimens (Supplementary Tables 1 and 2). Microdrop sequencing produced 3–14 envelope sequences from all 20 specimens. However, conventional bulk PCR produced envelope sequences from only 3 specimens, 7439, 0435, and 6472. In addition, microdrop sequencing produced a greater number of unique sequences than bulk PCR, on average (8.4 vs 1.2; P < .001). Even when the UMI–tagged cDNA input was reduced, the average number of unique sequences obtained from microdrop sequencing was greater than that obtained from bulk PCR (8.4 vs 5.1; P = .01). Color version of this figure is available at Journal of Infectious Diseases online.
We then use high-throughput long-read sequencing [24, 25], yielding about 2.5 million full-length HIV envelope and pol gene reads from a single run, with about 99.9% accuracy. The generated reads are demultiplexed, and each specimen’s unique HIV envelope and pol gene sequences are obtained by building consensus sequences from a minimum of 25 reads that share the same UMI. This process of building consensus sequences allows us to (1) count unique HIV envelope and pol gene templates obtained from each specimen and (2) correct residual PCR and sequencing errors, further increasing read accuracy [35].
To test the effectiveness of droplet compartmentalization, we compared our microdrop sequencing to bulk PCR using 20 Consortium for the Evaluation and Performance of HIV Incidence Assays (CEPHIA) specimens (Figure 1B). While microdrop sequencing produced full-length envelope gene sequences from all 20 specimens, conventional bulk PCR produced envelope sequences from only three. Microdrop sequencing also produced a greater number of unique sequences than bulk PCR (8.4 vs 1.2, respectively; P < .001). When we decreased the input of UMI-tagged cDNA 7.25-fold to increase PCR efficiency, the average number of unique sequences was still smaller than that of microdrop sequencing (5.1 vs 8.4, respectively, P = .01). These results clearly demonstrate that microdrop sequencing is effective for recovering multiple unique templates from a single reaction.
Study Cohort
We used the standard CEPHIA panel (Supplementary Tables 1 and 2) [36]. The panel consisted of 83 incident-infection and 81 chronic-infection specimens obtained from ART-naive individuals. All incident-infection specimens were reported to either (1) have a documented infection of <1 year at the time of specimen collection from HIV positive and negative test results or (2) have a Fiebig stage between I and V+. All chronic-infection specimens were reported to have a documented HIV infection for >1 year. Geographic location, subtype, sex, men who have sex with men (MSM) designation, race/ethnicity, age, viral load, and CD4 T-cell count distributions of the incident and chronic infection groups are compared in Figure 2.
![Consortium for the Evaluation and Performance of HIV Incidence Assays (CEPHIA) incident- and chronic-infection specimens. A, Geographic distribution of 83 incident-infection and 81 chronic-infection specimens. Shown in dark gray, incident-infection specimens were collected from North America (United States), South America (Brazil), and Africa (Kenya, Rwanda, and South Africa) and chronic-infection specimens were collected from North America (United States) and Africa (Rwanda, South Africa, and Uganda). The proportions of incident- and chronic-infection specimens from each continent are represented by red and blue bars, respectively. B, Human immunodeficiency (HIV) subtype and host factor profiles of incident-infection (left bars) and chronic-infection (right bars) specimens. Specimen subtype distributions—by sex/sexual behavior (female [F], men who have sex with men (MSM), or male [M] [non-MSM]), race/ethnicity, age, viral load (in HIV RNA copies/mL), and CD4 T-cell count— were compared between the incident and chronic infection groups. Color version of this figure is available at Journal of Infectious Diseases online.](https://oup.silverchair-cdn.com/oup/backfile/Content_public/Journal/jid/224/6/10.1093_infdis_jiab060/1/m_jiab060f0002.jpeg?Expires=1749861876&Signature=z4yfd89ctdUtZz3rpRsHaUOpbouQb5SjQmJM2i03f64ZoAdxqU~gupNcaWmkNfiyxNicf135p6hSxi64WN9M83wz4xeOu7D1ybnYDV1~0rOGoN8HwLX0qBO-wSTTjO2~gSHI3mIU0x3v8zNygcFPmFiwQecRRU2xwt6V0T2HTx2GZmd24l6MUHXP6dRdEVyoIkEyVjbJMY3Nlrgu1x7phAh9Ou52fhS-UiZx7R2mJ5-o2Wdk1AP8WE4N5mrPaxL~hFsp6wQSsTRV6hrHIMU5JoM-GEGRlQUg19LcGSJXw-AW8TR86ZXz9TbAE3ry-DIbV6zhpSMVA3sn-zO1woFkgg__&Key-Pair-Id=APKAIE5G5CRDK6RD3PGA)
Consortium for the Evaluation and Performance of HIV Incidence Assays (CEPHIA) incident- and chronic-infection specimens. A, Geographic distribution of 83 incident-infection and 81 chronic-infection specimens. Shown in dark gray, incident-infection specimens were collected from North America (United States), South America (Brazil), and Africa (Kenya, Rwanda, and South Africa) and chronic-infection specimens were collected from North America (United States) and Africa (Rwanda, South Africa, and Uganda). The proportions of incident- and chronic-infection specimens from each continent are represented by red and blue bars, respectively. B, Human immunodeficiency (HIV) subtype and host factor profiles of incident-infection (left bars) and chronic-infection (right bars) specimens. Specimen subtype distributions—by sex/sexual behavior (female [F], men who have sex with men (MSM), or male [M] [non-MSM]), race/ethnicity, age, viral load (in HIV RNA copies/mL), and CD4 T-cell count— were compared between the incident and chronic infection groups. Color version of this figure is available at Journal of Infectious Diseases online.
Incidence Testing
HIDA classifies incident- and chronic-infection specimens using each individual’s full-length envelope gene sequences obtained via microdrop sequencing. To properly identify the recent infection signature—the presence of similar sequences within each founder—from both single and multiple founder infections, we chose the genome similarity index (GSI; proportion of similar sequence pairs) as an incidence biomarker, as described elsewhere [8, 9]. In addition, we introduced single lineage distance (SLD), the average number of nucleotide differences (Hamming distance [HD]) among sequence pairs whose distance was less than the threshold, or HD cutoff. Here, sequence pairs with HDs greater than this threshold were excluded when SLD was estimated because, at the early stage of infection, those would likely be originating from different founder viruses. Figure 3A shows the HD profile of an incident-infection specimen, 2778. While multiple founders within this specimen led to a high average HD of 238, the recent infection signature was discerned by a SLD of 6 and GSI of 0.24. Thus the incidence biomarkers, SLD and GSI, minimized the chances of misclassifying an incident infection with multiple founders as a chronic infection.
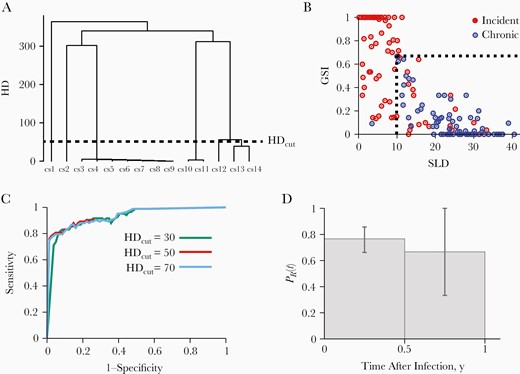
Incidence testing with the human immunodeficiency virus (HIV) incidence and drug resistance assay. A, Fourteen full-length envelope gene sequences (denoted as cs1 (consensus sequence 1), cs2, etc.) obtained from specimen 2778 were aligned. The single lineage distance (SLD) was measured to be 6, which is determined by the average HD among 31 sequence pairs with HD below the HD cutoff (HDcut). SLD denotes the average HD between sequences from the same founder lineage. Individuals with recent infections have a relatively low SLD, and those with chronic infections a relatively high SLD, reflecting viral diversification over the course of infection. B, SLDs and genome similarity indexes (GSIs) of 83 incident-infection (red) and 81 chronic-infection (blue) specimens from the Consortium for the Evaluation and Performance of HIV Incidence Assays (CEPHIA) panel. GSI is a measurement of genome similarity,; individuals with recent infections would have relatively high GSIs, and those with chronic infections relatively low GSIs, reflective of viral diversification over the course of infection. All chronic-infection specimens except 1 were clustered within the region of high SLD and low GSI ( and ), as marked by dotted lines. In contrast, most incident-infection specimens were located outside this region ( or ). C, Receiver operating characteristic curves for HDcut values of 30 (green), 50 (red), and 70 (blue), with and . The area under the curve was maximal (0.94) at an HDcut of 50. D, Probability of being recent, , in the first and second half-year bins of 83 incident-infection specimens. The probability of being recent was estimated as the proportion of incident-infection specimens that we classified as incident infection in each bin. The 95% confidence interval was obtained by resampling specimens with replacement. Color version of this figure is available at Journal of Infectious Diseases online.
We obtained a total of 1151 full-length envelope gene sequences from 83 incident-infection and 81 chronic-infection specimens from the CEPHIA panel (Supplementary Tables 1 and 2). We assessed the FRR and mean duration of recent infection (MDRI), 2 standard metrics for incidence assay performance testing. All but 1 chronic-infection specimen clustered at the high SLD and low GSI region, while most incident-infection specimens were located outside of this region (Figure 3B). We thus classified a specimen as chronic infection when its SLD was greater than and GSI was less than . These threshold values, and , were set to 9.9 and 0.67 by minimizing the proportion of misclassified specimens with <2% of FRR. The receiver operating characteristic analysis showed that the area under the receiver operating characteristic curve was maximal (0.94) at an HD cutoff of 50 (Figure 3C). With these threshold values, we were able to correctly classify 80 of the 81 chronic-infection specimens (Figure 3B), yielding an FRR of 1.2% [0.0%–3.7%]. The 95% confidence interval was obtained by resampling specimens with replacement. This FRR was close to the optimal performance standard of <1% FRR [37]. While all 37 subtype C chronic-infection specimens were correctly classified (FRR, 0%), 1 of the 44 subtype B chronic-infection specimens was misclassified as incident infection, yielding an FRR of 2.3% [0.0%–6.8%].
To estimate the MDRI, we first assigned each of the 83 incident-infection specimens to a half-year bin using the midpoint of their infection time interval. We then obtained the probability of being recent, , approximated by the proportion of specimens in each bin that we classified as incident infection. Figure 3D plots in the first and second half-year bins and from the definition of MDRI, . Here T is the cutoff between incident and chronic infections, chosen as one year. Accordingly, our assay’s MDRI was estimated to be 262 [189–327] days with T = 1 year. The MDRI of the 45 subtype B specimens was estimated to be 262 [187–328] days, which was comparable to that of the subtype C specimens, 279 [231–327] days. Overall, this MDRI was greater than that of the currently available serologic incidence assays [2, 3, 6], indicating HIDA’s capacity for precise incidence screening.
We investigated associations of incidence biomarkers with host factors. As shown in Figure 4A and 4B, SLD and GSI were comparable between subtype B and C specimens. Likewise, the SLD and GSI for incident- and chronic-infection specimens were not sensitive to sex (Figure 4C and 4D). In addition, the 2 biomarkers for chronic-infection specimens were not sensitive to sexual behavior (Figure 4C and 4D). However, we observed a smaller GSI in incident-infection specimens from MSM than in those from other men or from women, which is likely due to a higher chance of multiple variant transmission among MSM (Figure 4C and 4D) [38]. Incident-infection specimens from black donors showed a smaller SLD (P = .004) and greater GSI (P = .008), than those from Asian, Hispanic, and white donors. Incident-infection specimens from black donors were mostly from non-MSM male and female donors.
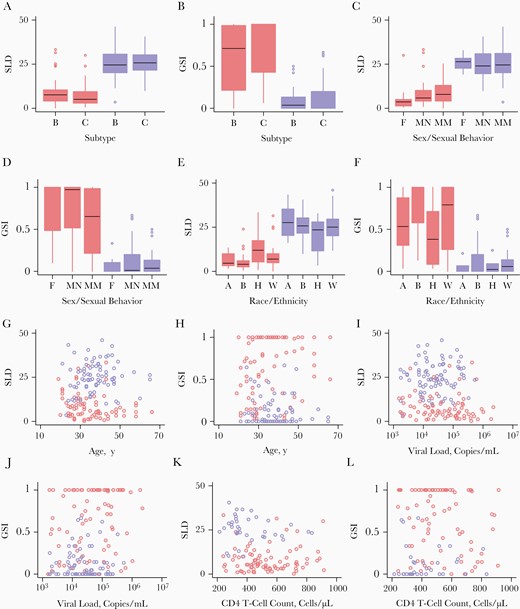
Incidence biomarkers and host factors. A, B, Single lineage distances (SLDs) (A) and genome similarity indexes (GSIs) (B) among incident-infection (red) and chronic-infection (blue) specimens, comparing subtypes B and C. A, Among incident-infection specimen, the SLDs of 45 subtype B specimens were comparable to those of 38 subtype C specimens (P = .23), and among chronic-infection specimens, the SLDs of 44 subtype B specimens were comparable to those of 37 subtype C specimens (P = .89). B, GSIs did not differ significantly between subtypes B and C among either incident-infection (P = .13) or chronic-infection (P = .18) specimens. C, D, SLDs (C) and GSIs (D) of specimens from female (F) donors and from male donors, including men who have sex with men (MSM) (MM), and non-MSM (MN). C, Among incident-infection specimens (red), SLDs did not differ significantly between 14 specimens from female (F) and 69 from male (MN or MM) donors (P = .10), or between 46 specimens from MSM (MM) or 37 from other donors (F or NM) (P = .51). Among chronic-infection specimens (blue), SLDs were comparable between 11 specimens from female and 70 from male (both MM and NM) donors (P = .69), and also between 40 specimens from MSM (MM) and 41 from other donors (F or NM) (P = .89). D, For both incident-infection and chronic-infection specimens, GSIs did not differ significantly between specimens from female and those from male donor groups (P = .21 and P = .56, respectively). For incident-infection specimens, GSIs did differ significantly between MSM and all other donors (F and MN) (P = .045), but chronic-infection specimens did not (P = .32). E, F, SLDs (E) and GSIs (F) of incident-infection (red) and chronic-infection (blue) specimens by donor race/ethnicity. E, SLDs of specimens from 13 Asian (A), 64 black (B), 24 Hispanic (H), and 60 white (W) donors. SLDs were significantly associated with race/ethnicity for incident-infection specimens (P = .004) but not for chronic-infection specimens (P = .43). F, GSIs were significantly associated with race/ethnicity for incident-infection specimens (P = .008), but not for chronic-infection specimens (P = .49). G, H, SLDs (G) and GSIs (H) for incident-infection (red) and chronic-infection (blue) specimens by donor age. G, SLDs were not associated with age for either incident-infection (r = −0.39; P = .08) or chronic-infection (r = 0.077; P = .50) specimens. H, GSIs were associated with age for incident-infection (r = 0.22; P = .045) but not for chronic-infection (r = −0.078; P = .49) specimens. I, J, SLDs (I) and GSIs (J) for incident-infection (red) and chronic-infection (blue) specimens by donor viral load. I, SLDs were not correlated with viral load for either incident-infection (r = −0.078; P = .49) or chronic-infection (r = 0.032; P = .78) specimens. J, GSIs were not correlated with viral load for either incident-infection (r = 0.086; P = .44) or chronic-infection (r = 0.024; P = .83) specimens. K, L, SLDs (K) and GSIs (L) for incident-infection (red) and chronic-infection (blue) specimens by CD4 T-cell count. K, SLDs were not correlated with CD4 T-cell count for either incident-infection (r = 0.063; P = .57) or chronic-infection (r = −0.28; P = .08) specimens. L, GSIs were not associated with CD4 T-cell count for either incident-infection (r = −0.15; P = .18) or chronic-infection (r = 0.14; P = .39) specimens. Color version of this figure is available at Journal of Infectious Diseases online.
Age was not associated with SLD as shown in Figure 4G. The GSI for incident-infection specimens was correlated with age but that for chronic-infection specimens was not (Figure 4H). The SLD and GI for incident- and chronic-infection specimens were correlated with neither viral load (Figure 4I and 4J) nor CD4 T-cell count (Figure 4K and 4L). The SLD and GSI of incident-infection specimens were correlated with Fiebig stage (Supplementary Figure 1). This is expected, because SLD would increase (and GSI decrease) as Fiebig stage increases with time since infection. Taken together, these incidence biomarkers were not sensitive to HIV subtype, sex, age, viral load, or CD4 T-cell count, but they were associated with sexual behavior, race/ethnicity, and Fiebig stage.
We next examined whether the number of unique envelope gene sequences was associated with the chance of infection stage misclassification. As shown in Supplementary Figure 2, the number of envelope sequences within the group of specimens that were correctly classified as incident or chronic infection did not differ with that within the group of specimens that were misclassified (Wilcoxon test, P = .35). The rate of infection stage misclassification was 12.7% when the number of sequences was <10, which was comparable to 13.2% when the number of sequences was ≥10. Therefore, the number of unique envelope gene sequences was not a significant factor associated with HIDA’s incidence screening resolution.
DRM Screening
HIDA screens resistance mutations to 24 drugs from full-length pol gene sequences, which includes all 12 drugs of the current first-, second-, and third-line ART regimens for children and adults. We screened DRMs of 38 ART-naive specimens from the CEPHIA panel, as listed in Table 1. Microdrop sequencing produced multiple full-length pol gene sequences from all but 1 specimen (specimen 2164), with a minimum detection limit of 7.7% (Table 1). These full-length pol gene sequences were submitted to the Stanford University HIV Drug Resistance Database. Pretreatment DRM (PDR) prevalence, the proportion of individuals that have ≥1 surveillance DRM (SDRM), was measured to be 26.3% [12.3%–40.3%] among 38 ART-naive individuals (Figure 5A). We identified 3 protease inhibitor (PI) and 3 nonnucleoside reverse-transcriptase inhibitor (NNRTI) SDRMs (Figure 5B). We did not detect any nucleoside reverse-transcriptase inhibitor (NRTI) or INSTI SDRMs but detected INSTI accessory resistance mutations, Q95K with 2.6% [0%–7.7%] prevalence and T97A with a 5.3% [0%–12.4%] prevalence.
![Drug resistance screening with the human immunodeficiency virus (HIV) incidence and drug resistance assay (HIDA). A, Ten of the 38 treatment-naive Consortium for the Evaluation and Performance of HIV Incidence Assays (CEPHIA) specimens showed ≥1 or more surveillance drug resistance mutations (SDRMs), yielding a pretreatment drug resistance mutation (PDR) prevalence of 26.3% [12.3%–40.3%]. The PDR prevalence was 23.7% for the protease inhibitor (PI) group, and 21.1% for the nonnucleoside reverse-transcriptase inhibitor (NNRTI) group and 0% for both nucleoside reverse-transcriptase inhibitor (NRTI) and integrase strand transfer inhibitor (INSTI) groups. B, We detected 6 different SDRMs from the 38 specimens, and the prevalence of L90M and Y181C was highest at 13.2% (2.4%–23.9%). C, Predicted prevalence of high-level (red), intermediate-level (orange), and low-level (purple) resistance to each of 24 drugs screened. Abbreviations: 3TC, lamivudine; ABC, abacavir; ATV/r, atazanavir/ritonavir; AZT, azidothymidine; BIC, bictegravir; D4T, stavudine; DDI, didanosine; DOR, doravirine; DRV/r, darunavir/ritonavir; DTG, dolutegravir; EFV, efavirenz; ETR, etravirine; EVG, elvitegravir; FPV/r, fosamprenavir/ritonavir; FTC, emtricitabine; IDV/r, indinavir/ritonavir; LPV/r, lopinavir/ritonavir; NFV, nelfinavir; NVP, nevirapine; RAL, raltegravir; RPV, rilpivirine; SQV/r, saquinavir/ritonavir; TDF, tenofovir disoproxil fumarate; TPV/r, tipranavir/ritonavir. Color version of this figure is available at Journal of Infectious Diseases online.](https://oup.silverchair-cdn.com/oup/backfile/Content_public/Journal/jid/224/6/10.1093_infdis_jiab060/1/m_jiab060f0005.jpeg?Expires=1749861876&Signature=P5elzH9JQ6hWRv3R29lgqNAdXFAV8JtaZCPthQ6iAddG~XIKQl5iMO3uROwd49uZGk6rosMNrfcPGqB7af57KRAR36344E-N9EZfs~y0WP5f3JpLEJ2h3ZyFZDIm42toz8KPAVjNyc2Bup~rhaJZniq8xhDvMtBMFlxjNjtFnCfw89C4y24QGnW3bJcSUtHXnkOvMr~GrN-63QHOiuqDNUoZOjQGJFub3bjaxtnR3s8SU~en7oks~uHSa90shb3Zy0rPoLRhXbaOJo-ZovzBvyfHAIWQ7rS4B9hC6e81ljZGNiZKXnw948D3qot~kRz52kgLHwepqEUtvNEpgfHdAw__&Key-Pair-Id=APKAIE5G5CRDK6RD3PGA)
Drug resistance screening with the human immunodeficiency virus (HIV) incidence and drug resistance assay (HIDA). A, Ten of the 38 treatment-naive Consortium for the Evaluation and Performance of HIV Incidence Assays (CEPHIA) specimens showed ≥1 or more surveillance drug resistance mutations (SDRMs), yielding a pretreatment drug resistance mutation (PDR) prevalence of 26.3% [12.3%–40.3%]. The PDR prevalence was 23.7% for the protease inhibitor (PI) group, and 21.1% for the nonnucleoside reverse-transcriptase inhibitor (NNRTI) group and 0% for both nucleoside reverse-transcriptase inhibitor (NRTI) and integrase strand transfer inhibitor (INSTI) groups. B, We detected 6 different SDRMs from the 38 specimens, and the prevalence of L90M and Y181C was highest at 13.2% (2.4%–23.9%). C, Predicted prevalence of high-level (red), intermediate-level (orange), and low-level (purple) resistance to each of 24 drugs screened. Abbreviations: 3TC, lamivudine; ABC, abacavir; ATV/r, atazanavir/ritonavir; AZT, azidothymidine; BIC, bictegravir; D4T, stavudine; DDI, didanosine; DOR, doravirine; DRV/r, darunavir/ritonavir; DTG, dolutegravir; EFV, efavirenz; ETR, etravirine; EVG, elvitegravir; FPV/r, fosamprenavir/ritonavir; FTC, emtricitabine; IDV/r, indinavir/ritonavir; LPV/r, lopinavir/ritonavir; NFV, nelfinavir; NVP, nevirapine; RAL, raltegravir; RPV, rilpivirine; SQV/r, saquinavir/ritonavir; TDF, tenofovir disoproxil fumarate; TPV/r, tipranavir/ritonavir. Color version of this figure is available at Journal of Infectious Diseases online.
Microdrop HIV sequencing revealed cross-class DRMs linked in a single virus. Seven of the 38 specimens we examined had cross-class linked DRMs. As presented in Table 1, all 6 pol gene sequences from specimen 1430 had L90M (PI) and Y181C (NNRTI) mutations. One of the 9 sequences from specimen 4675 had M46I (PI) and G180E (NNRTI) mutations (Table 1).
Table 1 detailed the drugs that each of the 38 specimens are resistant to, along with its resistance level. Here, each specimen’s predicted drug resistance level was determined by the highest level of resistance. For example, 1 of the 10 reads from specimen 1133 predicted high-level resistance to rilpivirine (RPV) and 2 of the 10 reads predicted low-level resistance to RPV. Accordingly, specimen 1133 was annotated to have high-level resistance to RPV at a 10% detection limit. These individual-level drug resistance profiles can be used at the point of care for treatment regimen selection.
Figure 5C showed the predicted drug resistance prevalence of 24 drugs at high, intermediate, and low resistance levels at the population level. The proportion of specimens with high resistance to nevirapine was greatest among all 24 drugs, at 21.1%. We did not observe any resistance to the 7 drugs in the NRTI group, including emtricitabine and lamivudine. In the INSTI group, only potential low-level resistance to elvitegravir and raltegravir was detected (Table 1).
Individual-Level Surveillance Drug Resistance Mutations and Predicted Drug Resistancea
| Specimens | SDRMs | Resistance to Drug | No. of Sequences (Detection Limit, %) | No. of Sequences with Linked SDRMs |
|---|---|---|---|---|
| 1133 | PI: L90M; NRTI: none; NNRTI: Y181C; INTSI: none | PI: NFV(h), IDV/r(i), SQV/r(i), FPV/r(l), LPV/r(l), and ATV/r(l); NRTI: none; NNRTI: NVP(h), RPV(h), EFV(i), ETR(i), and DOR(i); INSTI: RAL(p) and EVG(p) | 10 (10.0) | 1: L90M (PI) and Y181C (NNRTI) |
| 4675 | PI: M46I; NRTI: none; NNRTI: G190E; INTSI: none | PI: NFV(i), IDV/r(p), FPV/r(p), LPV/r(p), SQV/r(p), and ATV/r(p); NRTI: none; NNRTI: EFV(h), RPV(h), DOR(h), NVP(h), and ETR(i); INSTI: none | 9 (11.1) | 1: M46I (PI) and G180E (NNRTI) |
| 1430 | PI: L90M; NRTI: none; NNRTI: Y181C; INTSI: none | PI: NFV(h), IDV/r(i), SQV/r(i), FPV/r(l), LPV/r(l), and ATV/r(l); NRTI: none; NNRTI: NVP(h), RPV(h), EFV(i), ETR(i), and DOR(i); INSTI: none | 6 (16.7) | 6: L90M (PI) and Y181C (NNRTI) |
| 4241 | PI: L90M; NRTI: none; NNRTI: Y181C; INTSI: none | PI: NFV(h), IDV/r(i), SQV/r(i), FPV/r(l), LPV/r(l), and ATV/r(l); NRTI: none; NNRTI: NVP(h), RPV(h), EFV(i), ETR(i), and DOR(i); INSTI: none | 7 (14.3) | 2: L90M (PI) and Y181C (NNRTI) |
| 1599 | PI: L90M; NRTI: none; NNRTI: Y181C; INTSI: none | PI: NFV(h), IDV/r(i), SQV/r(i), FPV/r(l), LPV/r(l), and ATV/r(l); NRTI: none; NNRTI: NVP(h), RPV(h), EFV(i), ETR(i), and DOR(i); INSTI: none | 5 (20.0) | 2: L90M (PI) and Y181C (NNRTI) |
| 9544 | PI: M46I; NRTI: none; NNRTI: G190E; INTSI: none | PI: NFV(i), IDV/r(p), FPV/r(p), LPV/r(p), SQV/r(p), and ATV/r(p); NRTI: none; NNRTI: EFV(h), RPV(h), DOR(h), NVP(h), and ETR(i); INSTI: none | 2 (50.0) | 1: M46I (PI) and G190E (NNRTI) |
| 1153 | PI: L90M; NRTI: none; NNRTI: Y181C; INTSI: none | PI: NFV(h), IDV/r(i), SQV/r(i), FPV/r(l), LPV/r(l), and ATV/r(l); NRTI: none; NNRTI: NVP(h), RPV(h), EFV(i), ETR(i), and DOR(i); INSTI: none | 10 (10.0) | 1: L90M (PI) and Y181C (NNRTI) |
| 8499 | PI: I47V; NRTI: none; NNRTI: none; INTSI: none | PI: FPV/r(i), TPV/r(i), IDV/r(l), LPV/r(l), NFV(l), DRV/r(p), and ATV/r(p); NRTI: none; NNRTI: none; INSTI: none | 8 (12.5) | none |
| 6791 | PI: M46I; NRTI: none; NNRTI: none; INTSI: none | PI: NFV(i), IDV/r(p), FPV/r(p), LPV/r(p), SQV/r(p), and ATV/r(p); NRTI: none; NNRTI: none; INSTI: none | 3 (33.3) | none |
| 9430 | PI: none; NRTI: none; NNRTI: none; INTSI: none | PI: none; NRTI: none; NNRTI: EFV(g), ETR(g), RPV(g), and NVP(g); INSTI: none | 10 (10.0) | none |
| 6979 | PI: none; NRTI: none; NNRTI: none; INTSI: none | PI: none; NRTI: none; NNRTI: RVP(l) and ETR(p); INSTI: RAL(p) and EVG(p) | 7 (14.3) | none |
| 0188 | PI: none; NRTI: none; NNRTI: none; INTSI: none | PI: none; NRTI: none; NNRTI: RVP(l) and ETR(p); INSTI: none | 7 (14.3) | none |
| 6320 | PI: none; NRTI: none; NNRTI: none; INTSI: none | PI: none; NRTI: none; NNRTI: RVP(l) and ETR(p); INSTI: none | 5 (20.0) | none |
| 2154 | PI: none; NRTI: none; NNRTI: K103N; INTSI: none | PI: none; NRTI: none; NNRTI: EFV(h) and NVP(h); INSTI: none | 8 (12.5) | none |
| 7383 | PI: none; NRTI: none; NNRTI: none; INTSI: none | PI: none; NRTI: none; NNRTI: RVP(l) and ETR(p); INSTI: none | 12 (8.3) | none |
| 1571 | PI: none; NRTI: none; NNRTI: none; INTSI: none | PI: none; NRTI: none; NNRTI: RVP(l) and ETR(p); INSTI: none | 13 (7.7) | none |
| 5309 | PI: none; NRTI: none; NNRTI: none; INTSI: none | PI: none; NRTI: none; NNRTI: none; INSTI: RAL(p) and EVG(p) | 12 (8.3) | none |
| 1320 | None | None | 8 (12.5) | none |
| 7044 | None | None | 12 (8.3) | none |
| 7572 | None | None | 9 (11.1) | none |
| 9435 | None | None | 5 (20.0) | none |
| 8069 | None | None | 5 (20.0) | none |
| 5931 | None | None | 2 (50.0) | none |
| 8557 | None | None | 7 (14.3) | none |
| 8737 | None | None | 5 (20.0) | none |
| 9011 | None | None | 2 (50.0) | none |
| 5337 | None | None | 4 (25.0) | none |
| 1971 | None | None | 4 (25.0) | none |
| 1789 | None | None | 2 (50.0) | none |
| 1897 | None | None | 3 (33.3) | none |
| 1988 | None | None | 8 (12.5) | none |
| 7034 | None | None | 7 (14.3) | none |
| 2164 | None | None | 1 (100) | none |
| 2472 | None | None | 6 (16.7) | none |
| 2529 | None | None | 4 (25.0) | none |
| 2778 | None | None | 6 (16.7) | none |
| 2982 | None | None | 2 (50.0) | none |
| 4082 | None | None | 3 (33.3) | none |
Abbreviations: ATV/r, atazanavir/ritonavir; DOR, doravirine; DRV/r, darunavir/ritonavir; ETR, etravirine; EFV, efavirenz; EVG, elvitegravir; FPV/r, fosamprenavir/ritonavir; IDV/r, indinavir/ritonavir; INSTI, integrase strand transfer inhibitor; LPV/r, lopinavir/ritonavir; NFV, nelfinavir; NNRTI, nonnucleoside reverse-transcriptase inhibitor; NRTI, nucleoside reverse-transcriptase inhibitor; NVP, nevirapine; PI, protease inhibitor; RAL, raltegravir; RPV, rilpivirine; SDRM, surveillance drug resistance mutation; SQV/r, saquinavir/ritonavir; TPV/r, tipranavir/ritonavir.
aListed are each specimen’s SDRMs and predicted drug resistance conferred by SDRMs and non-SDRMs from the Stanford University HIV Drug Resistance Database, along with the number of each specimen’s full-length pol gene consensus sequences. High-level resistance (h), intermediate-level resistance (i), low-level resistance (l), potential low-level resistance (p). The number of sequences and type of linked mutations are also provided when present.
Comparison of Microdrop HIV Sequencing With Sanger Sequencing
We compared the DRM profiles generated by microdrop sequencing with those generated by SGA and Sanger sequencing. Five of the 10 specimens that showed SDRMs by microdrop sequencing were selected, and a total of 13 pol gene sequences were produced by Sanger sequencing: 2 sequences from specimen 1430, 2 from 1133, 2 from 1599, 3 from 9544, and 4 from 4241. Specimen 1430 had 6 pol gene sequences generated by microdrop sequencing, all of which had L90M (PI) and Y181C (NNRTI) mutations (Table 1). Consistently, 1430 had 2 Sanger sequences with those mutations, as presented in Supplementary Table 3. Microdrop HIV sequencing produced 10 pol gene sequences from specimen 1133, of which only 1 had L90M (PI) and Y181C (NNRTI) mutations (Table 1). However, no SDRMs were detected from this specimen’s 2 Sanger sequences (Supplementary Table 3). This discrepancy can be explained by the lower detection limit of microdrop sequencing compared with the Sanger method (10% vs 50%, respectively). We observed similar results with the remaining specimens 4241, 1599, and 9544 in which SDRMs were detected with microdrop sequencing, but not with Sanger sequencing. Our results clearly demonstrate the ability of microdrop HIV sequencing to detect minority variants with DRMs.
HIDA’s Supply Cost
The per-specimen supply cost of HIDA is estimated to be about $80 for both incidence and drug resistance screenings. This is less than the sum of the cost for commercially available incidence and drug resistance assays [39]. This includes HIV RNA extraction ($9.18); UMI-tagged cDNA synthesis ($30.57); microdrop amplification ($13.66); DNA quantification ($5.69); general consumables, including buffers and plastic-ware ($4.19); and high-throughput long-read sequencing ($17.07). HIDA requires a droplet generator (QX200; BioRad) in addition to conventional equipment for HIV DRM screening.
DISCUSSION
HIDA’s major advantage is its ability to produce full-length HIV envelope and pol gene sequences in a high-throughput manner via the newly introduced microdrop HIV sequencing. HIDA’s precision of incidence screening was measured to be an an FRR of 1.2% [0.0%–3.7%] and an MDRI of 262 [189–327] days with the standard CEPHIA panel. This estimated FRR was close to the optimal performance standard of <1% FRR [37]. The estimated MDRI was greater than for currently available serologic incidence assays [2, 3, 6]. We also screened all 93 WHO SDRMs from full-length pol gene sequences and compiled resistance profiles to all 24 drugs, which include all 12 drugs of the first- to third- line ART regimens recommended by WHO [40]. Our cost-efficient but still high-precision assay permitted simultaneous screening of HIV incidence and DRMs from a single-blood-draw specimen.
Microdrop HIV sequencing provided enhanced DRM detection power. We reported an overall PDR prevalence of 26.3% [12.3%–40.3%] and an SDRM prevalence in the range of 2.6%–13.2%. Our estimates were overall greater than those of previous reports, with PDR prevalence of 0.9%–28.8% [41–45] and SDRM prevalences of 0.3%–12.1% [44–47]. This observed increase in prevalence could be explained by the improved detection limit of microdrop sequencing’s compared with standard, population sequencing; microdrop HIV sequencing generated an average of 6.3 full-length pol gene sequences per individual, and thus the detection limit is 6.3-fold more sensitive than the current standard on average. We verified this increased sensitivity of minority variant detection by producing Sanger sequencing control data.
Our assay has significant advantages over high-throughput, short-read HIV genotyping assays [16]. Short-read sequencing cannot detect mutation-linkage since it measures the percentage of each mutation separately. Of particular concern is the presence of multiple DRMs to different drug classes within a single virus, which may diminish the efficacy of combination therapy. Our microdrop HIV sequencing for full-length pol gene can detect linked mutations at the template level, which are relevant for predicting the success of combination therapy.
The remaining challenges for HIDA include its inability to process virally suppressed ART recipients and elite controllers. This method isolates HIV RNA from blood specimens, which is not readily obtainable from virally suppressed individuals. Proviral DNA sequencing can be potentially explored to isolate incident infection signatures. Moreover , HIDA’s DRM detection limit is variable, and further optimization would be required to improve this. Further improvements may include implementing laboratory automation using robotics, which can increase HIDA’s viability for routine use for public health surveillance.
We introduced HIDA, a novel genomic assay with significant precision and cost benefits over current standards. The ability to obtain multiple full-length envelope and pol gene sequences allows for simultaneous incidence and DRM screenings, which may advance single-blood-draw HIV cross-sectional surveillance.
Supplementary Data
Supplementary materials are available at The Journal of Infectious Diseases online. Consisting of data provided by the authors to benefit the reader, the posted materials are not copyedited and are the sole responsibility of the authors, so questions or comments should be addressed to the corresponding author.
Notes
Acknowledgments. The Consortium for the Evaluation and Performance of HIV Incidence Assays (CEPHIA) comprises the following members: Alex Welte, Joseph Sempa, and, formerly, David Matten, Hilmarié Brand, and Trust Chibawara (South African Centre for Epidemiological Modelling and Analysis, Stellenbosch University);
Gary Murphy, Jake Hall, and, formerly, Elaine Mckinney (Public Health England);
Michael P. Busch, Eduard Grebe, Shelley Facente, Dylan Hampton, Sheila Keating, and, formerly, Mila Lebedeva (Vitalant Research Institute, formerly Blood Systems Research Institute); Christopher D. Pilcher and Kara Marson (University of California, San Francisco); Reshma Kassanjee (University of Cape Town); Oliver Laeyendecker, Thomas Quinn, and David Burns (National Institutes of Health); Susan Little (University of California ,San Diego); Anita Sands (World Health Organization); Tim Hallett (Imperial College London); S. Michele Owen, Bharat Parekh, and Connie Sexton (Centers for Disease Control and Prevention); Matthew Price and Anatoli Kamali (International AIDS Vaccine Initiative); Lisa Loeb (The Options Study–University of California, San Francisco); Jeffrey Martin, Steven G. Deeks, and Rebecca Hoh (The SCOPE Study–University of California, San Francisco); Zelinda Bartolomei and Natalia Cerqueira (The AMPLIAR Cohort–University of São Paulo); Breno Santos, Kellin Zabtoski, and Rita de Cassia Alves Lira (The AMPLIAR Cohort–Grupo Hospital Conceição); Rosa Dea Sperhacke, Leonardo R. Motta, and Machline Paganella (The AMPLIAR Cohort–Universidade Caxias Do Sul); Esper Kallas, Helena Tomiyama, Claudia Tomiyama, Priscilla Costa, Maria A. Nunes, Gisele Reis, Mariana M. Sauer, Natalia Cerqueira, Zelinda Nakagawa, Lilian Ferrari, Ana P. Amaral, and Karine Milani (The São Paulo Cohort–University of São Paulo); Salim S. Abdool Karim, Quarraisha Abdool Karim, Thumbi Ndungu, Nelisile Majola, and Natasha Samsunder (CAPRISA, University of Kwazulu-Natal); Denise Naniche (The GAMA Study–Barcelona Centre for International Health Research); Inácio Mandomando and Eusebio V. Macete (The GAMA Study–Fundacao Manhica); Jorge Sanchez and Javier Lama (SABES Cohort–Asociación Civil Impacta Salud y Educación [IMPACTA]); Ann Duerr (Fred Hutchinson Cancer Research Center); Maria R. Capobianchi (National Institute for Infectious Diseases “L. Spallanzani,” Rome); Barbara Suligoi (Istituto Superiore di Sanità, Rome); Susan Stramer (American Red Cross); Phillip Williamson (Creative Testing Solutions/Vitalant Research Institute); Marion Vermeulen (South African National Blood Service); and Ester Sabino (Hemocentro do São Paolo).
We thank the Icahn Institute for Data Science and Genome Technology at Mount Sinai for long-read high-throughput sequencing and GENEWIZ for Sanger sequencing. We also thank Valerie Boltz for her help with the human immunodeficiency virus (HIV) complementary DNA synthesis procedure.
Author contributions. S. Y. P. and H.L. conceived this project, designed the experimental workflows and bioinformatics pipelines, and performed the incidence and drug resistance mutation screening on the CEPHIA panel. G. F. conducted HIV envelope and pol gene sequencing experiments. G. M., C. P., and M. P. B. built the CEPHIA panel and provided the incident- and chronic-infection specimens tested in this study.
Financial support. This work was supported by the National Institute of Allergy and Infectious Diseases, National Institutes of Health (grant R01-AI095066) and the Bill & Melinda Gates Foundation (grants OPP1017716, OPP1062806, and OPP1115799 to CEPHIA).
Potential conflicts of interest. All authors: No reported conflicts. All authors have submitted the ICMJE Form for Disclosure of Potential Conflicts of Interest. Conflicts that the editors consider relevant to the content of the manuscript have been disclosed.
References
World Health Organization; Updated recommendations on first-line and second-line antiretroviral regimens and post-exposure prophylaxis and recommendations on early infant diagnosis of HIV. January, 2018. https://www.who.int/hiv/pub/guidelines/ARV2018update/en/. Accessed 22 March 2021.

