


Abstract
Telomere length (TL) shortens during aging, HIV seroconversion, and untreated chronic HIV infection. It is unknown whether early antiretroviral therapy (ART) start is associated with less TL shortening during primary HIV infection (PHI).
We measured TL in peripheral blood mononuclear cells by quantitative polymerase chain reaction in participants of the Zurich PHI Study with samples available for ≥6 years. We obtained univariable/multivariable estimates from mixed-effects models and evaluated the association of delaying ART start or interrupting ART with baseline and longitudinal TL.
In 105 participants with PHI (median age 36 years, 9% women), median ART delay was 25, 42, and 60 days, respectively, in the first (shortest), second, and third (longest) ART delay tertile. First ART delay tertile was associated with longer baseline TL (P for trend = .034), and longer TL over 6 years, but only with continuous ART (P < .001), not if ART was interrupted ≥12 months (P = .408). In multivariable analysis, participants in the second and third ART delay tertile had 17.6% (5.4%–29.7%; P = .004) and 21.5% (9.4%–33.5%; P < .001) shorter TL, after adjustment for age, with limited effect modification by clinical variables.
In PHI, delaying ART start for even a matter of weeks was associated with significant and sustained TL shortening.
Persons living with human immunodeficiency virus (PWH) may be at increased risk of aging-associated conditions compared to human immunodeficiency virus (HIV)–negative persons [1, 2]. Telomere length (TL) is typically measured in whole blood or in peripheral blood mononuclear cells (PBMCs) and shortens with age. Short TL in whole blood and PBMCs is also associated with stroke, diabetes mellitus, coronary artery disease, and all-cause mortality in the general population [3–5]. We recently recorded an independent association of short TL with coronary events in PWH after adjustment for traditional and HIV-related risk factors [6].
TL is shorter in PWH compared to HIV-negative persons [7–11]. Short TL in PWH has been associated with persistent immune activation [8] and a lower immunological response despite suppressive antiretroviral therapy (ART) [12]. A considerable amount of TL shortening in PWH may occur early during HIV infection and in a short time period, that is, in the setting of HIV seroconversion [13, 14]. Thereafter, whether TL shortening over time is accelerated in PWH compared to the general population is unclear. Longitudinal studies now suggest that TL decline may be reversed with initiation of suppressive ART in chronic HIV infection [15, 16]. Shorter TL has also been associated with higher viral loads in ART-naive PWH [17].
It is unknown whether TL shortening in the setting of primary HIV infection (PHI) is attenuated by initiation of ART. The aim of the present study was to evaluate any independent association of the time of ART start with TL in participants with documented PHI in the Zurich Primary HIV Infection Study (ZPHI), and to estimate the impact of early ART start relative to other factors with known TL association such as age. In longitudinal analyses, we also examine whether the TL effect of early ART start in PHI persists over 6 years.
METHODS
Study Population
Eligible participants included PWH enrolled in the ZPHI (http://clinicaltrials.gov, NCT00537966) [18]. All participants later also enrolled in the Swiss HIV Cohort Study (www.shcs.ch) [19]. The study was approved by the local ethics committee. Participants provided written informed consent. All participants were aged ≥18 years and had confirmed PHI, defined as acute or recent as previously published [20–23]: Acute HIV infection was defined as acute retroviral syndrome (ARS) and negative or indeterminate Western blot plus a positive p24 antigen and/or detectable HIV-1 RNA; or as a documented seroconversion with or without symptoms during the past 90 days. Recent infection was defined as possible ARS, positive Western blot and detectable HIV RNA and a negative HIV-gp120 avidity or detuned assay; or as confirmed acute HIV-1 infection but referral to our center 90–180 days after the estimated date of HIV infection (EDI). For each participant, we estimated EDI by considering all available information including risk behavior, duration of PHI-compatible symptoms, results of previous HIV serologies, avidity assays, and Western blots, as previously described [20–23]. The follow-up period was from the date of ZPHI enrollment until the last routine, biannual SHCS visit recorded in the SHCS database. Between 2002 and 2008, ZPHI participants were offered to interrupt ART after being virologically suppressed for ≥1 year. The ART interruption strategy was abandoned in 2008 because we recorded only a transient effect (lower viral setpoint) when early ART in PHI was interrupted [24], and when treatment as prevention was shown effective to prevent HIV transmissions.
Telomere Length
We measured TL by quantitative polymerase chain reaction (PCR) in stored peripheral blood mononuclear cells (PBMCs), and used as control the single-copy albumin gene, as previously reported [6, 8]. (Supplementary Methods) Samples were analyzed in duplicate, with a <1% coefficient of variation between duplicate measurements within the same run. We report all TL values as relative values expressed as the T/S ratio (amplification of the telomere product/amplification of the single-copy albumin gene).
Factors Associated With Telomere Length
Covariables were selected a priori, based on their published association with TL, including age (per 10 years older), sex, HIV RNA quantity at baseline, acute retroviral syndrome severity score (ARSSS), and cytomegalovirus (CMV) serostatus [6, 17, 25]. We also explored as variables fever and the symptoms/signs included in the ARSSS, time spent under observation, CD4 count, CD8 count, CD4/CD8 ratio, smoking, hepatitis C virus (HCV) coinfection, and alcohol intake.
Study Design
We measured TL longitudinally in each participant (Figure 1), that is, in the first available blood sample during PHI (subsequently referred to as the baseline sample), in order to assess the effect of ART delay on TL early after PHI; and in the last available sample, in order to evaluate any persistent longitudinal effect of a delay in ART initiation and of ART interruptions on future TL. No samples prior to HIV diagnosis were available. In participants on continuous ART, we measured TL at 2 years and 5 years after ART initiation. In participants who interrupted ART, we measured TL in the last available sample before ART interruption and in the last available sample before ART reinitiation or study dropout. To limit confounding by normal biological variation due to repeat TL measurements at short intervals, we limited the TL analyses to participants with 1 ART treatment phase and 1 ART interruption phase, each of ≥12 months’ duration.
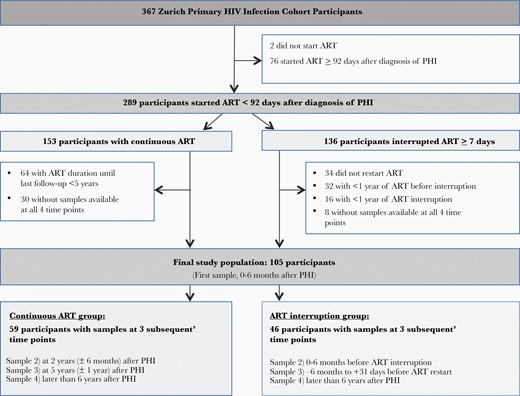
Study flowchart. Abbreviations: ART, antiretroviral therapy; HIV, human immunodeficiency virus; PHI, primary human immunodeficiency virus infection.
Statistical Analyses
We applied Kernel-weighted local polynomial smoothing with the Epanechnikov kernel to visualize the course of TL over time. Annualized changes between the first and last samples of participants on continuous ART compared to interrupted ART were compared using the Wilcoxon signed-rank test. We used mixed-effects multilevel regression with random intercept per patient to model TL over time. Random slopes were also considered but discarded based on Akaike information criterion (AIC) and Bayesian information criterion (BIC) scores. For the analyses we only used data from patients on ART (ie, timepoints 1–4 from patients on continuous ART and timepoints 1–2 from patients who interrupted ART). We stratified the delay between estimated date of infection and start of ART (our main exposure variable) and potential continuous confounders and effect modifiers (CD4, CD8, CD4/8 ratio, HIV RNA, ARSSS) into tertiles to support visualization of effect modifications from models with interactions. Potential dichotomous clinical confounders were fever (yes/no), smoking (yes/no), alcohol use (none-light/moderate-heavy), HCV seropositivity (yes/no), and CMV seropositivity (yes/no). Because TL shows a linear decrease with age [3], we included age at baseline as well as observation time (both scaled per 10 years) in all multivariable models. Interactions between age and follow-up time as well as the tertiles of ART-start delay were checked using likelihood ratio tests and AIC/BIC scores, but discarded due to lack of significance (all P > .2). In multivariable models, the effect of the individual potential clinical confounders on the association of ART-start delay tertiles with TL were tested on a 1:1 basis allowing for interactions. We predicted average marginal effects on TL at the time of baseline sample by using mixed models that include all TL measurements over time that were taken during ART, which improves the accuracy of the predicted baseline TL. All multivariable models looking at clinical risk factors were adjusted for age, sex, and observation time. Because in the models we predict baseline TL, we do not adjust for baseline TL.
Data management and all analyses were done with Stata/SE 16.1 software (StataCorp, College Station, Texas).
RESULTS
Participants
Of 367 patients with PHI enrolled in the ZPHI, we selected 105 participants who started ART within 92 days of PHI diagnosis and who had a longitudinal set of PBMC samples available for TL measurement at the time points indicated in Figure 1. Of the 105 participants, 59 participants were treated with continuous ART during follow-up and 46 participants interrupted ART for ≥1 year. The baseline characteristics of participants are shown in Table 1. The TL trajectories of individual participants show considerable intra- and interindividual variability (Supplementary Figures 1 and 2).
Characteristics of Study Participants at the Time of Primary Human Immunodeficiency Virus Infection
| Characteristic | Continuous ART (n = 59) | ART Interrupters (n = 46) | All Participants (N = 105) |
|---|---|---|---|
| Male sex | 57 (97) | 39 (85) | 96 (91) |
| Age, y, median (IQR) | 36 (30–42) | 37 (30–43) | 36 (30–42.5) |
| Race/ethnicity | |||
| White | 57 (97) | 41 (89) | 98 (93) |
| Black | 0 | 1 (2) | 1 (1) |
| Hispano-American | 2 (3) | 3 (7) | 5 (5) |
| Asian | 0 | 1 (2) | 1 (1) |
| Estimated HIV infection date, median (range) | 25 Aug 2009 (24 Oct 2002–14 Mar 2012) | 31 Mar 2005 (23 Nov 2001–13 Dec 2009) | 5 Mar 2007 (23 Nov 2001–14 Mar 2012) |
| Mode of HIV transmission | |||
| Heterosexual | 10 (17) | 12 (26) | 22 (21) |
| Men who have sex with men | 47 (80) | 32 (70) | 79 (75) |
| Injection drug use/other | 2 (3) | 2 (4) | 4 (4) |
| CD4 count, cells/μL, median (IQR) | 326 (247–489) | 434 (345–559) | 362 (290–502) |
| CD8 count, cells/μL, median (IQR) | 831 (520–1575) | 742 (513–1150) | 788 (520–1383) |
| CD4:CD8 ratio, median (IQR) | 0.36 (0.21–0.66) | 0.58 (0.39–0.82) | 0.47 (0.25–0.72) |
| HIV RNA, log copies/mL, median (IQR) | 6.06 (5.27–6.85) | 5.63 (4.91–6.59) | 5.87 (5.20–6.67) |
| Symptoms consistent with primary HIV infection | 58 (98) | 44 (96) | 102 (97) |
| Acute retroviral syndrome severity score, median (IQR) | 2 (2–4) | 2 (2–5) | 2 (2–5) |
| Fever | 48 (81) | 41 (89) | 89 (85) |
| Smoking, current | 34 (58) | 26 (57) | 60 (57) |
| Alcohol usea | |||
| None/light | 48 (81) | 37 (80) | 85 (81) |
| Moderate/heavy | 11 (19) | 9 (20) | 20 (19) |
| Cocaine use, recent | 11 (19) | 3 (7) | 14 (13) |
| CMV seropositivity | 49 (83) | 40 (87) | 89 (85) |
| HCV seropositivity | 2 (3) | 1 (2) | 3 (3) |
| Delay until ART start, d, median (IQR) | 35 (29–54) | 42 (32–56) | 42 (29–55) |
Data are presented as No. (%) unless otherwise indicated.
Abbreviations: ART, antiretroviral therapy; CMV, cytomegalovirus; HCV, hepatitis C virus; HIV, human immunodeficiency virus; IQR, interquartile range.
aDuring subsequent follow-up in the Swiss HIV Cohort Study.
Telomere Length at Baseline and Over Time, Observed Data
In all 105 participants, median relative TL at baseline was 1.28 (interquartile range [IQR], 1.09–1.62). In the continuous ART group, median TL was 1.28, 1.25, 1.18, and 1.25 at baseline, 2 years, 5 years, and in the last sample, respectively. In the ART interruption group, median TL was 1.31, 1.32, 1.21, and 1.14 at baseline, at ART interruption, at ART restart, and in the last sample, respectively. There was no evidence for any difference between TL at baseline in the continuous ART group and in the ART interruption group (Wilcoxon rank-sum test, P = .80), and no evidence for any difference between the median TL change from first to last sample in the continuous vs the ART interruption group (–1.21%/year vs –1.55%/year; Wilcoxon rank-sum test P = .55).
Telomere Length at Baseline and Timing of ART Initiation, Observed Data
In all 105 participants, the median delay from estimated date of HIV infection (EDI) to ART start was 42 (IQR, 29–55) days. We then divided participants into tertiles of ART initiation delay. ART delay was 25, 42, and 60 days, in the first, second, and third tertiles, respectively (Table 2). Compared to the second and third tertiles, participants in the first ART delay tertile (shortest ART delay) had longer TL at baseline (Table 2 and Figure 2A). ART delay was also associated with longer TL during 6-year follow-up in the 59 participants with continuous ART (Table 2 and Figure 2B), but not in the 46 participants who interrupted ART for ≥12 months (Table 2 and Figure 2C). Baseline TL was measured before ART start in 99 patients. Baseline TL was measured after ART start in 6 patients (median, 25 [IQR, 19–34] days after ART start).
Association of Antiretroviral Therapy Delay and Telomere Length in 105 Participants With Primary Human Immunodeficiency Virus Infection
| Tertile | No. of Participants | Median Age, y (IQR) | ART Delay, d, Median (IQR) | Telomere Length, Median (IQR), Baseline Sample | Telomere Length, Median (IQR) Follow-up Time Points Combined, Continuous ART | Telomere Length, Median (IQR) Follow-up Time Points Combined, ART Interrupters |
|---|---|---|---|---|---|---|
| Tertiles combined | 105 | 36 (30–43) | 42 (29–55) | 1.28 (1.09–1.62) | 1.23 (1.00–1.49) | 1.20 (0.97–1.49) |
| Tertile 1 | 33 | 38 (31–43) | 25 (21–29) | 1.43 (1.18–1.69) | 1.36 (1.14–1.64) | 1.26 (1.01–1.53) |
| Tertile 2 | 37 | 37 (30–48) | 42 (35–44) | 1.26 (1.05–1.63) | 1.16 (0.98–1.39) | 1.16 (0.80–1.35) |
| Tertile 3 | 35 | 34 (29–41) | 60 (55–73) | 1.21 (1.05–1.42) | 1.17 (0.96–1.34) | 1.22 (1.03–1.58) |
Median telomere length in the last sample is not considered in the analyses because of different intervals between baseline and last sample.
Abbreviations: ART, antiretroviral therapy; IQR, interquartile range.
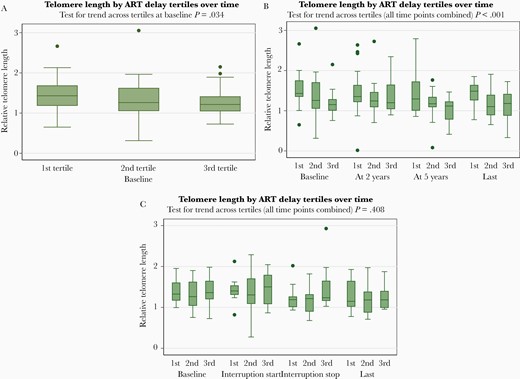
Observed telomere length (TL) over time by antiretroviral therapy (ART) delay. A, Observed TL at baseline in all 105 study participants with primary human immunodeficiency virus infection (PHI). Relative TL at baseline. Results shown are based on all 105 study participants, stratified by ART delay tertile. Box and whisker plot showing the medians plus interquartile ranges (boxes) and upper and lower adjacent values (whiskers) of relative TL. B, Observed TL over time in 59 PHI participants with continuous ART. Relative TL at baseline, at 2 years (±6 months), at 5 years (±1 year), and in the last sample (≥6 years after primary HIV infection). Results shown are based on 59 study participants with continuous ART, stratified by ART delay tertile. Box and whisker plot showing the medians plus interquartile ranges (boxes) and upper and lower adjacent values (whiskers) of relative TL. Outliers are depicted as individual points. C, Observed TL over time in 46 PHI participants who interrupted ART. Relative TL at baseline, 0–6 months before ART interruption, at ART interruption stop (–6 months to +31 days before ART restart), and in the last sample (at least 6 years after PHI). Results shown are based on 46 study participants who interrupted ART (ie, with 1 ART treatment phase and 1 ART interruption phase, each of ≥12 months’ duration), stratified by ART delay tertile. Box and whisker plot showing the medians plus interquartile ranges (boxes) and upper and lower adjacent values (whiskers) of relative TL. Outliers are depicted as individual points.
Association of Telomere Length Across All Time Points With ART Delay and Clinical Variables—Univariable Model
To avoid confounding by ART interruption, we restrict the subsequent analyses to participants during continuous ART. Median baseline TL was significantly associated with the delay in starting ART: second tertile of ART delay, 19.9% shorter median TL (95% confidence interval [CI], 7%–32.8% shorter; P = .002); third tertile of ART delay, 19.1% shorter median TL (95% CI, 6.1%–32.2% shorter; P = .004), each compared to the first tertile. Of the clinical variables, median baseline TL was associated with baseline age (8.2% shorter per 10 years older [95% CI, 2.2%–14.3% shorter]; P = .007), female sex, moderate/heavy alcohol use, and hepatitis C seropositivity (Supplementary Table 1). However, only 3 participants were hepatitis C seropositive, so no detailed analyses were undertaken. No other clinical variable was significantly associated with TL, including CD4 count, CD8 count, CD4/CD8 ratio, HIV RNA, acute retroviral syndrome severity score, fever, CMV seropositivity, and current smoking (Supplementary Table 1). The median baseline age of participants was 38, 37, and 34 years, in the first, second, and third ART delay tertiles, respectively (Table 2), but including an interaction term between age and ART delay did not improve the models (Supplementary Table 2).
Association of Telomere Length Across All Time Points With ART Delay and Clinical Variables—Multivariable Model
In a basic multivariable model that included baseline age, sex, and observation time since baseline, median TL remained significantly associated with ART delay tertile. Compared to the first tertile (shortest ART delay), median TL in the second and third tertile (longest ART delay) was 17.8% shorter (95% CI, 6.4%–29.3% shorter; P = .002) and 22.6% shorter (95% CI, 11%–34.2% shorter; P < .001), respectively. The effects of clinical variables on TL were similar to their effects in univariable analysis (Figure 3, Supplementary Table 1). The effect size of ART delay tertiles on TL remained similar and remained statistically significant when we added the clinical variables to the multivariable model (Figure 3).
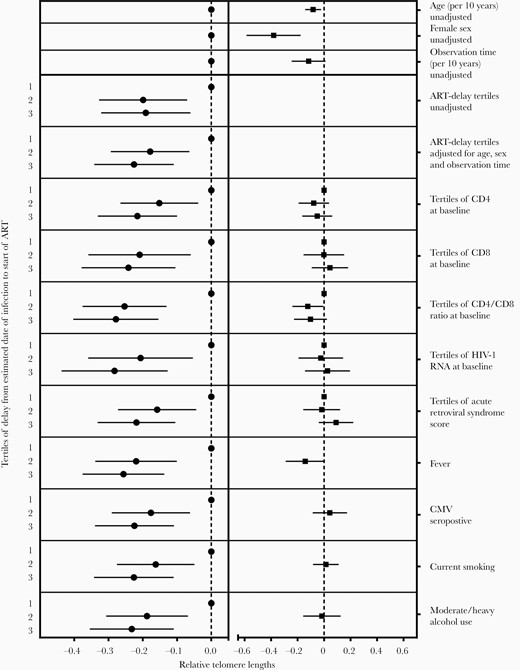
Association of telomere length (TL) with antiretroviral therapy (ART) delay tertile (left column) and clinical variables (right column), unadjusted and adjusted multivariable analyses. Mixed models including all TL measurements while on ART and the indicated clinical variables are adjusted for age, female sex, and observation time, and allow for interactions between the clinical variable and ART delay tertile. Results are presented as predicted change in TL at baseline. Abbreviations: ART, antiretroviral therapy; CMV, cytomegalovirus; HIV-1, human immunodeficiency virus type 1.
Association of Telomere Length With ART Regimen Started
The ART regimens started during PHI were lamivudine/zidovudine/lopinavir/ritonavir (n = 65), emtricitabine/tenofovir disoproxil fumarate/darunavir/ritonavir (n = 27), and other regimens (n = 13). There was no evidence of any difference in baseline TL (likelihood ratio test, P = .80) or TL at all time points when we included ART regimen in the model (likelihood ratio test for interaction, all P > .28).
Sensitivity Analysis, Association of Telomere Length With ART Delay Considered as Continuous Variable
In a basic multivariable model including ART delay as continuous variable and adjusted for age, sex, and observation time since baseline, median baseline TL was associated with ART delay (13.2% shorter per month longer delay; 95% CI, 5%–21.4% shorter; P = .002). Model fit was improved with ART delay considered as tertiles vs continuously (AIC, 347.05 vs 350.45).
Sensitivity Analyses, Male Participants Only, Nonwhite Ethnicity, Pack-Years of Smoking
Because of the TL difference between men and women, we reanalyzed the data in the 96 male participants only, with essentially unchanged results (Supplementary Results, Supplementary Table 3, Supplementary Figure 2). TL in the 7 nonwhite participants was similar to that of white participants (7% longer median TL; 95% CI, 16.7% shorter to 30.6% longer; P = .567). Including an interaction term between nonwhite ethnicity and ART delay affected the effect size of ART delay tertile only minimally: Compared to the first ART delay tertile, the median TL in the second and third tertile in nonwhites was 18.1% shorter (95% CI, 6.6%–29.6% shorter; P = .002) and 22.6% shorter (95% CI, 11%–34.2% shorter; P < .001), respectively. Finally, when we considered smoking quantitatively, that is, as pack-years of smoking at baseline, results did not change and there was no interaction with ART delay tertiles (data not shown).
DISCUSSION
Our longitudinal study of TL in patients with PHI in Switzerland has 4 major findings. First, to our knowledge, ours is the first study to document that an ART delay in PHI of just a matter of weeks is independently associated with shorter TL. Second, the ART delay effect on TL (approximately 17%–22% shorter TL) in our multivariable model was approximately twice as large compared to the effect of being 10 years older (8.2% shorter TL) and therefore appears clinically relevant. Of note, in our previous report [6], PWH in the first quintile (shortest TL) had 2.8-fold shorter median TL and approximately twice the coronary artery disease risk compared to PLWH in the fifth quintile (longest TL). Third, the favorable effect on TL of early continuous ART in PHI was sustained for >6 years. Fourth, the favorable effect on TL of early ART was offset by subsequent ART interruption.
Aging-associated conditions are more prevalent in some [1, 26, 27] but not all [28] PWH populations compared to HIV-negative control populations, but documentation of the notion of accelerated aging in PWH remains limited. Our results may contribute to better understanding of the aging process in PWH by providing a detailed characterization of the time at which TL shortening in PWH may occur. Previous reports have suggested that TL takes a big “hit” around the time of HIV seroconversion [13, 14], during the first 2 years after HIV seroconversion [13], and during untreated or suboptimally treated chronic HIV infection [29]. Our study extends these findings. The best assessment at present is that our data demonstrate significant TL shortening in participants with only a few weeks’ delay in starting ART during PHI, which is consistent with a deleterious effect of untreated PHI on some cellular aging mechanisms. For example, previous reports have highlighted the direct inhibition of telomerase, the key enzyme involved in TL maintenance and repair, by HIV proteins in vitro [30, 31].
While other reports have further suggested the potential for in vitro inhibition of telomerase activity by certain antiretroviral agents [32], observational data in HIV-positive vs HIV-negative children [33], and recent longitudinal trials in PWH have suggested that ART has a beneficial effect on TL [15, 16]. ART reduces immune activation, and a TL increase during suppressive ART likely reflects shifts towards T cells with increased replicative potential and longer telomeres [34–36]. Our results in patients with PHI are compatible with such favorable effects of ART on TL that were recorded in chronic HIV infection [15, 16]. In addition, our finding that ART interruption (after having been started during PHI) neutralizes the beneficial effect on TL of an early ART start appears consistent with the overall beneficial effect of ART on TL recorded in longitudinal trials [15, 16].
Previous cross-sectional studies in PWH with chronic HIV infection have suggested an association of a high level of HIV RNA with shorter TL [7, 17]. In our patients with PHI, baseline HIV RNA level had only a limited effect on TL, perhaps because during PHI, levels of HIV RNA are very high in most patients, and are associated with large degrees of systemic inflammation and, presumably as a consequence, large effects on TL shortening within a short time period. An association between inflammatory biomarkers and TL shortening has previously been recorded in middle-aged [37] and elderly persons in the general population [38]. Shorter TL compared to healthy controls has also been noted in persons with chronic HIV infection [39] and with chronic autoimmune conditions including systemic lupus [40] and psoriasis [41]. These studies were cross-sectional, and no solid information is available on the potential for attenuation of TL shortening by effective anti-inflammatory treatment. Furthermore, shorter TL in rheumatoid arthritis (RA) is likely an early, potentially RA-predisposing phenomenon that is in part genetically determined and unrelated to chronic inflammation [42].
Strengths of our study include the relatively large number of well-characterized patients with PHI enrolled in the well-established ZPHI study. Our longitudinal study design and comprehensive sample availability allowed us to assess TL before ART initiation, to document the persistence of the beneficial effect of early start of continuous ART on TL, and to separate the effects of early ART start and subsequent ART interruption. Our results were remarkably robust because the favorable effect of early ART start on TL persisted in multivariable analysis, with limited effect modification by multiple demographic and clinical factors that potentially may influence TL in vivo, including age, smoking, and others. Our finding of significant TL shortening in untreated PHI appears to be clinically relevant for 2 reasons. First, the effect size of ART delay on TL was large, that is, roughly twice as large as the effect of being 10 years older, and robust against adjustments for known confounders; the effect is therefore unlikely to be explained by undetected residual confounding. Second, we recently recorded an independent association of short TL with acute coronary events in Swiss PWH [6]. This hard endpoint data suggests that short TL matters in PWH; the deleterious effect of short TL on cardiovascular risk in PWH is consistent with previous findings in the general population [3–5].
Our results have limitations. Even though the ZPHI is one of the largest and best-characterized cohort of persons with PHI, our sample size was nonetheless limited. Significant intraindividual TL variability suggests that unmeasured confounders may significantly affect TL in the short term. The annual TL shortening rate in our participants is similar or slightly higher compared to previous publications in PWH [6] and HIV-negative populations [43, 44]. Because of significant individual variability and often highly selected study populations, TL attrition rates should be only cautiously compared between studies. Our study population consisted mostly of white men; results should only cautiously be extrapolated to other populations. A shorter TL in women compared to men is somewhat unexpected but has been previously recorded in some large previous studies [45]; importantly, our conclusions remained unchanged when we restricted the analyses to men. In addition, we measured TL in PBMCs, consistent with many previous studies. However, TL may be lower in PBMCs than in granulocytes [46, 47]; therefore, our results are not directly comparable to studies in which TL was measured in individual T-cell subsets or in whole blood. However, while factors such as CMV infection are associated with TL shortening that is most notable in T cells, TL across different leukocyte subsets and other cell types is highly correlated [48, 49].
Finally, our study was observational (participants were not randomized to ART initiation or ART interruption), and the clinical relevance of our findings needs to be determined in longitudinal studies with validated clinical endpoints. Our results, nonetheless, point to the obvious potential for clinical intervention. First, PHI needs to be diagnosed expeditiously. Second, ART, when started immediately during PHI, might preserve TL and as a result prevent or dampen effects on biological aging and associated diseases.
Supplementary Data
Supplementary materials are available at The Journal of Infectious Diseases online. Consisting of data provided by the authors to benefit the reader, the posted materials are not copyedited and are the sole responsibility of the authors, so questions or comments should be addressed to the corresponding author.
Notes
Author contributions. Study design: M. R., T. E., N. A. K., P. R., J. F., R. D. K., H. F. G., B. L., P. E. T. Patient recruitment: D. L. B. and H. F. G. Data acquisition: N. A. K., P. R., D. L. B., J. F., H. F. G., B. L., P. E. T. Data analysis: M. R., T. E., I. C. S., N. A. K., P. R., B. L., P. E. T. Drafting of the manuscript: M. R., B. L., P. E. T. Critical review and revision of the manuscript: All authors.
Acknowledgments. Swiss HIV Cohort Study (SHCS) data are gathered by the 5 Swiss University Hospitals, 2 cantonal hospitals, 15 affiliated hospitals, and 36 private physicians (listed in http://www.shcs.ch/180-health-care-providers). The authors acknowledge the effort and commitment of SHCS participants, investigators, study nurses laboratory personnel, and administrative assistance by the SHCS coordination and data center.
Disclaimer. The funders had no role in study design, study management, data collection, data analysis, data interpretation, or writing of the manuscript.
Financial support. This work was supported by the SHCS (project 836), Swiss National Science Foundation (grant numbers 177499 and 179571), SCHS research foundation.
Potential conflicts of interest. P. R.’s institution, outside the submitted work, has received grant support from Gilead, Merck, and ViiV, and P. R. has served on scientific advisory boards for Gilead, ViiV, Merck, and Teva, for which honoraria were all paid to his institution. D. L. B. reports grants and personal fees from ViiV, Gilead, and Merck, outside the submitted work. R. D. K. reports personal fees from Gilead, outside the submitted work. B. L. reports personal fees from Kantonsspital Baselland, during the conduct of the study; and personal fees from Gilead and ViiV, outside the submitted work. H. F. G., outside of this study, reports grants from the SHCS and the Swiss National Science Foundation, during the conduct of the study; grants from the SHCS, the Swiss National Science Foundation, the National Institutes of Health, Gilead, and the Yvonne Jacob Foundation; personal advisory/consultant fees from Merck, ViiV Healthcare, and Gilead Sciences; and data and safety monitoring board membership for Merck. P. E. T.’s institution received grants and advisory fees from Gilead and ViiV, outside the submitted work. All other authors report no potential conflicts of interest.
All authors have submitted the ICMJE Form for Disclosure of Potential Conflicts of Interest. Conflicts that the editors consider relevant to the content of the manuscript have been disclosed.
References
Author notes
M. R., T. E., I. C. S., H. F. G., and P. E. T. contributed equally to this work.

