


Abstract
It is not known whether reductions in socioeconomic and racial disparities in incidence of invasive pneumococcal disease (defined as the isolation of Streptococcus pneumoniae from a normally sterile body site) noted after pneumococcal conjugate vaccine (PCV) introduction have been sustained.
Individual-level data collected from 20 Tennessee counties participating in Active Bacterial Core surveillance over 19 years were linked to neighborhood-level socioeconomic factors. Incidence rates were analyzed across 3 periods—pre–7-valent PCV (pre-PCV7; 1998–1999), pre–13-valent PCV (pre-PCV13; 2001–2009), and post-PCV13 (2011–2016)—by socioeconomic factors.
A total of 8491 cases of invasive pneumococcal disease were identified. Incidence for invasive pneumococcal disease decreased from 22.9 (1998–1999) to 17.9 (2001–2009) to 12.7 (2011–2016) cases per 100 000 person-years. Post-PCV13 incidence (95% confidence interval [CI]) of PCV13-serotype disease in high- and low-poverty neighborhoods was 3.1 (2.7–3.5) and 1.4 (1.0–1.8), respectively, compared with pre-PCV7 incidence of 17.8 (15.7–19.9) and 6.4 (4.9–7.9). Before PCV introduction, incidence (95% CI) of PCV13-serotype disease was higher in blacks than whites (17.3 [15.1–19.5] vs 11.8 [10.6–13.0], respectively); after introduction, PCV13-type disease incidence was greatly reduced in both groups (white: 2.7 [2.4–3.0]; black: 2.2 [1.8–2.6]).
Introduction of PCV13 was associated with substantial reductions in overall incidence and socioeconomic and racial disparities in PCV13-serotype incidence.
Invasive pneumococcal disease (IPD), caused by infection with Streptococcus pneumoniae, includes severe illnesses such as bacteremia and meningitis, and results in substantial morbidity and mortality in both children and adults [1, 2]. To reduce the incidence of IPD in the United States, a 7-valent pneumococcal conjugate vaccine (PCV7) targeting serotypes 4, 6B, 9V, 14, 18C, 19F, and 23F was approved and included in the routine vaccination schedule for children in 2000. Although IPD rates declined notably after the introduction of PCV7 [3], an increase in incidence of IPD caused by non-PCV7 serotypes led to the introduction of the 13-valent pneumococcal conjugate vaccine (PCV13) in 2010. PCV13 targeted additional serotypes 1, 3, 5, 6A, 7F, and 19A and replaced PCV7 for use in the routine vaccination of children.
Introduction of both PCV7 and PCV13 has been highly effective at preventing and reducing the burden of pneumococcal disease over time [3–7]. Among individual-level factors, black race, male sex, age <2 years, and age >65 years are recognized risk factors for IPD [4, 8–12]. Studies to assess the impact of vaccination on racial disparities in IPD incidence indicate that racial disparities were greatly reduced after the introduction of PCV7 and eliminated following the introduction of PCV13 [7, 10, 13–16]. Previous studies on socioeconomic disparities in IPD have shown that greater proportion of residents living in poverty and lower median household income are neighborhood-level risk factors for IPD [11, 12, 16, 17]. After the introduction of PCV7 but prior to the introduction of PCV13, disparities in incidence of PCV7-serotype IPD by socioeconomic status gradually disappeared [16]. However, no studies have described socioeconomic disparities in IPD post-PCV13 or assessed whether reduction or elimination of racial and socioeconomic disparities in IPD incidence has been sustained over time.
To determine the impact of conjugate pneumococcal vaccines on overall IPD incidence and on socioeconomic and racial disparities in IPD over time, we analyzed population-based active surveillance data. We quantified the incidence of IPD during periods before and after the introduction of PCV13 into the childhood vaccination schedule and evaluated the association between socioeconomic and individual-level factors and IPD incidence stratified by PCV13 and nonvaccine serotype disease.
METHODS
Case Identification
Tennessee participates in the Centers for Disease Control and Prevention’s (CDC) Emerging Infections Program, which includes a component of Active Bacterial Core surveillance (ABCs) of invasive infections caused by S. pneumoniae [18]. This is an active, laboratory-based surveillance system of 20 of 95 counties in Tennessee, providing individual-level IPD data. Cases of IPD were identified through active surveillance and defined as the isolation of S. pneumoniae from a normally sterile body site (eg, blood, cerebrospinal fluid, or pleural fluid) in a resident of a county participating in ABCs during 1998–2016. We included cases reported to ABCs during 1 January 1998–31 December 2016 and excluded those from years 2000 and 2010, which are considered transition years, during which PCV7 and PCV13, respectively, were introduced. The transition years were excluded from the analysis to account for a 1-year vaccine uptake period [19]. Participating counties during January 1995–July 1999 were Davidson, Williamson, Hamilton, Knox, and Shelby. In August 1999, Robertson, Sumner, Wilson, Rutherford, Dickson, and Cheatham were added, and in January 2010, Madison, Roane, Anderson, Union, Grainger, Jefferson, Sevier, Blount, and Loudon were added, for a total of 20 participating counties. The entire surveillance area represented approximately 4 million residents, which is approximately 55% of the total population in Tennessee.
Patient isolates collected during 1998–2015 were serotyped at CDC’s Streptococcus laboratory using the Quellung reaction [20]. Isolates collected in 2016 and forward were serotyped at CDC’s Streptococcus laboratory using whole genome sequencing [21]. Isolates with an identified serotype were classified as vaccine or nonvaccine serotypes. PCV7 serotypes included 4, 6B, 9V, 14, 18C, 19F, and 23F. PCV13 serotypes included PCV7 serotypes plus serotypes 1, 3, 5, 6A, 7F, and 19A. All other serotypes were classified as nonvaccine serotypes. Serotype status of strains that could not be retrieved and those that were nontypable was classified as missing.
Individual and Socioeconomic Factors
We geocoded each patient’s home address at the time of IPD diagnosis using Esri ArcGIS version 10.3 [22], a geographic information system, to link to their corresponding census tract. Population denominators for identified census tracts were obtained from the 2010 United States (US) Census Bureau estimates to compute the annual IPD rates per 100 000 persons and stratified rates by the individual-level factors age, sex, and race [23]. Race is categorized into white, black, and other. Since our surveillance population is primarily comprised of persons of white and black race, racial disparity here is primarily defined as the difference in IPD incidence rates between persons of white and black race. Socioeconomic factor denominators (the population constituting a specific socioeconomic level in the census tract at that particular time) for identified census tracts were obtained from the 2005–2009 [24] and 2012–2016 [25] American Community Survey 5-year estimates and used to compute incidence rates by socioeconomic factors. Socioeconomic factors for analysis were chosen a priori based on literature review and categorized using standards published in the Public Health Disparities Geocoding Project Monograph [26]. This included the percentage of residents living below the US federal poverty line (<5%, 5%–9.9%, 10%–19.9%, ≥20.0%), percentage of households with children that are female-headed (<19.9%, 20%–39.9%, ≥40.0%), percentage of residents of black or African American race (<19.9%, 20%–39.9%, 40%–59.9%, ≥60.0%), percentage of residents aged ≥16 years who are employed (<49.9%, ≥50.0%), and percentage of households with children headed by a single parent (<19.9%, 20%–39.9%, ≥40.0%).
Statistical Analysis
Data were analyzed from 3 periods: prevaccination years (pre-PCV7: 1998–1999), after PCV7 and before PCV13 introduction (pre-PCV13: 2001–2009), and postintroduction of PCV13 (post-PCV13: 2011–2016). We calculated the incidence of IPD per 100 000 person-years by both individual-level and census tract–level socioeconomic factors. Incidence rates were also stratified by pneumococcal serotype (PCV13, nonvaccine). Isolates with missing serotypes were excluded from this analysis.
Rate ratios, rate differences, relative index of inequality (RII), and concentration curves with their corresponding concentration index were used to quantify disparities in IPD incidence [27–29]. RII is a regression based index of inequality and is obtained as the slope of a Poisson regression model with the incidence rate as the outcome and the cumulative proportion of the population in each of the ranked census tract–level socioeconomic factors as the covariate. RII is a relative measure of disparity between the most impoverished and the least impoverished levels of a socioeconomic factor, with the interpretation being similar to that of rate ratios. An RII >1 with confidence intervals (CIs) that do not include 1 would indicate a statistically significant increased risk for IPD for the most impoverished group [27]. If there is no disparity in incidence of IPD, RII is equal to 1.
The concentration curve provides a visual representation of disparity in IPD incidence by plotting the cumulative percentage of IPD cases vs the cumulative percentage of the population ranked from most impoverished to least impoverished level of the socioeconomic factor. The further the concentration curve is away from the 45-degree line, greater is the disparity in incidence. This is summarized quantitatively using the concentration curve index, calculated as twice the area between the curve and the 45-degree line, which represents no disparity [28]. If there is no disparity in incidence with regards to the socioeconomic variable, the concentration curve index is zero. A negative concentration curve index indicates that incidence is higher among the most disadvantaged. Both RII and the concentration curve are sensitive to changes in the distribution of the population across socioeconomic groups [29]. Cutoffs for both individual- and neighborhood level factors were based on previously published standards by the Public Health Disparities Geocoding Project Monograph and other studies on disparities in IPD to facilitate meaningful comparisons across studies and time [26]. Statistical imputation was not performed for missing serotypes or race. Analyses were conducted using R version 3.5.2 software.
Study Ethics
The Human Subjects Review Boards at the Tennessee Department of Health, Vanderbilt University Medical Center, and Brigham Young University reviewed this study and determined it to be exempt, since it involves very minimal to no risk to participants. Additionally, the CDC reviewed this activity for human subjects protection and determined it to be nonresearch.
RESULTS
During 1988–2016, a total of 8693 cases of IPD were identified through active surveillance. Of those, 202 (2%) were excluded because patient addresses could not be geocoded with accuracy. A total of 8491 cases were included in the analysis. Patient median age was 54 years (interquartile range, 37–69 years) and 52% (n = 4407) were male; 66% (n = 5588) were white, 33% (n = 2819) were black, and 0.4% (n = 35) were of other or unknown race (Supplementary Table 1).
Individual-Level Factors and IPD
Annual incidence rates of IPD (all serotypes) per 100 000 person-years were 22.9 and 17.9 during the pre-PCV7 and pre-PCV13 periods, respectively, but dropped to 12.8 in the post-PCV13 period (Figure 1A). Incidence of IPD by vaccine and nonvaccine serotypes over time is shown in Figure 1B. The incidence of IPD caused by the serotypes in PCV7 declined after the introduction of the vaccine and remained low through the end of the study period. After the onset of the decline in disease caused by PCV7 serotypes, an increase in IPD caused by serotypes not included in the vaccine occurred. The implementation of PCV13 was followed by a reduction in IPD caused by serotypes in that vaccine.
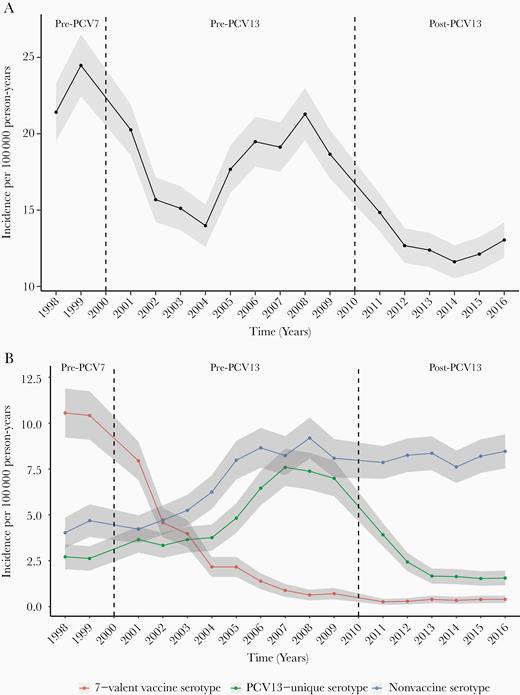
Incidence of invasive pneumococcal disease overall (A) and by vaccine and nonvaccine serotypes (B) over time—data from 20 counties in Tennessee, 1998–2016. Seven-valent pneumococcal conjugate vaccine (PCV7) serotypes include 4, 6B, 9V, 14, 18C, 19F, and 23F. Thirteen-valent pneumococcal conjugate vaccine (PCV13)–unique serotypes include 1, 3, 5, 6A, 7F, and 19A. All other serotypes were classified as nonvaccine serotypes. Eighteen percent of the observations had missing serotypes and were excluded from this analysis. The vertical dotted line in the year 2000 indicates the introduction of PCV7; the dotted line in the year 2010 indicates the introduction of PCV13. Incidence rates are presented across 3 time periods: prevaccination years (1998–1999), following PCV7 and before PCV13 introduction (2001–2009), and after introduction of PCV13 (2011–2016). The shaded area represents 95% confidence intervals. Abbreviations: PCV7, 7-valent pneumococcal conjugate vaccine; PCV13, 13-valent pneumococcal conjugate vaccine.
Before the introduction of either vaccine, overall incidence of IPD was greater in blacks (31.4 [95% CI, 28.4–34.4]), compared with whites (20.0 [95% CI, 18.4–21.6]) (Supplementary Table 2 and Figure 2). During the pre-PCV13 era, the overall IPD incidence rate for whites was 16.4 (95% CI, 15.8–17.0), compared with 24.7 (95% CI, 23.5–25.9) for blacks. During the post-PCV13 period, disparities in IPD incidence by race were reduced; the incidence rate for whites was 13.1 (95% CI, 12.5–13.7), compared with 15.0 (95% CI, 14.0–16.0) for blacks.
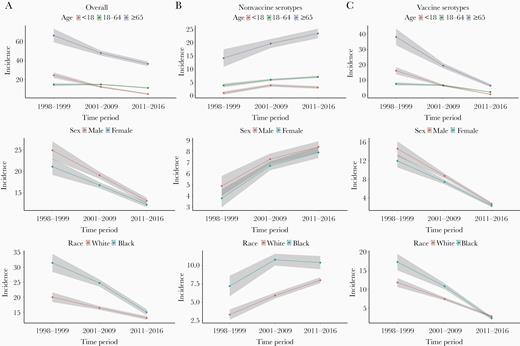
Incidence per 100 000 person-years of invasive pneumococcal disease over time by individual-level factors stratified by 13-valent pneumococcal conjugate vaccine (PCV13) and nonvaccine serotypes—data from 20 counties in Tennessee, 1998–2016. Vaccine serotypes include 1, 3, 4, 5, 6A, 6B, 7F, 9V, 14, 18C, 19A, 19F, and 23F. All other serotypes were classified as nonvaccine serotypes. Eighteen percent of the observations had missing serotypes and were excluded from this analysis. Although race is analyzed as 3 categories (white, black, and other), incidence rates for “Other” are not presented due to the small sample size. Incidence rates are presented across 3 time periods: prevaccination years (1998–1999), following 7-valent vaccine and before PCV13 introduction (2001–2009), and after introduction of PCV13 (2011–2016). The shaded area represents the 95% confidence intervals.
When stratifying incidence rates by serotypes, the incidence of PCV13-serotype IPD was 11.8 (95% CI, 10.6–13.0) for whites and 17.3 (95% CI, 15.1–19.5) for blacks in the pre-PCV7 period (Table 1). However, after the introduction of PCV13, incidence of PCV13-serotype IPD was greatly reduced in both groups (whites: 2.7 [95% CI, 2.4–3.0] and blacks: 2.2 [95% CI, 1.8–2.6]).
Annual Incidence Rates per 100 000 Person-Years of 13-Valent Pneumococcal Conjugate Vaccine Serotype Invasive Pneumococcal Disease by Demographic Characteristics Over Time—Data From 20 Counties in Tennessee, 1998–2016
| Characteristic | Pre-PCV7 (1998–1999) (n = 601) | Pre-PCV13 (2001–2009) (n = 2032) | Post-PCV13 (2011–2016) (n = 561) | ||||||
|---|---|---|---|---|---|---|---|---|---|
| Incidence (95% CI) | Rate Ratio (95% CI) | Rate Difference (95% CI) | Incidence (95% CI) | Rate Ratio (95% CI) | Rate Difference (95% CI) | Incidence (95% CI) | Rate Ratio (95% CI) | Rate Difference (95% CI) | |
| Age, y | |||||||||
| <18 | 16.2 (13.9–18.5) | … | … | 6.5 (5.9–7.1) | … | … | 0.8 (.6–1.0) | … | … |
| 18–64 | 7.6 (6.6–8.6) | 0.5 (.3–.7) | –8.6 (–11.1 to –6.1) | 6.7 (6.3–7.1) | 1 (.9–1.2) | 0.2 (–.5 to .9) | 2.3 (2.1–2.5) | 2.9 (2.5–3.3) | 1.5 (1.2–1.8) |
| ≥65 | 38.2 (32.8–43.6) | 2.4 (2–2.7) | 22 (16.1–27.9) | 19.5 (17.8–21.2) | 3 (2.7–3.3) | 13 (11.2–14.8) | 6.5 (5.5–7.5) | 8.1 (7–9.5) | 5.7 (4.7–6.7) |
| Sex | |||||||||
| Male | 14.5 (12.9–16.1) | … | … | 8.7 (8.2–9.2) | … | … | 2.7 (2.4–3.0) | … | … |
| Female | 11.9 (10.5–13.3) | 0.8 (.7–1) | –2.6 (–4.7 to –.5) | 7.4 (6.9–7.9) | 0.9 (.8–.9) | –1.3 (–2 to –.6) | 2.3 (2.0–2.6) | 0.9 (.7–1) | –0.4 (–.8 to 0) |
| Race | |||||||||
| White | 11.8 (10.6–13.0) | … | … | 7.4 (7.0–7.8) | … | … | 2.7 (2.4–3.0) | … | … |
| Black | 17.3 (15.1–19.5) | 1.5 (1.3–1.7) | 5.5 (3–8) | 10.8 (10.0–11.6) | 1.5 (1.3–1.6) | 3.4 (2.5–4.3) | 2.2 (1.8–2.6) | 0.8 (.7–1) | –0.5 (–1 to 0) |
| Other | 4.8 (1.8–7.8) | 0.4 (.2–.8) | –7 (–10.2 to –3.8) | 0.9 (.3–1.5) | 0.1 (.1–.3) | –6.5 (–7.2 to –5.8) | 0.1 (.0–.2) | 0 (0–.7) | –2.6 (–2.9 to –2.3) |
Statistics are presented only among nonmissing values.
Abbreviations: CI, confidence interval; PCV7, 7-valent pneumococcal conjugate vaccine; PCV13, 13-valent pneumococcal conjugate vaccine.
Census Tract–Level Socioeconomic Factors and IPD
IPD incidence rates (all serotypes) by selected indices of socioeconomic status are shown in Figure 3 and Supplementary Table 3. Neighborhoods with the highest percentage of poverty (≥20%) had the greatest overall incidence of IPD across all 3 periods: 33.0 (95% CI, 30.1–35.9) pre-PCV7, 22.8 (95% CI, 21.7–23.9) pre-PCV13, and 17.3 (95% CI, 16.3–18.3) post-PCV13, compared with neighborhoods with the lowest percentage of poverty during the corresponding periods. RII for poverty for all-serotype IPD decreased from 4.7 (95% CI, 3.7–6.0) pre-PCV7 to 3.0 (95% CI, 2.6–3.4) post-PCV13 (Supplementary Table 3). Restricting to PCV13-serotype IPD, incidence rates for census tracts with the highest and lowest percentage of poverty, respectively, were 17.8 (95% CI, 15.7–19.9) and 6.4 (95% CI, 4.9–7.9) pre-PCV7 and 3.1 (95% CI, 2.7–3.5) and 1.4 (95% CI, 1.0–1.8) post-PCV13 (Table 2).The RII post-PCV13 for percentage below poverty was 2.3 (95% CI, 1.7–3.1) for PCV13-serotype IPD and 3.9 (95% CI, 2.9–5.3) pre-PCV7. For nonvaccine-serotype IPD, the RII post-PCV13 for the percentage below poverty was 3.2 (95% CI, 2.7–3.9) and 13.5 (95% CI, 7.4–24.8) pre-PCV7.
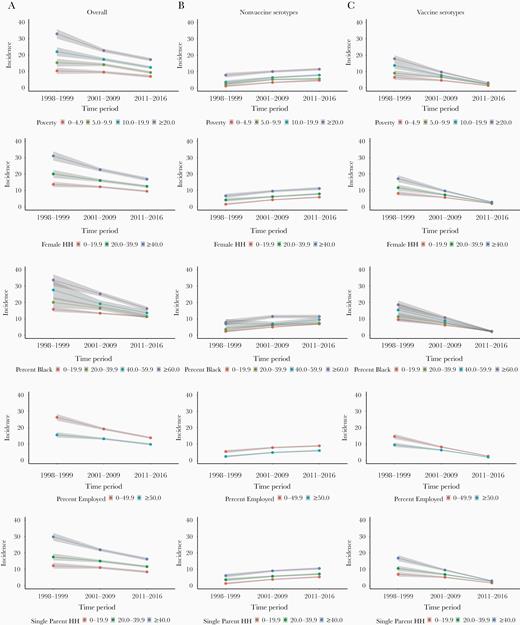
Incidence per 100 000 person-years of invasive pneumococcal disease over time by census-tract socioeconomic factors stratified by 13-valent pneumococcal conjugate vaccine (PCV13) and nonvaccine serotypes—data from 20 counties in Tennessee, 1998–2016. Vaccine serotypes include 1, 3, 4, 5, 6A, 6B, 7F, 9V, 14, 18C, 19A, 19F, and 23F. All other serotypes were classified as nonvaccine serotypes. Eighteen percent of the observations had missing serotypes and were excluded from this analysis. Incidence rates are presented across 3 time periods: prevaccination (1998–1999), following 7-valent vaccine and before PCV13 introduction (2001–2009), and after introduction of PCV13 (2011–2016). The shaded area represents the 95% confidence intervals.
Average Incidence Rates per 100 000 Person-Years and Relative Rates of 13-Valent Pneumococcal Conjugate Vaccine Serotype Invasive Pneumococcal Disease by Neighborhood-Level Socioeconomic Factors—Data From 20 Counties in Tennessee, 1998–2016
| Characteristic | Pre-PCV7 (1998–1999) (n = 601) | Pre-PCV13 (2001–2009) (n = 2032) | Post-PCV13 (2011–2016) (n = 561) | |||||||||
|---|---|---|---|---|---|---|---|---|---|---|---|---|
| Incidence (95% CI) | Rate Ratio (95% CI) | Rate Difference (95% CI) | RII (95% CI) | Incidence (95% CI) | Rate Ratio (95% CI) | Rate Difference (95% CI) | RII (95% CI) | Incidence (95% CI) | Rate Ratio (95% CI) | Rate Difference (95% CI) | RII (95% CI) | |
| Below poverty level, % | ||||||||||||
| <5 | 6.4 (4.9–7.9) | … | … | 3.9 (2.9–5.3) | 4.6 (4.1–5.1) | … | … | 2.5 (2.1–2.9) | 1.4 (1–1.8) | … | … | 2.3 (1.7–3.1) |
| 5–9.9 | 9 (7.3–10.7) | 1.4 (1.1–1.8) | 2.6 (.3–4.9) | … | 6.6 (6–7.2) | 1.4 (1.3–1.6) | 2 (1.2–2.8) | … | 2.1 (1.7–2.5) | 1.5 (1.2–1.9) | 0.7 (.2–1.2) | … |
| 10–19.9 | 13.7 (11.6–15.8) | 2.1 (1.8–2.6) | 7.3 (4.7–9.9) | … | 7.7 (7–8.4) | 1.7 (1.5–1.9) | 3.1 (2.3–3.9) | … | 2.4 (2.1–2.7) | 1.7 (1.4–2.1) | 1 (.5–1.5) | … |
| ≥20.0 | 17.8 (15.7–19.9) | 2.8 (2.4–3.2) | 11.4 (8.8–14) | … | 9.7 (9–10.4) | 2.1 (1.9–2.3) | 5.1 (4.2–6) | … | 3.1 (2.7–3.5) | 2.2 (1.8–2.7) | 1.7 (1.1–2.3) | … |
| Female-headed household, % | ||||||||||||
| <19.9 | 8.2 (6.9–9.5) | … | … | 3.2 (2.4–4.3) | 5.7 (5.3–6.1) | … | … | 2.3 (1.9–2.7) | 2 (1.7–2.3) | … | … | 1.7 (1.3–2.4) |
| 20–39.9 | 11.7 (9.9–13.5) | 1.4 (1.2–1.7) | 3.5 (1.3–5.7) | … | 7.3 (6.7–7.9) | 1.3 (1.2–1.4) | 1.6 (.9–2.3) | … | 2.4 (2.1–2.7) | 1.2 (1–1.4) | 0.4 (0–.8) | … |
| ≥40.0 | 17.2 (15.1–19.3) | 2.1 (1.8–2.4) | 9 (6.6–11.4) | … | 9.7 (9–10.4) | 1.7 (1.6–1.9) | 4 (3.2–4.8) | … | 2.9 (2.5–3.3) | 1.4 (1.2–1.7) | 0.9 (.4–1.4) | … |
| Employed, % | ||||||||||||
| <49.9 | 14.6 (13.1–16.1) | … | … | 2.4 (1.7–3.3) | 8.2 (7.7–8.7) | … | … | 1.7 (1.4–2) | 2.6 (2.3–2.9) | … | … | 1.7 (1.2–2.4) |
| ≥50.0 | 9.5 (8.2–10.8) | 0.7 (.5–.8) | –5.1 (–7 to –3.2) | … | 6.3 (5.9–6.7) | 0.8 (.7–.8) | –1.9 (–2.5 to –1.3) | … | 2 (1.7–2.3) | 0.8 (.6–.9) | –0.6 (–1 to –.2) | … |
| Single parent–headed household, % | ||||||||||||
| <19.9 | 6.9 (5.5–8.3) | … | … | 3.9 (2.8–5.3) | 5.1 (4.6–5.6) | … | … | 2.5 (2.1–3) | 1.6 (1.3–1.9) | … | … | 2.2 (1.6–3) |
| 20–39.9 | 10.5 (8.9–12.1) | 1.5 (1.2–1.9) | 3.6 (1.5–5.7) | … | 6.8 (6.3–7.3) | 1.3 (1.2–1.5) | 1.7 (1–2.4) | … | 2.5 (2.2–2.8) | 1.6 (1.3–1.9) | 0.9 (.5–1.3) | … |
| ≥40.0 | 16.8 (15–18.6) | 2.4 (2.1–2.8) | 9.9 (7.6–12.2) | … | 9.5 (8.9–10.1) | 1.9 (1.7–2) | 4.4 (3.6–5.2) | … | 2.9 (2.5–3.3) | 1.8 (1.5–2.1) | 1.3 (.8–1.8) | … |
| Black or African American alonea, % | ||||||||||||
| <19.9 | 9.5 (8.3–10.7) | … | … | 2.9 (2.1–3.9) | 6.1 (5.7–6.5) | … | … | 2.4 (2–2.8) | 2.4 (2.2–2.6) | … | … | 0.9 (.7–1.3) |
| 20–39.9 | 11.3 (9–13.6) | 1.2 (.9–1.5) | 1.8 (–.8 to 4.4) | … | 7.3 (6.5–8.1) | 1.2 (1.1–1.4) | 1.2 (.3–2.1) | … | 2.1 (1.6–2.6) | 0.9 (.7–1.2) | –0.3 (–.9 to .3) | … |
| 40–59.9 | 15.4 (11.3–19.5) | 1.6 (1.2–2.1) | 5.9 (1.6–10.2) | … | 8.8 (7.4–10.2) | 1.4 (1.2–1.7) | 2.7 (1.2–4.2) | … | 2.3 (1.6–3) | 1 (.7–1.3) | –0.1 (–.9 to .7) | … |
| ≥60.0 | 18.6 (16–21.2) | 2 (1.7–2.3) | 9.1 (6.3–11.9) | … | 10.7 (9.8–11.6) | 1.8 (1.6–1.9) | 4.6 (3.6–5.6) | … | 2.4 (1.9–2.9) | 1 (.8–1.3) | 0 (–.6 to .6) | … |
An RII >1 with CIs that do not include 1 would indicate a statistically significant increased risk for invasive pneumococcal disease for the most impoverished group.
Abbreviations: CI, confidence interval; PCV7, 7-valent pneumococcal conjugate vaccine; PCV13, 13-valent pneumococcal conjugate vaccine; RII, relative index of inequality.
aPercentage Black or African American alone indicates the percentage of the population that reported only black/African American as their race.
PCV13-serotype IPD incidence rates for the most impoverished groups of every socioeconomic factor analyzed decreased over time, whereas nonvaccine-serotype IPD incidence rates increased over time. Using a measure of rate differences, there was a greater reduction in the disparity gap over time between the most and least impoverished groups for all socioeconomic factors for PCV13-serotype IPD incidence when compared to nonvaccine-serotype IPD incidence (Table 2 and Figure 3). Despite the reduction, the highest PCV13- and nonvaccine-serotype IPD incidence rates were associated with neighborhoods with the highest percentage of households below poverty, highest percentage of female-headed households, highest percentage of people who are black, highest percentage of single parent–headed households, and lowest percentage of adult residents employed. Concentration curves and the corresponding concentration indexes to quantify socioeconomic disparities are presented in Supplementary Figure 1. The concentration index for percentage below poverty for PCV13-serotype IPD decreased from 0.20 pre-PCV7 to 0.12 post-PCV13, signifying a reduction in disparities by poverty after the introduction of PCV13.
DISCUSSION
Using population-based surveillance data from 20 counties in Tennessee collected through active surveillance during 1998–2016, we were able to document that both individual-level factors and neighborhood-level socioeconomic factors were associated with substantial disparities in IPD incidence before the introduction of PCV13. The introduction of PCV13 was associated with a strikingly reduced incidence of IPD, also markedly reducing socioeconomic and racial disparities in the occurrence of PCV13-serotype IPD in the population studied regardless of the disparity measure used.
Black race was associated with higher incidence of overall IPD pre-PCV13. Racial disparities in IPD decreased substantially over time, with the reduction being evident for PCV13-serotype disease. PCV13 introduction was associated with the prevention of IPD in the overall population and with decreasing disparities in IPD over time between people who are black and people who are white. Here, we used individual-level race to study racial disparities in IPD. Analysis using the percentage of the population that is black in the census tract also supports racial disparities being markedly reduced post-PCV13. Although neighborhood-level variables obtained from the census act as proxies for individual-level variables, variables such as race are well suited for being estimated from neighborhood level characteristics because racially segregated neighborhoods persist in many US regions [30].
Among socioeconomic factors, neighborhood poverty level was associated with significant disparities in IPD incidence for both vaccine and nonvaccine serotypes. The slight reduction in disparities for nonvaccine-serotype IPD may be indicative of reduction of other risk factors such as smoking, or better treatments for underlying conditions. When using rate differences as a disparity measure, the disparity between the least and most impoverished group for all socioeconomic measures is minimized for PCV13-serotype IPD whereas it remains constant for nonvaccine-serotype IPD over time, which may be an artifact of the measure used. This difference in interpretation emphasizes the need to report both relative and absolute measures for a complete picture of study results. The reduction in RII for poverty for overall IPD incidence over time indicates that, though the risk of IPD is still the greatest among the most impoverished, introduction of PCV13 was associated with reductions in racial and socioeconomic disparities in IPD incidence. These results are consistent with findings from studies of disparities in IPD after the introduction of PCV7 [15, 31, 32] and reinforce the importance of examining both individual-level and neighborhood-level characteristics as factors influencing disparities in health.
Although the incidence in nonvaccine-serotype IPD is the highest in neighborhoods that are socioeconomically most deprived, disparities in vaccine-serotype IPD incidence were found to be at an all-time low post-PCV13, compared to the pre-PCV7 and pre-PCV13 periods. Despite the high average cost per dose of PCV13 and PCV7, $105.86 and $75.01 in the public sector, respectively [33], both the reduction of socioeconomic disparities in PCV13-serotype IPD incidence and the reduced incidence of IPD over time highlight the effectiveness of PCV13 and its sustained public health benefit. Approximately 90 distinct pneumococcal serotypes have been identified throughout the world, of which 13 serotypes are targeted by PCV13 [34]. Except for serotype 6C, which is reported to have some cross-protection from serotype 6A antigen, PCV13 generally does not protect against IPD from serotypes that are not included in the vaccine. Therefore, future conjugate vaccines incorporating these nonvaccine serotypes present opportunities to further reduce disease and disparities.
Evaluating both individual-level and neighborhood-level characteristics as drivers for disparities in health is important because both play a role in health [35]. Detailed socioeconomic information is not routinely captured in surveillance data; however, publicly available neighborhood-level socioeconomic factors documented in the American Community Survey offer the potential to address questions related to the role of contextual factors and disparities in health [36, 37]. These factors may act partially or entirely as proxies for individual attributes and may interact with demographic and environmental factors to impact health. To elucidate the effect of socioeconomic factors and disparities on IPD incidence, we used neighborhood-level characteristics as proxies for individual socioeconomic characteristics by geocoding data. The ability to use geocodes to link population-based surveillance data to area-based socioeconomic measures collected through the US Census Bureau offers an effective and efficient approach to monitor disparities in health. We used 5 different neighborhood-level socioeconomic indicators: percentage living below poverty, female-headed household, employed, single parent–headed household, and black or African American race. We estimated these characteristics at the census tract level, which is most attuned to capturing economic deprivation [38]. Our data were obtained from 20 different counties in Tennessee over a period of 19 years, which captures the pre-PCV7, pre-PCV13, and post-PCV13 periods and enabled us to evaluate stable trends.
Notwithstanding the above-mentioned unique features of our analyses, this study has several limitations. The results may be subject to ecologic fallacy because neighborhood-level data were used to evaluate the association between socioeconomic factors and individual cases of IPD [39]. However, in the absence of individual-level socioeconomic factors, proxy characteristics obtained from the American Community Survey remain a promising solution to study healthcare inequities [37]. Our data include cases only from 20 counties in Tennessee, which may be different in terms of socioeconomic characteristics compared to the other 75 counties that were not in the surveillance area (Supplementary Table 4). Hence, one must be cautious regarding the generalizability of the results. Disparity measures computed here are univariate in nature and do not allow us to evaluate the simultaneous contributions of both individual and census tract–based determinants on IPD or other confounding factors that come into play. Disparities in health can seldom be explained solely on the basis of neighborhood-level characteristics, such as poverty or income, but are often based on an interaction between individual- and neighborhood-level factors. Last, expansion of the surveillance area over time and shifting demographics may have an impact on the results.
In conclusion, the overall incidence of IPD was reduced with the introduction of PCV13. In addition, the introduction of PCV13 was associated with reductions in racial and socioeconomic disparities in IPD incidence. No studies have described the impact of PCV13 on socioeconomic disparities in IPD rates. Our results describe a major public health success and provide powerful reinforcement that vaccines play a key role in controlling and eliminating disease. Similar patterns observed over the 19-year study period and estimated using different socioeconomic factors and measures of disparities strengthen our results. However, individual-level and socioeconomic disparities persisted more for nonvaccine-serotype IPD, supporting the introduction of more inclusive higher-valency pneumococcal conjugate vaccines to further reduce disease and disparities.
Supplementary Data
Supplementary materials are available at The Journal of Infectious Diseases online. Consisting of data provided by the authors to benefit the reader, the posted materials are not copyedited and are the sole responsibility of the authors, so questions or comments should be addressed to the corresponding author.
Notes
Acknowledgments. We thank everyone in the Active Bacterial Core surveillance areas who are involved in surveillance and maintenance of the system at the Tennessee site. We also thank the laboratorians and technicians who isolate the Active Bacterial Core surveillance pathogens and make it possible to track these infections and the surveillance and laboratory personnel at the Centers for Disease Control and Prevention (CDC) for their careful work characterizing the isolates. We would also like to acknowledge Brenda Barnes, RN, CCRP, of the Active Bacterial Core surveillance team.
Disclaimer. The findings and conclusions in this report are those of the authors and do not necessarily represent the official position of the CDC.
Financial support. This study was supported in part by the CDC Emerging Infections Program (cooperative agreement number 1U50CK000491).
Potential conflicts of interest. H. K. T. has received research funding from Sanofi Pasteur and has served on a safety advisory board for Seqirus. W. S. has been a member of data safety monitoring boards for Pfizer and Merck and has provided consultation for Roche Diagnostics. All other authors report no potential conflicts of interest.
All authors have submitted the ICMJE Form for Disclosure of Potential Conflicts of Interest. Conflicts that the editors consider relevant to the content of the manuscript have been disclosed.

