


Abstract
The current study was performed to evaluate risk factors for severe coronavirus disease 2019 (COVID-19) outcomes among Medicare beneficiaries during the pandemic’s early phase.
In a retrospective cohort study covering Medicare fee-for-service beneficiaries, we separated out elderly residents in nursing homes (NHs) and those with end-stage renal disease (ESRD) from the primary study population of individuals age ≥65 years. Outcomes included COVID-19 hospital encounters and COVID-19-associated deaths. We estimated adjusted odds ratios (ORs) using logistic regression.
We analyzed 25 333 329 elderly non-NH beneficiaries without ESRD, 653 966 elderly NH residents, and 292 302 patients with ESRD. COVID-related death rates (per 10 000) were much higher among elderly NH residents (275.7) and patients with ESRD (60.8) than in the primary study population (5.0). Regression-adjusted clinical predictors of death among the primary population included immunocompromised status (OR, 1.43), frailty index conditions such as cognitive impairment (3.16), and other comorbid conditions, including congestive heart failure (1.30). Demographic-related risk factors included male sex (OR, 1.77), older age (3.09 for 80- vs 65-year-olds), Medicaid dual-eligibility status (2.17), and racial/ethnic minority. Compared with whites, ORs were higher for blacks (2.47), Hispanics (3.11), and Native Americans (5.82). Results for COVID-19 hospital encounters were consistent.
Frailty, comorbid conditions, and race/ethnicity were strong risk factors for COVID-19 hospitalization and death among the US elderly.
The first case of coronavirus disease 2019 (COVID-19) was reported in China in December 2019 [1]. From 21 January through 23 February 2020, public health agencies detected 14 US COVID-19 cases, all related to travel from China [2, 3]. Although the first non–travel-related US case was confirmed on 26 February in a California resident who had become ill on 13 February, the prior occurrence of 3 cases in California confirm the cryptic circulation of the virus by early February [2–4]. On 13 March, the United States declared a national emergency [2]. Shortly thereafter, the United States became the country with the highest number of reported cases and deaths worldwide [1]. Given the ongoing pandemic, more evidence on the risk factors associated with COVID-19 and severe COVID-related outcomes is needed for filling our knowledge gap of the disease and on ways to reduce its burden on public health [3].
Multiple analyses in the United States and abroad have suggested that race, social disparities, old age, and underlying health conditions were associated with a higher risk of COVID-related severe outcomes, including hospitalizations and deaths [3, 5–12]. The findings highlighted the need for an in-depth investigation. Our objective was to use Medicare claims data to evaluate risk factors for COVID-19 hospitalizations and deaths among Medicare beneficiaries. We also sought to investigate the specific interconnected effects between age, socioeconomic conditions, frailty, and race to understand their associations with the risk of severe COVID-19 outcomes.
METHODS
Data Sources
Medicare is a federally funded health insurance program that provides coverage for people aged ≥65 years, as well as those with disability and/or end-stage renal disease (ESRD), regardless of age. We used Medicare Part A (hospital inpatient care) and B (outpatient medical care) claims to evaluate beneficiaries’ health histories and used claims from the Shared Systems Data, a database updated daily with processed claims allowing for rapid outcome detection and near real-time analysis. We obtained beneficiaries’ demographics and enrollment information from Centers for Medicare and Medicaid Services Enrollment Database, the Common Medicare Environment, and Master Beneficiary Summary File. We used the Minimum Data Set to ascertain Medicare beneficiaries’ nursing home (NH) residence status, American Community Survey data to assess population density, and area deprivation index (ADI) data to assess the socioeconomic deprivation of beneficiaries’ place of residence [13].
Study Period, Population, and Outcomes
The beginning date of the study was 1 April 2020, because the International Classification of Diseases, Tenth Revision, Clinical Modification (ICD-10-CM) diagnosis code specific for COVID-19 (U07.1) became effective on this date, and COVID-19 coding practices were not standardized before then. The population included Medicare beneficiaries who were continuously enrolled in the Medicare Parts A and B fee-for-service program for ≥6 months before the beginning of the study and who did not have any COVID-related hospitalizations (ICD-10-CM diagnosis code U07.1 or B97.29) during this period. We stratified beneficiaries into 3 mutually exclusive populations: elderly NH residents, patients with ESRD (of all ages), and the general elderly population. We considered beneficiaries as elderly NH residents if they were aged ≥65 years at the beginning of the study, resided in a NH anytime in the previous 6 months, and had no records suggesting official discharge. We defined beneficiaries with ESRD as those with ≥1 dialysis facility claim and with no indication of acute kidney injury in the 3 months before the beginning of the study. The primary study population were beneficiaries aged ≥65 years who were not NH residents and who did not have ESRD (general elderly); a detailed report on elderly NH residents will be the subject of a follow-up publication.
Outcomes included COVID-19 hospitalizations, COVID-related deaths, and COVID-related hospitalization complications, including intensive care unit/coronary care unit (ICU/CCU) admission, ventilator use, inpatient renal replacement therapy, and inpatient death. We defined incident COVID-19 hospitalizations as those with an inpatient discharge diagnosis of COVID-19 (diagnosis code U07.1) and an admission date between 1 April and 8 May 2020. In addition, eligible case patients must not have had a previous potential COVID-19 hospitalization (with diagnosis code U07.1 or B97.29) in the 6 months before the study begin date. We defined COVID-related deaths as deceased patients with a prior COVID-19 discharge diagnosis on a facility claim or ≥2 professional service claims with a COVID-19 diagnosis code within 21 days of the death date. The facility claim or professional service claim immediately preceding the death date must have occurred during the study period of 1 April to 8 May 2020.
Covariates
We assessed demographic and socioeconomic characteristics using enrollment data, chronic conditions using ICD-10-CM diagnosis codes, specific therapies and treatments using the International Classification of Diseases, Tenth Revision, Procedure Coding System codes, and Healthcare Common Procedure Coding System codes on inpatient and outpatient claims (including influenza vaccination) in the 6 months before the study’s beginning date. We calculated county-level COVID-19 circulation rates among Medicare beneficiaries using COVID-19 diagnoses in any setting. The ADI rank, a scale of 1–100 measuring relative socioeconomic disadvantage, with higher ADI score indicating more socioeconomic disadvantage, was assessed using beneficiaries’ residence information at the census block group level [13]. We assessed the effects of frailty on COVID-related outcomes, using individual clinical conditions and health service use from the frailty index, a composite score measuring the probability that a person is frail [14, 15], and immunocompromised status, using administrative codes indicating the presence of immunocompromising conditions or use of immunosuppressive therapies [16].
Statistical Analysis
We calculated COVID-19 hospitalization and COVID-related death rates among all eligible beneficiaries, and the proportions of complications during COVID-19 hospitalization among those who were hospitalized. We summarized proportions of COVID-related deaths and COVID-19 hospitalizations overall and stratified by covariates of interest among the primary study population. We also used multivariate logistic regression models to estimate differences in odds ratios (ORs) and 95% confidence intervals (CIs) of the study outcomes. We modeled continuous variables, such as age and ADI rank, using natural splines to approximate their nonlinear effects, and log-transformed COVID-19 circulation rates and population density to normalize their distribution and allow for easier interpretation of their effects; we included 2-way interaction terms of age, Medicare-Medicaid dual eligibility and race. We also performed analyses in which (1) the individual conditions from the frailty index were substituted with a continuous composite score and (2) an alternative classification of race/ethnicity was used. We derived the alternative race/ethnicity classification using an algorithm combining beneficiaries’ last name and residence information, mainly oriented toward the identification of Hispanics and Asian/Pacific Islanders [17, 18].
RESULTS
Overall COVID-Related Outcome Summary
The study analyzed a total of 30 284 193 Medicare fee-for-service–enrolled beneficiaries. Among the 3 study populations of interest, COVID-19 hospitalization and death rates were the highest among the 653 966 elderly NH residents, with 19 637 hospitalizations (300.3 hospitalized cases per 10 000 beneficiaries) and 18 028 deaths (275.7 per 10 000), followed by the 292 302 beneficiaries with ESRD, with 4503 hospitalizations (154.1 per 10 000) and 1777 deaths (60.8 per 10 000). The primary study population consisted of 25 333 329 beneficiaries. Among this group, 27 961 were hospitalized with COVID-19 (11.0 per 10 000), and 12 613 died with a prior COVID-19 diagnosis (5.0 per 10 000). Among the 27 961 hospitalized with COVID-19, 21.9% were admitted to an ICU/CCU, 16.6% were ventilated, and 26.1% died at the hospital (Table 1). Of all 12 613 COVID-related deaths, approximately 33.9% did not occur in the hospital and 20.3% were deaths after a hospital discharge, often occurring in hospice or NH facilities (Supplementary Table 1).
Summary of Coronavirus Disease 2019 Hospitalization and Death Rates and Proportions of Inpatient Complications
| Summary | General Elderly Population (n = 25 333 329) | Elderly NH Population (n = 653 966) | ESRD Population (n = 292 302) |
|---|---|---|---|
| Age, median, y | 73 | 85 | 65 |
| Sex, no. (%) | |||
| Female | 14 095 346 (55.6) | 437 379 (66.9) | 127 180 (43.5) |
| Male | 11 237 983 (44.4) | 216 587 (33.1) | 165 122 (56.5) |
| Severe COVID-19 outcome, no. (rate per 10 000) | |||
| COVID-19–related deaths | 12 613 (5.0) | 18 028 (275.7) | 1777 (60.8) |
| COVID-19–related hospitalizations | 27 961 (11.0) | 19 637 (300.3) | 4503 (154.1) |
| Hospitalization-related outcomes, no. (% of hospitalized) | |||
| ICU/CCU admission | 6132 (21.9) | 4719 (24.0) | 1184 (26.3) |
| Ventilator use/ECMO | 4646 (16.6) | 2946 (15.0) | 842 (18.7) |
| Inpatient renal replacement therapy | 985 (3.5) | 1529 (7.8) | 3744 (83.1) |
| Inpatient death | 7 286 (26.1) | 6996 (35.6) | 1135 (25.2) |
Abbreviations: CCU, coronary care unit; COVID-19, coronavirus disease 2019; ECMO, extracorporeal membrane oxygenation; ESRD, end-stage renal disease; ICU, intensive care unit; NH, nursing home.
Demographic, Socioeconomic, and Health Status Characteristics
Table 2 summarizes the demographics, socioeconomic status characteristics, and health status of the primary study population. Among them, more than half were between the ages of 65 and 74 years (55.8%), and more than half were female (55.6%). Most were white (85.1%), not dual eligible for Medicaid (90.6%), and qualified for Medicare because of age (90.5%). Beneficiaries who died with a prior COVID-19 diagnosis were disproportionately older, compared with the overall population (≥85 years old, 44.5% vs 12.6%), male (51.5% vs 44.4%), and nonwhite (27.6% vs 14.9%). They were also more likely to be dual eligible (29.0% vs 9.4%) and to have qualified for Medicare owing to disability (14.1% vs 9.5%). Beneficiaries hospitalized with COVID-19 and those who died had similar demographic and socioeconomic characteristics.
Distribution of Demographic, Socioeconomic, and Health Status Characteristics of the Primary Study Population, by Coronavirus Disease 2019–Related Outcome Status
| Proportion of Beneficiaries, % | |||
|---|---|---|---|
| Covariate | All Beneficiaries (25 333 329) | COVID-19–Related Death (12 613) | COVID-19 Hospitalization (27 961) |
| Age group, y | |||
| 65–69 | 28.2 | 9.8 | 16.9 |
| 70–74 | 27.6 | 13.0 | 18.6 |
| 75–79 | 19.0 | 15.3 | 17.4 |
| 80–84 | 12.6 | 17.5 | 16.8 |
| ≥85 | 12.6 | 44.5 | 30.3 |
| Sex | |||
| Female | 55.6 | 48.5 | 51.2 |
| Male | 44.4 | 51.5 | 48.8 |
| Race/ethnicity | |||
| White | 85.1 | 72.4 | 67.3 |
| Black | 6.7 | 16.0 | 20.1 |
| Hispanic | 1.6 | 4.5 | 4.9 |
| Asian | 2.1 | 2.6 | 2.8 |
| North American Native | 0.5 | 0.9 | 0.9 |
| Other/unknown | 4.1 | 3.6 | 4.0 |
| Medicaid dual eligibility | |||
| Non–dual eligible | 90.6 | 71.0 | 69.6 |
| Dual eligible | 9.4 | 29.0 | 30.4 |
| ADI rank category | |||
| 1–10 | 11.8 | 21.8 | 19.2 |
| 11–20 | 12.0 | 18.7 | 17.6 |
| 21–30 | 12.4 | 12.7 | 12.2 |
| 31–40 | 11.7 | 9.1 | 9.6 |
| 41–50 | 11.0 | 7.0 | 7.4 |
| 51–60 | 10.0 | 5.6 | 6.1 |
| 61–70 | 9.1 | 5.0 | 5.7 |
| 71–80 | 8.0 | 4.5 | 5.0 |
| 81–90 | 6.6 | 4.8 | 5.2 |
| 91–100 | 4.3 | 8.0 | 9.2 |
| Missing | 3.1 | 2.9 | 2.9 |
| Reason for entering Medicare | |||
| Aged in without ESRD | 90.5 | 85.9 | 83.2 |
| Disabled without ESRD | 9.4 | 13.8 | 16.4 |
| Aged in with ESRD | 0.0 | 0.0 | 0.0 |
| Disabled with ESRD | 0.0 | 0.0 | 0.0 |
| ESRD only | 0.1 | 0.3 | 0.3 |
| COVID-19 circulation rate by county | |||
| 1st Quartile | 12.6 | 0.9 | 1.1 |
| 2nd Quartile | 16.0 | 2.5 | 2.8 |
| 3rd Quartile | 23.1 | 7.0 | 7.1 |
| 4th Quartile | 47.3 | 88.2 | 87.6 |
| Data missing | 1.0 | 1.5 | 1.4 |
| Population density by countya | |||
| 1–10 | 2.4 | 0.6 | 0.6 |
| 10–50 | 11.7 | 3.0 | 3.2 |
| 50–100 | 10.5 | 3.1 | 3.4 |
| 100–500 | 31.1 | 13.0 | 13.1 |
| 500–1000 | 12.5 | 9.5 | 9.5 |
| ≥1000 | 30.7 | 69.4 | 68.7 |
| Missing | 1.0 | 1.5 | 1.4 |
| State of residenceb | |||
| California | 8.9 | 3.1 | 3.4 |
| Connecticut | 1.0 | 2.8 | 3.1 |
| Florida | 6.9 | 2.8 | 2.7 |
| Illinois | 4.3 | 5.5 | 6.1 |
| Indiana | 2.2 | 1.7 | 1.7 |
| Massachusetts | 2.6 | 7.7 | 7.3 |
| Maryland | 2.5 | 3.6 | 3.3 |
| Maine | 0.5 | 0.1 | 0.1 |
| Michigan | 2.8 | 5.4 | 6.0 |
| New Jersey | 3.0 | 13.8 | 11.4 |
| New York | 5.2 | 26.5 | 27.0 |
| Pennsylvania | 4.0 | 4.8 | 4.7 |
| Influenza vaccination status | |||
| Standard dose adjuvanted (FLUAD) | 7.1 | 6.9 | 6.5 |
| High dose (Fluzone High-Dose) | 22.8 | 20.9 | 20.8 |
| Other influenza vaccine or administration code | 40.9 | 42.9 | 41.9 |
| Presence of medical condition | |||
| Diabetes | 23.5 | 41.6 | 42.8 |
| Obesity | 15.9 | 18.0 | 21.4 |
| Hypertension | 58.3 | 78.7 | 77.3 |
| Hospitalized for stroke or TIA | 0.3 | 1.5 | 1.2 |
| Coronary revascularization | 0.5 | 0.9 | 0.8 |
| Atrial fibrillation | 11.4 | 24.7 | 20.4 |
| Congestive heart failure | 8.0 | 28.2 | 22.6 |
| Hospitalized for AMI | 0.4 | 1.7 | 1.2 |
| Other cerebrovascular disease | 6.4 | 14.8 | 13.2 |
| COPD | 9.4 | 20.5 | 18.5 |
| Asthma without COPD | 3.8 | 3.8 | 4.9 |
| Interstitial lung disease | 1.3 | 3.3 | 2.5 |
| Hypersensitivity pneumonitis | 0.2 | 0.4 | 0.3 |
| Bronchiectasis | 0.7 | 1.4 | 1.3 |
| Chronic liver disease | 2.3 | 3.3 | 3.7 |
| Neurological or neurodevelopmental conditions | 4.5 | 16.6 | 14.4 |
| Frailty index | |||
| 0–0.2 | 85.2 | 37.0 | 52.4 |
| 0.2–0.4 | 11.3 | 31.3 | 26.8 |
| 0.4–0.6 | 2.7 | 19.4 | 13.4 |
| 0.6–0.8 | 0.7 | 10.1 | 6.3 |
| 0.8–1 | 0.1 | 2.1 | 1.2 |
| Frailty conditions | |||
| Impaired mobility | 0.2 | 2.4 | 1.8 |
| Depression | 11.8 | 27.2 | 24.2 |
| Parkinson disease | 1.2 | 4.9 | 3.7 |
| Arthritis | 22.3 | 32.9 | 32.0 |
| Cognitive impairment | 4.8 | 37.6 | 25.6 |
| Paranoia | 0.7 | 6.9 | 5.9 |
| Chronic skin ulcer | 2.1 | 11.2 | 8.4 |
| Skin and soft-tissue infection | 4.3 | 11.2 | 9.7 |
| Mycoses | 9.9 | 37.7 | 31.6 |
| Gout | 3.7 | 7.3 | 6.6 |
| Falls | 3.0 | 13.6 | 10.6 |
| Musculoskeletal problems | 39.9 | 53.0 | 51.8 |
| Urinary tract infection | 8.9 | 25.8 | 21.7 |
| Pneumonia | 3.0 | 17.6 | 14.5 |
| Charlson Comorbidity Score >0 | 32.6 | 59.1 | 56.8 |
| Hospital admission in past 6 months | 7.7 | 32.6 | 28.1 |
| Immunocompromised status | |||
| Yes | 3.4 | 8.1 | 6.9 |
| No | 96.6 | 91.9 | 93.1 |
Abbreviation: ADI, area deprivation index; AMI, acute myocardial infarction; COVID-19, coronavirus disease 2019; ESRD, end-stage renal disease; TIA, transient ischemic attack.
aPopulation density measured as number of persons per square mile.
bStates with the highest proportions of COVID-related deaths and COVID-19 hospitalizations displayed.
Common preexisting comorbid conditions among the study population included hypertension, diabetes, obesity, frailty-related conditions (eg, musculoskeletal problems), respiratory diseases (eg, chronic obstructive pulmonary disease [COPD]), and cardiovascular diseases (eg, atrial fibrillation). Prevalence of these conditions was often higher among those who died or were hospitalized with COVID-19 than in the overall primary study population. Both COVID-19 deaths and hospitalizations were disproportionately distributed in areas with high COVID-19 circulation rates and high population density and in known early outbreak centers, including New York, New Jersey, Massachusetts, Illinois, and Michigan.
COVID-19 Hospitalization and Death Risk Factors
Of the 25 333 329 beneficiaries in the primary study population, 24 367 476 beneficiaries with complete demographic and residence information were included in the logistic regression analysis. In assessing the association of COVID-related death and COVID-19 hospitalization with potential risk factors, the study found elevated risk of COVID-related outcomes among those who were older, male, dual eligible for Medicaid, disabled and those who had specific health-related risk factors (Table 3).
Logistic Regression Model Results Assessing Potential Risk Factors for Coronavirus Disease 2019–Related Hospitalization and Death in the Primary Study Population
| OR (CI) | ||
|---|---|---|
| Covariates | COVID-19–Related Death | COVID-19 Hospitalization |
| Male sex (reference: female) | 1.77 (1.71–1.84) | 1.48 (1.45–1.52) |
| Aged into Medicare (reference: not aged into Medicare) | 0.72 (.68–.76) | 0.74 (.72–.77) |
| ADI national rank (reference: ADI of 1) | ||
| 50 | 0.97 (.91–1.03) | 1.08 (1.04–1.12) |
| 100 | 1.09 (1.00–1.18) | 1.23 (1.16–1.29) |
| Logged COVID-19 circulation rate per 100 000a (change by 2×) | 1.98 (1.94–2.01) | 1.94 (1.92–1.96) |
| Logged population density by countyb (change by 2×) | 1.00 (.99–1.01) | 1.02(1.01–1.03) |
| Influenza vaccination status (reference: nonvaccinated) | ||
| Standard-dose inactivated vaccine (FLUAD) | 1.04 (.96–1.11) | 1.01 (.96–1.06) |
| High-dose inactivated vaccine (Fluzone High-Dose) | 0.91 (.87–.95) | 0.95 (.92–.98) |
| Other influenza vaccine or administration code | 1.05 (1.00–1.10) | 1.05 (1.01–1.09) |
| Presence of medical conditionsc | ||
| Hypertension | 1.02 (.97–1.07) | 1.13 (1.09–1.16) |
| Obesity | 1.10 (1.05–1.16) | 1.16 (1.13–1.20) |
| Diabetes | 1.23 (1.18–1.29) | 1.28 (1.24–1.32) |
| Hospitalized for stroke or TIA | 1.07 (.91–1.25) | 0.94 (.84–1.06) |
| Coronary revascularization | 1.03 (.85–1.26) | 0.86 (.74–1.00) |
| Atrial fibrillation | 0.97 (.92–1.01) | 0.98 (.95–1.01) |
| Congestive heart failure | 1.30 (1.23–1.36) | 1.15 (1.11–1.19) |
| Hospitalized for AMI | 0.99 (.85–1.16) | 0.89 (.79–1.00) |
| Other cerebrovascular disease | 0.90 (.85–.95) | 0.91 (.87–.94) |
| COPD | 1.14 (1.08–1.20) | 1.10 (1.06–1.14) |
| Asthma without COPD | 0.93 (.85–1.03) | 1.06 (1.00–1.13) |
| Interstitial lung disease | 1.08 (.97–1.20) | 0.95 (.88–1.03) |
| Hypersensitivity pneumonitis | 1.11 (.83–1.48) | 1.00 (.81–1.25) |
| Bronchiectasis | 0.85 (.73–1.00) | 0.89 (.80–.99) |
| Chronic liver disease | 1.07 (.97–1.19) | 1.07 (1.00–1.14) |
| Neurological or neurodevelopmental conditions | 1.08 (1.02–1.14) | 1.14 (1.10–1.19) |
| Frailty conditions | ||
| Impaired mobility | 1.45 (1.29–1.65) | 1.40 (1.27–1.54) |
| Depression | 1.32 (1.26–1.38) | 1.26 (1.22–1.30) |
| Parkinson disease | 1.27 (1.17–1.39) | 1.23 (1.15–1.32) |
| Arthritis | 0.97 (.93–1.01) | 0.99 (.97–1.02) |
| Cognitive impairment | 3.16 (3.02–3.31) | 2.24 (2.16–2.32) |
| Paranoia | 1.66 (1.54–1.80) | 1.63 (1.54–1.73) |
| Chronic skin ulcer | 1.12 (1.05–1.20) | 1.06 (1.01–1.11) |
| Skin and soft-tissue infection | 1.13 (1.06–1.20) | 1.12 (1.07–1.17) |
| Mycoses | 1.57 (1.51–1.64) | 1.47 (1.43–1.51) |
| Gout | 1.06 (.99–1.14) | 1.02 (.97–1.07) |
| Falls | 1.37 (1.30–1.46) | 1.36 (1.31–1.42) |
| Musculoskeletal problems | 0.96 (.92–1.00) | 1.01 (.98–1.03) |
| Urinary tract infection | 1.22 (1.17–1.28) | 1.19 (1.15–1.23) |
| Pneumonia | 1.89 (1.79–2.00) | 1.94 (1.86–2.02) |
| Charlson Comorbidity Index >0 | 1.08 (1.03–1.14) | 1.09 (1.06–1.13) |
| Hospital admission in past 6 mo | 1.43 (1.35–1.51) | 1.55 (1.49–1.61) |
| Immunocompromised status (reference: nonimmunocompromised) | 1.43 (1.34–1.53) | 1.24 (1.18–1.30) |
| Estimated overall interaction effects of age, dual eligibility, and raced | ||
| Age 80 vs 65 y | 3.09 (2.94–3.25) | 1.74 (1.68–1.80) |
| Dual eligible vs non–dual eligible | 2.17 (1.92–2.44) | 2.23 (2.08–2.39) |
| Nonwhites vs whites | ||
| Black | 2.47 (2.17–2.81) | 2.81 (2.62–3.02) |
| Hispanic | 3.11 (2.37–4.08) | 3.31 (2.83–3.87) |
| North American Native | 5.82 (3.25–10.43) | 4.22 (2.90–6.16) |
| Asian | 1.32 (.93–1.87) | 1.50 (1.23–1.82) |
| Other/unknown | 1.19 (.95–1.50) | 1.16 (1.01–1.32) |
| Effects of dual eligibility, by race | ||
| White (dual vs non-dual eligible) | 2.25 (1.97–2.55) | 2.35 (2.18–2.54) |
| Black | 1.79 (1.54–2.09) | 1.60 (1.46–1.74) |
| Hispanic | 1.46 (1.14–1.87) | 1.34 (1.16–1.54) |
| North American Native | 3.09 (1.75–5.46) | 2.44 (1.66–3.59) |
| Asian | 1.28 (.90–1.82) | 1.12 (.91–1.37) |
| Other/unknown | 2.00 (1.52–2.63) | 2.15 (1.83–2.53) |
| Nonwhites vs whites, non–dual eligible | ||
| Black | 2.53 (2.21–2.89) | 2.92 (2.71–3.14) |
| Hispanic | 3.23 (2.44–4.29) | 3.49 (2.96–4.10) |
| North American Native | 5.65 (3.09–10.32) | 4.21 (2.85–6.21) |
| Asian | 1.39 (.98–1.99) | 1.60 (1.31–1.97) |
| Other/unknown | 1.21 (.95–1.53) | 1.17 (1.01–1.34) |
| Nonwhites vs whites, dual eligible | ||
| Black | 2.02 (1.74–2.35) | 1.98 (1.81–2.16) |
| Hispanic | 2.10 (1.64–2.69) | 1.99 (1.72–2.29) |
| North American Native | 7.77 (4.39–13.75) | 4.37 (2.97–6.43) |
| Asian | 0.80 (.56–1.13) | 0.76 (.62–.94) |
| Other/unknown | 1.08 (.82–1.41) | 1.07 (.91–1.25) |
Abbreviation: ADI, area deprivation index; AMI, acute myocardial infarction; CI, confidence interval; COPD, chronic obstructive pulmonary disease; COVID-19, coronavirus disease 2019; OR, odds ratio; TIA, transient ischemic attack.
aCounty-level circulation rate log-transformed using a base of 2, where the OR is interpreted as the estimated OR of doubling the circulation rate.
bCounty-level population density log-transformed using a base of 2, where the OR is interpreted as the estimated OR of doubling the circulation rate.
cORs obtained from logistic regression models. For the OR for the COPD and asthma without COPD groups, the reference group is people with no COPD or asthma.
dInteraction effects estimated at median age of the cohort (73 years old), except for the effects of age.
Health-related factors that were associated with higher COVID-related death rates included being immunocompromised (OR, 1.43; 95% CI, 1.34–1.53), having medical conditions from the frailty index, and other chronic conditions. Most conditions from the frailty index were associated with an increased risk of COVID-related death. Among them, cognitive impairment (OR, 3.16; 95% CI, 3.02–3.31), pneumonia (1.89; 1.79–2.00), and paranoia (1.66; 1.54–1.80) were highly associated with the outcome. Other comorbid conditions associated with higher risk included congestive heart failure (OR, 1.30; 95% CI, 1.23–1.36), diabetes (1.23; 1.18–1.29), and COPD (1.14; 1.08–1.20). Results for COVID-19 hospitalizations were largely consistent with those for deaths (Table 3).
Consistently for both COVID-related death and COVID-19 hospitalization, being a racial or ethnic minority, dual eligible, and older were generally associated with higher risk, with the magnitude of the difference varying across subgroups (Table 3 and Figure 1). Overall, the risk of COVID-related death was higher among beneficiaries who were dual eligible (OR, 2.17; 95% CI, 1.92–2.44). Compared with whites, blacks (OR, 2.47; 95% CI, 2.17–2.81), Hispanics (3.11; 2.37–4.08), and North American Natives (5.82; 3.25–10.43) had a higher risk of dying with a prior COVID-19 diagnosis. Compared with 65-year-olds, 80-year-olds were at higher risk of dying with COVID-19 (OR, 3.09; 95% CI, 2.94–3.25) (Table 3).
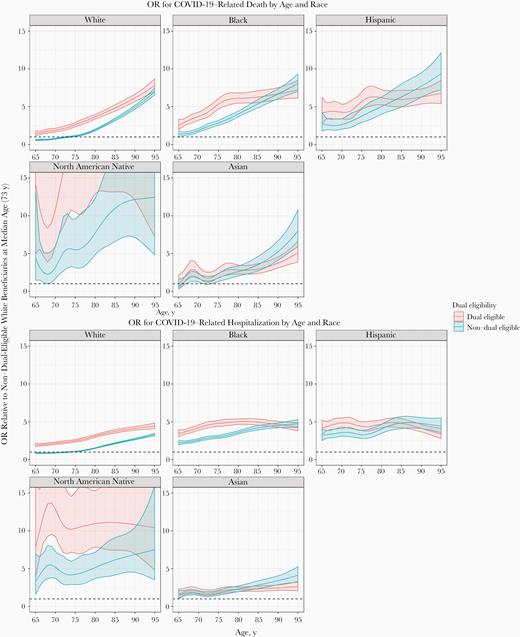
Odds ratio for coronavirus disease 2019 (COVID-19)–related death by age, race, and dual eligibility status (top) or hospitalization (bottom) for beneficiaries with different dual-eligibility status, race, and age in the primary study population (elderly Medicare beneficiaries without end-stage renal disease and not in a nursing home).
Differences in risk between nonwhites and whites varied depending on beneficiaries’ dual-eligibility status. Such differences were greater among non–dual-eligible than among dual-eligible beneficiaries for blacks and Hispanics, whereas the differences were greater among dual-eligible beneficiaries for North American Natives. For example, among non–dual-eligible black beneficiaries, the odds of dying with a prior COVID-19 diagnosis were 2.5 times that among their white counterparts (95% CI, 2.21–2.89), whereas among dual-eligible beneficiaries, the odds in blacks were approximately double those in whites (1.74–2.35) (Table 3).
Differences in risk by race and dual-eligibility status were more pronounced among younger than among older beneficiaries. For example, compared with whites of the same age, Hispanics had 4.3 times the odds of dying with COVID-19 at age 65 years (95% CI, 2.85–6.59) and 2.5 times the odds at age 80 years (2.02–3.08). Compared with non–dual-eligible beneficiaries of the same age, dual-eligible beneficiaries had 2.3 times the odds of dying with COVID-19 at age 65 years (95% CI, 1.81–2.80) and 1.8 times the odds at age 80 years (1.69–1.98) (Table 4). Trends were similar for COVID-19 hospitalizations (Supplementary Table 2).
Estimated Odds of Coronavirus Disease 2019–Related Death by Dual-Eligibility Status and Race at Age 65 and 80 Years in the Primary Study Population
| OR (95% CI) | ||
|---|---|---|
| Covariates | At Age 65 y | At Age 80 y |
| Dual eligible vs non–dual eligible | 2.25 (1.81–2.80) | 1.82 (1.69–1.98) |
| Nonwhites vs whites | ||
| Black | 2.20 (1.68–2.88) | 2.04 (1.87–2.23) |
| Hispanic | 4.33 (2.85–6.59) | 2.49 (2.02–3.08) |
| North American Native | 7.45 (2.52–22.03) | 4.11 (2.64–6.39) |
| Asian | 1.13 (.52–2.47) | 1.29 (1.02–1.63) |
| Other/unknown | 0.98 (.54–1.80) | 1.20 (1.00–1.45) |
| Effects of dual-eligibility status, by race | ||
| White | 2.34 (1.85–2.96) | 1.89 (1.74–2.06) |
| Black | 1.87 (1.44–2.43) | 1.51 (1.36–1.69) |
| Hispanic | 1.52 (1.02–2.26) | 1.23 (1.05–1.44) |
| North American Native | 3.21 (1.13–9.12) | 2.60 (1.67–4.05) |
| Asian | 1.33 (.61–2.94) | 1.08 (.88–1.33) |
| Other/unknown | 2.08 (1.11–3.91) | 1.69 (1.40–2.04) |
| Nonwhites vs whites, non–dual eligible | ||
| Black | 2.25 (1.70–2.97) | 2.09 (1.90–2.29) |
| Hispanic | 4.51 (2.93–6.95) | 2.60 (2.08–3.25) |
| North American Native | 7.23 (2.40–21.73) | 3.99 (2.50–6.35) |
| Asian | 1.19 (.55–2.61) | 1.36 (1.06–1.75) |
| Other/unknown | 0.99 (.54–1.82) | 1.21 (1.00–1.48) |
| Nonwhites vs whites, dual eligible | ||
| Black | 1.80 (1.38–2.34) | 1.67 (1.50–1.86) |
| Hispanic | 2.93 (1.97–4.36) | 1.69 (1.44–1.98) |
| North American Native | 9.94 (3.50–28.21) | 5.48 (3.52–8.54) |
| Asian | 0.68 (.31–1.50) | 0.78 (.63–.95) |
| Other/unknown | 0.89 (.47–1.66) | 1.08 (.90–1.31) |
| Comparison with white, non–dual-eligible beneficiaries | ||
| White, dual eligible | 2.34 (1.85–2.96) | 1.89 (1.74–2.06) |
| Black, non–dual eligible | 2.25 (1.70–2.97) | 2.09 (1.90–2.29) |
| Black, dual eligible | 4.20 (3.23–5.46) | 3.16 (2.83–3.52) |
| Hispanic, non–dual eligible | 4.51 (2.93–6.95) | 2.60 (2.08–3.25) |
| Hispanic, dual eligible | 6.85 (4.61–10.18) | 3.19 (2.72–3.75) |
| North American Native, non–dual eligible | 7.23 (2.40–21.73) | 3.99 (2.50–6.35) |
| North American Native, dual eligible | 23.22 (8.18–65.91) | 10.38 (6.66–16.16) |
| Asian, non–dual eligible | 1.19 (.55–2.61) | 1.36 (1.06–1.75) |
| Asian, dual eligible | 1.59 (.72–3.51) | 1.47 (1.19–1.80) |
| Other/unknown, non–dual eligible | 0.99 (.54–1.82) | 1.21 (1.00–1.48) |
| Other/unknown, dual eligible | 2.07 (1.10–3.88) | 2.05 (1.70–2.48) |
Abbreviation: CI, confidence interval; OR, odds ratio.
Sensitivity analysis results using the alternative race categorization yielded similar results to the primary analysis, in which being a minority was generally associated with higher COVID-related outcome risk than among whites. Under the alternative race classification, the proportion of Hispanics tripled, and the differences in risk between Hispanics and non-Hispanic whites were smaller (Supplementary Tables 3–5). Consistent with the results using individual conditions from the frailty index, our sensitivity analysis results using the frailty index found 58% increased odds of COVID-related death with every additional 10% increase in the probability of frailty (95% CI, 1.55–1.60) (Supplementary Table 6). When age effects were estimated incorporating the 5-year average frailty index of the particular age, the increase in COVID-related outcome risk with advancing age became greater (Supplementary Figure 2).
DISCUSSION
In the largest nationwide study on the risk of COVID-19 hospitalization and death among the US elderly, we assessed with high precision the effects of a wide range of potential risk factors, including demographics, frailty, socioeconomic and health status. Our use of a frailty index allowed us to determine that overall frailty, measured using a composite score calculated from a number of health-related conditions was, by itself, highly associated with the risk of COVID-19-associated death and hospitalization (Supplementary Figure 2 and Supplementary Table 6). The severity of COVID-19 can be highlighted by our finding that, during this early (1 April to 8 May) pandemic phase, more than a fifth of hospitalized beneficiaries in the primary study population were admitted to the ICU/CCU, and more than a quarter of those hospitalized died. We also found that among Medicare beneficiaries aged ≥65 years, COVID-19 death rates were 55 times and hospitalization rates 27 times higher among NH residents than among the primary study population, highlighting the extremely large risk among NH residents. Rates among beneficiaries with ESRD were also very high (Table 1).
Our single-payer fee-for-service Medicare data, which likely constitutes the most representative nationwide sample of US elderly, allowed us to obtain precise, adjusted estimates of COVID-19 risk for almost 100 risk categories, and also allowed us to precisely quantify interactions for age, race, and dual eligibility. We found that being immunocompromised (which also includes hematological cancers and solid tumors under treatment), frail (having conditions including but not limited to cognitive impairment, pneumonia, and paranoia), having comorbid conditions such as congestive heart failure, COPD, and diabetes, and being male were associated with very high odds of COVID-related death and hospitalization (Table 3). These associations were generally consistent with those described in prior publications, [3, 5–11] despite some differences in the populations investigated and analysis periods. In addition, our study accounted for multiple additional conditions and important interactions (Table 3). Of particular interest are our findings of lower risk estimates for hypertension, obesity, and asthma than in prior studies [3, 5–11]. Our use of adjustments for multiple risks factors may explain the differences found. The lack of association between asthma and risk of COVID-related death in our results requires further evaluation, including an examination of the potential role of asthma treatments.
Our finding that COVID-19 hospitalization and death disproportionately affected Native Americans, Hispanics, and blacks, including but not limited to those sufficiently poor to be eligible for dual Medicare/Medicaid coverage, were more granular than comparable results obtained by others [19, 20]. We found that Native Americans had the highest risk estimates, regardless of dual eligibility, which suggests the need to investigate the possibility of disparities not measured exclusively by income level. We also found that Asians shared the lowest risks with whites, which also requires further investigation. Interestingly, the risk differences by race and dual-eligibility status became less pronounced among the very old, highlighting the fact that, independently of race or socioeconomic conditions, frailty appeared to play a major role among those aged ≥80 years, although other explanations, such as survivor effect, could also be considered.
Our study has several strengths. Using longitudinal data on Medicare beneficiaries’ preexisting health conditions and health services use, we defined a wide range of potential COVID-related risk factors among individuals who were unlikely to change insurance affiliation, which allowed us to produce highly precise, adjusted estimates. In addition, we had granular geographic and demographic information, which allowed us to study risk factors while adjusting for local infection intensity (at the county level) and individual characteristics. Given that Medicare covers the vast majority of US citizens ≥65 years old, our findings are generalizable to the US elderly and should particularly contribute to the understanding of COVID-19 death risk among all elderly [21]. Reassuringly, our overall hospitalization rates and our finding that rates of hospitalization and death increased with age were comparable to those obtained by the Centers for Disease Control and Prevention for a slightly larger pandemic period, and with findings from a study in 12 US states [19, 20].
Our study had some limitations. The use of administrative claims data to identify COVID-19 cases may result in the inclusion of some non–test-confirmed cases. To minimize the potential misclassification bias, we used inpatient discharge diagnoses for identifying outcomes, which were found to have high accuracy in prior literature [22, 23]. The high attention paid to the COVID-19 pandemic and the seriousness of the events we investigated gives us high confidence that physicians and hospitals were likely to follow Centers for Disease Control and Prevention guidelines regarding COVID diagnosis.
Another possible limitation is that though we used the binary Medicaid dual-eligibility status as the proxy for low-income status, this does not provide granular information on people’s income level. However, the dual-eligibility status is available for all beneficiaries, highly accurate in identifying low-income individuals, and has been successfully used as poverty surrogate in multiple studies [24–30]. Finally, our race/ethnicity classification is based on Medicare enrollment data, which undercaptures Hispanics and Asians. However, this variable is highly accurate in distinguishing blacks from whites, 2 of the largest racial/ethnic groups in our population. In addition, our main study results were similar to those of the sensitivity analysis we conducted using an alternative race/ethnicity classification that captured more Hispanics and Asians (Supplementary Table 3) [17]. Our results were, overall, also consistent with those of prior US studies published on the same topic [3, 5–11].
In conclusion, this large nationwide cohort study among the US elderly confirmed and precisely measured the importance of several risk factors, including particularly NH residence, ESRD status, older age, male sex, racial/ethnic minority status, immunocompromised status, frailty, and chronic conditions. Moreover, our study found that social disparities (ie, socioeconomic factors) were highly associated with an increased risk of COVID-related outcomes, even after adjustment for factors such as age and chronic medical conditions, highlighting the need to consider the interconnected effects of poverty and race/ethnicity in evaluations of COVID-19 risk. Our study demonstrates the benefits of using real-world evidence for the timely evaluation of risk factors for severe disease during pandemics and epidemics, and its potential to contribute to public health decision making.
Supplementary Data
Supplementary materials are available at The Journal of Infectious Diseases online. Consisting of data provided by the authors to benefit the reader, the posted materials are not copyedited and are the sole responsibility of the authors, so questions or comments should be addressed to the corresponding author.
Notes
Author’s contributions. Hector S. Izurieta, David J. Graham, Yun Lu, Yoganand Chillarige, Michael Wernecke, Mikhail Menis, Douglas Pratt, Jeffrey Kelman, and Richard Forshee contributed to the study conception and design, data interpretation, manuscript writing and review. Yixin Jiao, Mao Hu, Yue Wu, Yoganand Chillarige, and Michael Wernecke, contributed to study design, data collection and analysis, manuscript writing and review.
Acknowledgments. Thanks to Jing Wang, Angela Cheng, and Yuxin Ma, Acumen, for contributions to statistical programming, and to Jiemin Liao and Ellie Smith, Acumen, for contribution to manuscript writing and review.
Financial support. This work was supported by the Food and Drug Administration as part of the SafeRx Project, a joint initiative of the Food and Drug Administration and the Centers for Medicare $ Medicaid Services.
Potential conflicts of interest. All authors: No reported conflicts. All authors have submitted the ICMJE Form for Disclosure of Potential Conflicts of Interest. Conflicts that the editors consider relevant to the content of the manuscript have been disclosed.
References

