


Abstract
Few data exist concerning the role of common human coronaviruses (HCoVs) in patients hospitalized for acute respiratory infection (ARI) and the severity of these infections compared with influenza.
Prospective data on the viral etiology of ARI hospitalizations during the peaks of 8 influenza seasons (from 2011–2012 to 2018–2019) in Quebec, Canada, were used to compare patients with HCoV and those with influenza infections; generalized estimation equations models were used for multivariate analyses.
We identified 340 HCoV infections, which affected 11.6% of children (n = 136) and 5.2% of adults (n = 204) hospitalized with ARI. The majority of children (75%) with HCoV infections were also coinfected with other respiratory viruses, compared with 24% of the adults (P < .001). No deaths were recorded in children; 5.8% of adults with HCoV monoinfection died, compared with 4.2% of those with influenza monoinfection (P = .23). The risk of pneumonia was nonsignificantly lower in children with HCoV than in those with influenza, but these risks were similarly high in adults. Markers of severity (length of stay, intensive care unit admissions, and case-fatality ratio) were comparable between these infections in multivariate analyses, in both children and adults.
In children and adults hospitalized with ARI, HCoV infections were less frequent than influenza infections, but were as severe as influenza monoinfections.
The emergence of novel coronaviruses associated with severe disease in different animal species has brought to attention the need to better understand characteristics of human coronaviruses (HCoVs). The first HCoVs were described in the 1960s in patients with common colds [1]. They were not considered highly pathogenic to humans until the outbreaks of severe acute respiratory syndrome (SARS) in 2002–2003 [2], the Middle East respiratory syndrome coronavirus in 2012 [3], and, recently, the novel coronavirus SARS coronavirus 2 (SARS-CoV-2) associated with the current coronavirus disease 2019 (COVID-19) pandemic [4].
Although much attention has been focused on these highly pathogenic coronaviruses, little is known about the role of the common HCoV subtypes, despite their wide circulation in humans. Two common HCoVs (HCoV-229E [alphacoronavirus] and the HCoV-OC43 [betacoronavirus, lineage A]) were discovered in the mid-1960s, and 2 others (the HCoV-NL63 [alphacoronavirus] and the HKU1 [betacoronavirus, lineage A]) were discovered in the mid-2000s [5, 6]. Along with rhinoviruses, HCoVs are the most frequently identified viruses in all age categories, with HCoVs more frequent that rhinoviruses in adults; acute respiratory infections (ARIs) caused by these viruses are least likely to be medically attended compared with other respiratory viruses [7]. Patients infected with HCoV are also less likely to be hospitalized than those infected with other respiratory viruses [8].
However, the role of common HCoV subtypes in severe infections leading to hospitalization is less known, especially in adults, because few long-term multicenter studies describing characteristics of patients hospitalized with confirmed HCoV have been published, and most of those that exist have focused on children. Despite increasing awareness of the role of other respiratory viruses in respiratory morbidity in hospitalized patients, most reports continue to focus on influenza. To our knowledge, none of them compared HCoV and influenza infections directly. The objective of the current study was to compare severe outcomes in children (aged <18 years) and adults hospitalized with HCoV monoinfection with those in patients hospitalized with influenza monoinfection, from a prospective hospital-based surveillance performed during 8 years in Quebec, Canada.
METHODS
Study Population
The study design has been described in detail elsewhere [9]. In brief, 4 regional hospitals (2 community and 2 academic/tertiary; all serving both children and adults) with a catchment area of nearly 10% of the Quebec population (approximately 8.4 million) participated in the surveillance during 8 influenza seasons from 2011–2012 to 2018–2019. Swab specimens were systematically obtained from all patients presenting to the emergency department with ARI during high influenza activity weeks, as part of the standard of care during the influenza season.
Eligible patients were those admitted for ≥24 hours with cough and fever or feverishness in 2011–2012, and with cough, sore throat, fever, or feverishness in the absence of other identifiable cause, starting in 2012–2013. After informed consent was obtained (signed in the first 3 years and verbal in subsequent years), research nurses collected demographic and clinical details from the patient or legal representative on a standardized questionnaire and reviewed patients’ charts at discharge for additional clinical information. Influenza vaccination status was self-reported, as collected by nurses in face-to-face interviews. Specimens from all eligible patients were sent to the provincial public health laboratory (Laboratoire de santé publique du Québec) and tested with a multiplex polymerase chain reaction assay.
Surveillance Period
The surveillance period started when the positivity rate for influenza in respiratory specimens from the provincial hospital–based sentinel laboratory surveillance had been ≥15% for 2 consecutive weeks and stopped the week after this rate dropped below 15% or when the planned sample size for the season was achieved (800–1000 specimens, depending on the season). During the various seasons, the surveillance period varied between 8 and 12 weeks (Supplementary Figure 1). The provincial hospital–based sentinel laboratory surveillance system includes >40 laboratories across the province of Quebec testing >100 000 respiratory specimens per year.
Laboratory Analysis
Nasal specimens collected on flocked swabs were tested at the Laboratoire de santé publique du Québec using the Luminex NxTAG Respiratory Pathogen Panel, assay which detects influenza A (subtypes H3 and H1), influenza B, respiratory syncytial virus (RSV) A and B, human parainfluenza viruses 1, 2, 3, and 4 (hPIV), human metapneumovirus (hMPV), common HCoV NL63, HKU1, 229E, and OC43, enterovirus/rhinovirus (not differentiated), adenovirus, bocavirus, and 3 bacteria (Mycoplasma pneumoniae, Chlamydia pneumoniae, and Legionella pneumophila). Results of multiplex tests were faxed to participating hospitals within 24–48 hours of specimen receipt.
Statistical Analysis
Characteristics and outcomes of patients were compared using the Fisher exact test (proportions) and the Kruskal-Wallis test for nonparametric variables (eg, length of stay [LOS] and age). Patients with influenza and HCoV coinfections were excluded from all comparisons between patients with HCoV infection (case patients) and those with influenza infection (controls).The severity of HCoV infection was assessed by comparing the following outcomes to influenza infection: pneumonia, LOS, intensive care unit (ICU) admission, and in-hospital death. Generalized estimation equations models with a binomial distribution and logit link were used for all outcomes, with the exception of LOS. Owing to the skewed LOS distribution, a negative binomial distribution with a log link was assigned to the generalized estimation equation model for this outcome [10].
In children, only pneumonia and LOS were assessed in the multivariate analysis owing to the limited number of observations for ICU admissions and absence of deaths; models were adjusted for age (0–5 months, 6–23 months, 2–4 years, or 5–17 years), sex, comorbid conditions (yes or no), and influenza vaccination status. Influenza vaccination status was defined as (1) vaccinated, if seasonal influenza vaccination had been received ≥14 days before symptom onset; (2) not vaccinated, if no vaccine had been administered or if it was received <14 days before symptom onset; or (3) unknown, if vaccine receipt or timing were not reported. The proportion of vaccinated individuals among influenza-negative individuals (controls) was similar across the various seasons.
In adults, models were adjusted for age (18–64, 65–74, 75–84, or ≥85 years), sex, admission from community or other institutions (long-term care facility (LTCF) or nursing home), comorbid condition (chronic respiratory disease, cardiovascular disease, other comorbid condition, or no comorbid condition), season, and influenza vaccination as fixed-effect variables. Hospital was included as a random effect variable to take into account the correlation between subjects recruited at the same hospital, including those who may have been recruited in more than one season. Multivariate analyses were performed by (1) including HCoV coinfections (with viruses other than influenza) and influenza coinfections (with viruses other than HCoV) as covariates and (2) restricting the analysis to HCoV monoinfection and influenza monoinfection. The impact of the circulating strain of influenza was taken into account by adjusting for the season and for the receipt of influenza vaccine in the multivariate analyses. The association between HCoV subtype and severity outcomes was also explored.
Ethics
Institutional review board approval was obtained from all participating hospitals for the first 3 years; a waiver was obtained for the following years when the project was conducted as a surveillance project and only verbal consent was required.
RESULTS
Among the 5104 patients hospitalized with ARI included in the analysis, 3539 (69.3%) were positive for ≥1 virus. Influenza was detected in 35.9% (n = 1831) overall (in 22.9% of children [aged <18 years; n = 268] and 39.7% of adults [n = 1563]) and HCoV in 6.7% (n = 340) overall (in 11.6% of children [n = 136] and 5.2% of adults [n = 204]) (Table 1). The proportion of influenza detection increased from 12.3% in 0–5-month-olds to 43.8% in 5–17-year-olds; it remained at similar levels in different adult age groups (ranging from 38.0% to 40.6%) (Figure 1). In contrast, the proportions of HCoV were the highest in infants and children aged 0–5 (12.7%) or 6–23 (14.5%) months; it decreased 2–3-fold in the next age groups (2–4 [5.8%] and 5–17 [7.4%] years) and remained at comparable levels in all examined adult age groups (ranging from 4.5% to 5.9%) (Figure 1). Over 8 seasons, overall detection rates ranged from 21.6% to 50.7% for influenza and from 2.7% to 10.4% for HCoV. For influenza cases, 85% were influenza A (59% A[H3N2] and 24% influenza A[H1N1[) and 15% influenza B.
Characteristics of Patients Hospitalized in Quebec With Respiratory Infections and Influenza and Human Coronavirus Monoinfections and Coinfections During the Peaks of Influenza Seasons (2011–2012 to 2018–2019)
| Patients, No. (%)a | ||||||||
|---|---|---|---|---|---|---|---|---|
| Influenza | HCoV | |||||||
| Characteristic | Any Respiratory Infection (n = 5104) | Total (n = 1831) | Monoinfection (n = 1585) | Coinfection With Any Virusb (n = 246) | Total (n = 340) | Monoinfection (n = 189) | Coinfection With Any Virusb (n = 151) | HCoV + Influenza (n = 39) |
| Children | 1171 (22.9) | 268 (14.6) | 177 (11.2) | 91 (37.0) | 136 (40.0) | 34 (18.0) | 102 (67.5) | 16 (41.0) |
| Female sex | 546 (46.6) | 124 (46.3) | 86 (69.4) | 38 (30.7) | 54 (39.7) | 13 (38.2) | 41 (40.2) | 5 (31.3) |
| Agec | ||||||||
| 0–5 mo | 408 (34.8) | 50 (18.7) | 34 (19.2) | 16 (17.6) | 52 (38.2) | 18 (52.9) | 34 (33.3) | 2 (12.5) |
| 6–23 mo | 434 (37.1) | 96 (35.8) | 51 (28.8) | 45 (49.5) | 63 (46.3) | 10 (29.4) | 53 (52.0) | 7 (43.8) |
| 2–4 y | 208 (17.8) | 69 (25.8) | 48 (27.1) | 21 (23.1) | 12 (8.8) | 3 (8.8) | 9 (8.8) | 3 (18.8) |
| 5–17 y | 121 (10.3) | 53 (19.8) | 44 (24.9) | 9 (9.9) | 9 (6.6) | 3 (8.8) | 6 (5.9) | 4 (25.0) |
| Comorbid condition | 173 (14.8) | 54 (20.2) | 34 (19.2) | 20 (22.0) | 23 (16.9) | 3 (8.8) | 20 (19.6) | 6 (37.5) |
| Influenza vaccined | 133 (11.8) | 29 (11.3) | 14 (8.2) | 15 (17.4) | 13 (10.0) | 3 (9.1) | 10 (10.3) | 2 (13.3) |
| LOS, median (IQR), d | 2 (2–3) | 2 (2–3) | 2 (2–3) | 2 (2–3) | 2 (2–3) | 2 (2–3) | 2.5 (2–4) | 3 (2–4) |
| Pneumoniae | 356 (30.4) | 67 (25.0) | 39 (22.0) | 28 (30.8) | 36 (26.5) | 4 (11.8) | 32 (31.4) | 3 (18.8) |
| ICU admission | 23 (2.0) | 3 (1.1) | 2 (1.1) | 1 (1.1) | 4 (2.9) | 0 (0.0) | 4 (3.9) | 0 (0.0) |
| Death | 1 (0.1) | 0 (0.0) | 0 (0.0) | 0 (0.0) | 0 (0.0) | 0 (0.0) | 0 (0.0) | 0 (0.0) |
| Adults | 3933 (77.1) | 1563 (85.4) | 1408 (88.8) | 155 (63.0) | 204 (60.0) | 155 (82.0) | 49 (32.5) | 23 (59.0) |
| Female sex | 2179 (55.4) | 874 (55.9) | 783 (55.6) | 91 (58.7) | 108 (52.9) | 80 (51.6) | 28 (57.1) | 11 (47.8) |
| Age, y | ||||||||
| 18–64 | 1073 (27.3) | 436 (27.9) | 403 (28.6) | 33 (21.3) | 63 (30.9) | 47 (30.3) | 16 (32.7) | 6 (26.1) |
| 65–74 | 842 (21.4) | 320 (20.5) | 288 (20.5) | 32 (20.7) | 41 (20.1) | 31 (20.0) | 10 (20.4) | 6 (26.1) |
| 75–84 | 1128 (28.7) | 448 (28.7) | 400 (28.4) | 48 (31.0) | 60 (29.4) | 45 (29.0) | 15 (30.6) | 7 (30.4) |
| ≥85 | 890 (22.6) | 359 (23.0) | 317 (22.5) | 42 (27.1) | 40 (19.6) | 32 (20.7) | 8 (16.3) | 4 (17.4) |
| Comorbid condition | 3368 (85.6) | 1310 (83.8) | 1183 (84.0) | 127 (81.9) | 181 (88.7) | 137 (88.4) | 44 (89.8) | 20 (87.0) |
| Chronic respiratory diseasef | 2015 (51.2) | 721 (46.1) | 660 (46.9) | 61 (39.4) | 120 (58.8) | 94 (60.7) | 26 (53.1) | 10 (43.5) |
| Chronic cardiovascular diseasef | 1824 (46.4) | 709 (45.4) | 632 (44.9) | 77 (49.7) | 112 (54.9) | 91 (58.7) | 21 (42.9) | 11 (47.8) |
| Diabetesf | 1151 (29.3) | 465 (8, 29) | 420 (29.8) | 45 (29.0) | 60 (29.4) | 43 (27.7) | 17 (34.7) | 8 (34.8) |
| Chronic renal diseasef | 761 (19.4) | 298 (19.1) | 271 (19.3) | 27 (17.4) | 44 (21.6) | 34 (21.9) | 10 (20.4) | 4 (17.4) |
| Other chronic diseasef | 221 (5.6) | 85 (5.4) | 79 (5.6) | 6 (3.9) | 13 (6.4) | 8 (5.2) | 5 (10.2) | 2 (8.7) |
| Influenza vaccined | 1597 (49.1) | 578 (43.5) | 510 (43.0) | 68 (48.2) | 91 (51.7) | 70 (52.2) | 21 (50.0) | 9 (50.0) |
| Admitted from LTCF | 388 (9.9) | 174 (11.1) | 157 (11.2) | 17 (11.0) | 21 (10.3) | 15 (9.7) | 6 (12.2) | 5 (21.7) |
| Pregnancy | 26 (0.7) | 22 (1.4) | 19 (1.4) | 3 (1.9) | 1 (0.5) | 0 (0.0) | 1 (2.0) | 1 (4.4) |
| LOS, median (IQR), d | 6 (3–11) | 6 (3–11) | 6 (3–10) | 6 (3–11) | 6 (3–10.5) | 6 (3–10) | 7 (4–12) | 7 (5–16) |
| Pneumoniae | 1608 (40.9) | 548 (35.1) | 487 (34.6) | 61 (39.4) | 75 (36.8) | 58 (37.4) | 17 (34.7) | 9 (39.1) |
| ICU admission | 385 (9.8) | 134 (8.6) | 127 (9.0) | 7 (4.5) | 18 (8.8) | 16 (10.3) | 2 (4.1) | 0 (0.0) |
| Death | 231 (5.9) | 63 (4.0) | 59 (4.2) | 4 (2.6) | 11 (5.4) | 9 (5.8) | 2 (4.1) | 0 (0.0) |
Abbreviations: HCoV, human coronavirus; ICU, intensive care unit; IQR, interquartile range; LOS, length of stay; LTCF, long-term care facility.
aData represent no. (%) of patients unless otherwise specified.
bIncluding influenza and HCoV coinfections.
cSignificant difference (P < .05) between HCoV and influenza monoinfections; Fisher exact test was used to compare proportions, and Kruskal-Wallis test to compare LOS between monoinfections and coinfections.
dInfluenza vaccination in those with known vaccination status and timing.
eRadiologically confirmed pneumonia among those who underwent pulmonary radiography.
fCategories are not mutually exclusive.
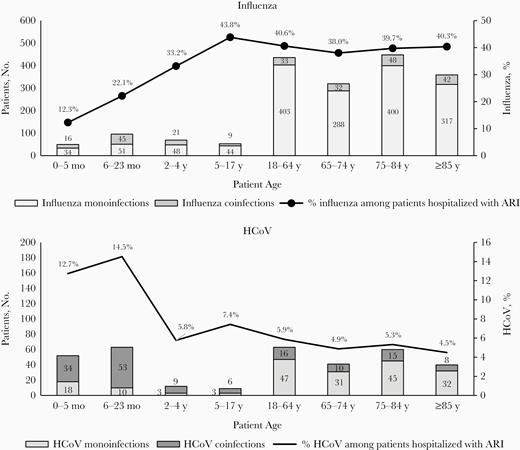
Numbers of patients hospitalized with influenza and human coronavirus (HCoV) monoinfections and coinfections and proportions of influenza and HCoV detection among patients admitted with acute respiratory infection (ARI) in Quebec, during the peak of influenza seasons from 2011–2012 to 2018–2019. Influenza coinfections were defined as coinfections with any other respiratory virus, including HCoV; HCoV coinfections, as coinfections with any other respiratory virus, including influenza.
Among the 136 HCoV-infected children, 84.5% were <2 years old, and 75% (n = 102) were coinfected with another virus (Table 1 and Figure 1). Most HCoV coinfections (77.5%) involved a single other virus, but 17.6% involved 2 and 4.9% involved 3 viruses. The viruses most frequently contributing to HCoV coinfections in children were RSV (55.9%), influenza and hMPV (15.7% each), and enterovirus/rhinovirus (13.7%) (Supplementary Table 1 and Figure 2). The most frequent HCoV coinfections by age were HCoV/RSV in 0–5-month-old (73.5%) and 6–23-month-old (50.9%), HCoV/hMPV and HCoV/influenza (33.3% each) in 2–4-year-old, and HCoV/influenza (66.7%) in 5–17-year-old children.
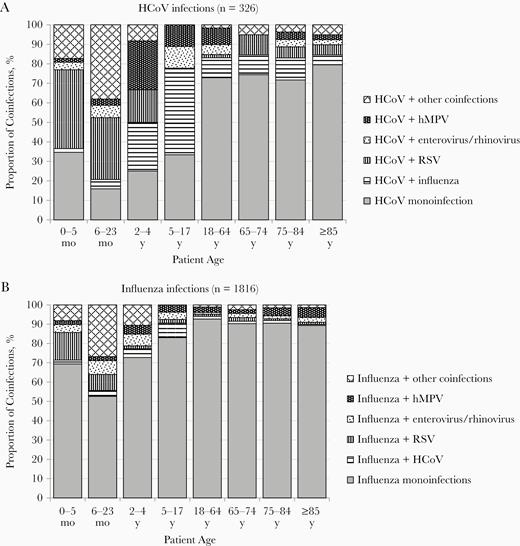
Distribution of different types of coinfections in patients hospitalized with acute respiratory infections. Monoinfections and pairs of viruses are presented; infections with ≥3 viruses are included in the “HCoV + other coinfections” and “Influenza + other coinfections” categories. Abbreviations: HCoV, human coronavirus; hMPV, human metapneumovirus; RSV, respiratory syncytial virus.
In contrast to HCoV infections, about half (54.5%) of influenza infection in children was detected in <2-year-olds, and only 34.0% (n = 91) were coinfections (Table 1 and Figure 1). Most influenza coinfections (77.2%) were with 1 other virus; 18.2% were with 2 and 4.5% with 3 viruses. Viruses most frequently contributing to influenza coinfections in children were enterovirus/rhinovirus (27.5%), followed by RSV (25.3%), bocavirus (22.0%), HCoV (17.6%), and hMPV (14.3%) (Supplementary Table 1 and Figure 2). The most frequent influenza coinfections by age were influenza/RSV coinfection in 0–5-month-old (60.0%) and 6–23-month-old (21.7%), influenza/enterovirus/rhinovirus (22.2%) in 2–4-year-old, and influenza/HCoV (44.4%) in 5–17-year-old children.
Children with HCoV monoinfections were significantly younger than those with influenza monoinfections (median age, 6 months vs 2 years; P < .001) and had half the risk of radiologically confirmed pneumonia (11.8% [n = 4] vs 22.0% [n = 39]), but the latter difference did not reach statistical significance (P = .13) (Table 1). Overall, 14.8% of children had ≥1 comorbid condition (asthma in 76%), with no significant difference (P > .05) across examined subgroups (Table 1). There was no significant difference in LOS (median, 2 days; P = .78) or ICU admission (0% vs 1.1%, respectively; P = .70) between children with HCoV and those with influenza monoinfections (Table 1). Only 3 children with influenza (1 coinfected with enterovirus/rhinovirus) and 4 children with HCoV (all coinfected: 2 with RSV, 1 with enterovirus/rhinovirus, and 1 with hMPV) were admitted to the ICU and no deaths were recorded (Table 1). When comparing HCoV monoinfection with coinfection, there were no differences in LOS, admission to ICU, or case-fatality ratio (CFR) (Table 1). Children with HCoV coinfections had almost 3 times more pneumonia than those with monoinfection (31.4% [n = 32] vs 11.8% [n = 4], respectively; P = .02).
The majority of HCoV infections in adults were monoinfections (76.0% [155 of 204]), compared with 25.0% (34 of 136) in children (P < .001) (Table 1 and Figure 1). HCoV coinfections in adults involved influenza (46.9%), RSV or hMPV (22.5% each), or enterovirus/rhinovirus (17.3%) (Supplementary Table 1 and Figure 2). Most HCoV coinfections (87.8%) involved 1 other virus, and 12.2% involved 2.
There was no difference in the ages of adult patients with HCoV versus influenza monoinfections (median age, 75 vs 74 years, respectively; P = .34). The proportions of patients with ≥1 comorbid condition were similar in HCoV- and influenza-monoinfected patients (84.0% and 88.4%, respectively; P = .16). However, more patients with HCoV monoinfection had chronic respiratory disease (60.7% vs 46.9%, respectively; P = .001) and chronic cardiovascular disease (58.7% vs 44.9%; P = .006); no differences were detected for the other examined chronic conditions (Table 1). There was no difference between HCoV- and influenza-monoinfected adult patients for LOS, pneumonia, ICU admission, or in-hospital mortality rate (Table 1).
Among HCoV-monoinfected patients aged ≥65 years, 7.4% were admitted to the ICU and 7.4% died, compared to 6.4% ICU admissions and 5.6% deaths in influenza-monoinfected patients (P > .05 for both comparisons). Mortality rates increased with age in adults with HCoV monoinfection (from 2.1% for age 18–64 years to 12.5% for ≥85 years; overall, 5.8%) and those with influenza monoinfection (from 0.7% to 7.9%, respectively; overall, 4.2%). Similar increases with age were seen when coinfections were included (Supplementary Table 2). Overall 5.8% of adults with HCoV monoinfection died, compared with 4.2% of those with influenza monoinfection (P = .23); there was also no difference in LOS, pneumonia, and ICU admission (all P > .05) (Table 1). When comparing HCoV monoinfection with coinfection in adults, there were no significant differences in LOS (median 6 vs 7 days), pneumonia (37.4% vs 34.7%), ICU admission (10.3% vs 4.1%), or CFR (5.8% vs 4.1%) (all P > .05).
In the multivariate analyses, the LOS and frequency of pneumonia in HCoV-monoinfected children were not significantly different from those in influenza-monoinfected children, both when coinfections were used as a covariate and in the analysis restricted to monoinfections (Table 2). Increasing age was associated with greater risk of pneumonia. HCoV coinfection with another respiratory virus (excluding influenza) was an independent risk factor for pneumonia (adjusted odd ratio, 2.83; 95% confidence interval, 1.80–4.46). In adults, the severity of HCoV monoinfection was not significantly different from that of influenza monoinfection, as evidenced by LOS, risk of pneumonia, ICU admissions, and CFR (Table 2). Increasing age was associated with greater LOS and greater risk of pneumonia, and death but lower risk of ICU admission. Cardiovascular disease was associated with increased risk of ICU admission and death, decreased risk of pneumonia, and shorter LOS. Coinfection with another respiratory virus (excluding influenza) was not associated with the severity of HCoV infections. Similar results were obtained when restricting the analysis to monoinfections (Table 2).
Results of Regression Models Estimating the Risk of Severity Outcomes in Children and Adults Hospitalized in Quebec With Human Coronavirus Versus Influenza Infections (2011–2012 to 2018–2019)
| HCoV vs Influenza Infectiona | ||||
|---|---|---|---|---|
| Outcome | Patients, No.a | Crude OR/RR (95% CI) | Adjusted OR/RR (95% CI) | Adjustment Variablesb |
| Children | ||||
| LOSc | ||||
| HCoV and influenza coinfections included as covariate | 372 | 1.12 (.96–1.30) | 1.12 (.94– 1.32) | Age,d sex, year,d comorbid condition, coinfection,e vaccination |
| Restricted to monoinfections | 211 | 0.90 (.67–1.20) | 0.90 (.60–1.36) | Age, sex, year,d comorbid condition, vaccinationd |
| Pneumoniaf | ||||
| HCoV and influenza coinfections included as covariate | 372 | 1.11 (.68–1.82) | 1.08 (.69–1.69) | Age,d sex, year,d comorbid condition, coinfection,d,e vaccinationd |
| Restricted to monoinfections | 211 | 0.47 (.16–1.42) | Not available | Adjusted model did not converge |
| Adults | ||||
| LOSc | ||||
| HCoV and influenza coinfections included as covariate | 1719 | 1.04 (.91–1.18) | 1.07 (.89–1.29) | Age,d sex, year,d admitted from LTCF,d comorbid condition,d coinfection,e influenza vaccination |
| Restricted to monoinfections | 1561 | 1.02 (.89–1.18) | 1.05 (.89–1.25) | Age,d sex, year,d admitted from LTCF,d comorbid condition,d influenza vaccination |
| Pneumoniaf | ||||
| HCoV and influenza coinfections included as covariate | 1720 | 1.08 (.78–1.48) | 1.14 (.75–1.71) | Age,d sex,d year,d admitted from LTCF,d comorbid condition,d coinfection,e influenza vaccinationd |
| Restricted to monoinfections | 1562 | 1.14 (.81–1.61) | 1.17 (.76–1.81) | Age,d sex,d year,d admitted from LTCF,d comorbid condition, influenza vaccinationd |
| ICU admissionf | ||||
| HCoV and influenza coinfections included as covariate | 1721 | 1.16 (.69–1.95) | 0.96 (.55–1.68) | Age,d sex,d year,d admitted from LTCF, comorbid condition,d coinfection,e influenza vaccination |
| Restricted to monoinfections | 1563 | 1.16 (.67–2.01) | 0.98 (.57–1.69) | Age,d sex,d year,d admitted from LTCF, comorbid condition,d influenza vaccination |
| In-hospital deathf | ||||
| HCoV and influenza coinfections included as covariate | 1721 | 1.52 (.78–2.93) | 1.42 (.92–2.17) | Age,d sex, year,d admitted from LTCF, comorbid condition,d coinfection,e influenza vaccination |
| Restricted to monoinfections | 1563 | 1.41 (.68–2.90) | 1.27 (.83–1.95) | Age,d sex, year,d admitted from LTCF, comorbid condition,d influenza vaccination |
Abbreviations: CI, confidence interval; HCoV, common human coronavirus; ICU, intensive care unit; LOS, length of stay; LTCF, long-term care facility; OR, odds ratio; RR, risk ratio for LOS.
aThirty-nine patients with coronavirus-influenza coinfection were excluded from the analyses.
bCategories are as follows: age in children: 6–23 months, 2–4 years, or 5–17 years; age in adults, 18–64, 65–74, 75–84, or ≥85 years; admission: community-dwelling versus admission from LTCF/other; comorbid conditions in in children: present or absent; comorbid conditions in adults: none, cardiovascular disease, chronic respiratory disease, both cardiovascular and respiratory disease, or other comorbid condition (obesity, diabetes, chronic renal disease, immunodeficiency, or neurological disease); influenza vaccination status: vaccinated, not vaccinated or unknown vaccination status or timing.
cAnalyses performed using generalized estimating equations with exchangeable correlation matrix for hospital of recruitment, negative binomial distribution, and log link.
dSignificant association with outcome (P < .05).
eCoinfection other than HCoV/influenza.
fAnalyses performed using generalized estimating equations with exchangeable correlation matrix for hospital of recruitment, binomial distribution, and logit link.
In all seasons and all age groups, the most frequently detected subtype was HCoV-OC43 (55.6% [n = 189]), followed at almost equal frequencies by HKU1 (15.6% [n = 53]), NL63 (14.7% [n = 50]), and 229E (12.9% [n = 44]). Four patients (1.2%) were coinfected with OC43 and HKU1. HCoV-NL63 affected young adults aged 18–64 years (13.6%) less often than HCoV-229E and HCoV-HKU1 (41.2% [P = .03] and 45.2% [P = .02], respectively). HCoV-229E was associated with a higher risk of pneumonia (50.0%) than HCoV-HKU1 (22.6%; P = .02) (Supplementary Table 3).
DISCUSSION
To our knowledge, this 8-year prospective study reports one of the largest series of HCoV-confirmed hospitalized pediatric and adult patients. HCoV infection was less frequent than influenza infection in patients hospitalized with ARI, and occurred more frequently as a coinfection compared with influenza, in both children (75% vs 34%) and adults (24% vs 10%). The severity of HCoV monoinfection was comparable to that of influenza monoinfection, in both children and adults.
The study was conducted during the peak of influenza seasons and was therefore not designed to quantify the proportional burden of each respiratory virus. HCoV has a winter seasonal distribution with year-to-year and subtype variations [11–14]. Consequently, the proportion of HCoV detected in this study may not be representative of the entire winter season or of the relative burden of each HCoV subtype. Nevertheless, our results are comparable to those of other studies in patients hospitalized for ARI, in which HCoV was detected in 2.1%–5.7% in the overall population [12, 15–17] and 3.2%–11.8% of adult patients [13, 18, 19]. Similar to our findings, the detection of HCoV in hospitalized children decreased with increasing age, from 14% for <2 years [20] to 11% for <3 years [21], 7.6% for <5 years [14], and 4.3%–5.5% for <18 years [11, 22, 23]. Our observation that HCoV-OC43 was the most frequently detected subtype (56%) in both pediatric and adult populations is also similar to findings elsewhere [12–14, 17, 20–22, 24].
The important number (75% were coinfections in children and 24% in adults) of HCoV coinfections, especially in children, limited the number of HCoV and influenza monoinfections and consequently the power to detect significant differences between the 2 monoinfections. In addition, the sample size was insufficient to assess ICU admission and deaths in children. In adults, LOS, the frequency of pneumonia, ICU admission, and CFR did not differ significantly between patients with HCoV monoinfections and those with influenza monoinfections. It is difficult to compare these results with those of other studies because no study compared directly HCoV with influenza. In one study from Southern Brazil conducted during a single season (2012–2013), the CFR was 9% among the 34 HCoV-infected patients (all ages included), compared with 6% in 410 patients infected with another respiratory virus, including 38 with influenza [25].
There are limited data in the literature describing HCoV severity in hospitalized patients. One study reported that younger age (<2 years) and the presence of comorbid conditions were associated with severity in hospitalized children aged <18 years with ARI, but this population was mostly Latino/Hispanic, publically insured, and under active surveillance for respiratory illness [26], and as such it was not representative of the general pediatric population. The frequency of ICU admissions in patients ≥65 years old in our study (7.1%) was lower than in the study of Walsh et al [13], wherein only 2 HCoV subtypes (OC43 and 229 HCoV) were detected (14.1%), while our CFR (7.2%) was higher than in that study (4.2%).
Variability in these results might reflect differences in study populations, patient management strategies, or the distribution or detection of HCoV subtypes, which may be associated with different degrees of severity. It is of note that in our study the proportions of adult patients admitted from LTCFs were comparable between patients with influenza (11.2%) and those with HCoV (9.7%) monoinfection. This is in line with other studies reporting significant morbidity associated with HCoV in LTCF residents, with a clinical picture often mimicking influenza [27, 28].
The proportions of HCoV coinfections in children (75%) and in adults (24%) in our study are at the upper limit of what has been reported in children (36%-78%) [11, 14, 21, 22] and similar to findings in adults (25%–26%) [13, 25]. The role of coinfections in increasing respiratory infections severity remains unclear [29, 30]. This may be explained by different viral combinations across seasons, age groups, specific populations, and geographic regions, specific viral or host interactions, or different criteria for severity.
In our study, HCoV coinfection with another respiratory virus (excluding influenza) was associated with greater risk for pneumonia compared with HCoV infection alone. Greater severity (greater LOS and greater risk of pneumonia/bronchiolitis diagnosis) was also reported in children aged <5 years coinfected with HCoV and another respiratory virus, compared with those infected with HCoV alone [14], and there was a higher risk of ICU admission in children aged <3 years and coinfected with HCoV and rhinovirus C, compared with those who had other respiratory infections [21].
In the context of the current COVID-19 pandemic, it seems important to understand the role of coinfections. In a recent review and meta-analysis of patients hospitalized with COVID-19 during the early period of the pandemic (1 January to 17 April 2020), the pooled proportion of patients hospitalized with COVID-19 and also coinfected with another respiratory virus was 3% (varying between 0% and 25%), with RSV and influenza A the most frequent [31]. That review, however, did not assess the association between coinfections and the severity of COVID-19, a topic that will be especially relevant during the coming winter season.
The proportion of patients with chronic respiratory and chronic cardiovascular disease was higher in adults with HCoV than in those with influenza. Cardiovascular disease and chronic respiratory disease were also identified as risk factors for severe COVID-19 in a recent estimation based on data from 188 countries [32]. Cardiovascular disease was associated with increases in the incidence and in severity of SARS-CoV in general and SARS-CoV-2 in particular [33].
Some hypotheses have been proposed in relation to angiotensin-converting enzyme 2, one receptor of SARS-CoV and SARS-CoV-2 on the human host cell surface (including the heart and human alveolar epithelial cells) [34, 35]. The specific underlying conditions associated with increased severity of COVID-19, as well as the underlying mechanisms for increased susceptibility and severity in some patients are yet to be established [33]. The differences in comorbid conditions between patients with common HCoV and patients with influenza in our study suggest that there may be differences in the risk factors associated with HCoV (and potentially with SARS-CoV-2) compared to influenza and that there is a need to assess the underlying health conditions specific for COVID-19 in order to identify individuals most at risk.
The main limitation of our study is that recruitment was done only during peak weeks of influenza seasons, which may have contributed to an underestimation of overall HCoV contribution to hospitalizations and inaccurate estimation of the relative contribution of each HCoV subtype. However, this limitation does not affect the analysis of comparative outcome severity between influenza and HCoV infection. Second, the total numbers of HCoV and influenza infections in the overall population were not available. If the proportion of mild cases is higher among patients with HCoV than in those with influenza, the analyses including only hospitalized patients would overestimate the overall severity of HCoV vs influenza. As such, the results of the current study apply only to hospitalized patients.
Third, the sample sizes for some of the severity outcomes, especially in children, were limited, mainly owing to the important proportion of coinfections (75% HCoV coinfections and 34% influenza coinfections in children; 24%HCoV coinfections and 10% influenza coinfections in adults). However, to our knowledge, the number of patients with HCoV in our study (n = 340), including both pediatric and adult populations during 8 years is one of the largest published to date. Most of the published studies describing hospitalized patients had a smaller sample size, with the number of patients hospitalized for HCoV ranging from 294 for all ages [17] to 96 in older adults [13] and 489 in children only [22]. Moreover, many studies did not test systematically for other respiratory viruses or used a limited number of viral targets, and therefore some described HCoV infections may in fact have been coinfections with other viruses. In addition, these studies did not compare outcomes in HCoV-infected patients with those in influenza-infected patients.
In conclusion, our data suggest that in patients hospitalized with ARI, HCoV infections are less frequent than influenza infections but generate significant morbidity. HCoV monoinfections are not less severe than influenza monoinfections in children and in adults.
Supplementary Data
Supplementary materials are available at The Journal of Infectious Diseases online. Consisting of data provided by the authors to benefit the reader, the posted materials are not copyedited and are the sole responsibility of the authors, so questions or comments should be addressed to the corresponding author.
Notes
Acknowledgments. We are grateful to Joel Ménard from the Québec public health laboratory (Laboratoire de Santé Publique du Québec) for reverse-transcription polymerase chain reaction analyses and data management. We also thank the staff of participating hospitals, who, through their dedication and strenuous effort during the peaks of influenza season, contributed to the successful running of the project, and France Bouchard and Sophie Auger from the immunization team of the Centre de Recherche du CHU de Québec-Université Laval, for study coordination and technical assistance.
Disclaimer. The funding body was not involved in the study design or in the analysis, interpretation, or reporting of data.
Financial support. This work was supported by the Ministère de la Santé et des Services sociaux du Québec (Quebec Ministry of Health and Social Services).
Potential conflicts of interest. R. G. has received research grants from Sanofi Pasteur for an unrelated study. G. D. S. has received investigator-initiated grants from Pfizer and has received pay for expert testimony from the Ontario Nurse Association, the Quebec Ministry of Justice, and GlaxoSmithKline. All other authors report no potential conflicts. All authors have submitted the ICMJE Form for Disclosure of Potential Conflicts of Interest. Conflicts that the editors consider relevant to the content of the manuscript have been disclosed.
References

