


Abstract
Respiratory syncytial virus (RSV) is a major cause of severe respiratory disease in young children and the elderly. Protective immunity is not generated after repeated infections, but vaccination may hopefully prove effective.
This phase 2 clinical study investigated a multivalent RSV vaccine (MVA-BN-RSV) designed to induce broad antibody and cellular immune responses by encoding RSV surface proteins F, G (for both A and B subtypes), and internal antigens (M2, N). This study evaluated the immune response in adults aged ≥55 years to identify the optimal MVA-BN-RSV dose and vaccination schedule.
A single dose increased the levels of neutralizing (plaque reduction neutralization test to RSV A and B) and total (IgG and IgA ELISA) antibodies (1.6 to 3.4-fold increase from baseline) and induced a broad Th1-biased cellular immune response (interferon-γ ELISPOT) to all 5 vaccine inserts (5.4 to 9.7-fold increases). Antibody responses remained above baseline for 6 months. A 12-month booster dose elicited a booster effect in antibody and T-cell responses (up to 2.8-fold from preboost levels). No drug-related serious adverse events were reported.
MVA-BN-RSV induces a broad immune response that persists at least 6 months and can be boosted at 12 months, without significant safety findings.
NCT02873286
Respiratory syncytial virus (RSV) is a major cause of respiratory disease in the general population, with infants and older adults being particularly vulnerable [1]. In elderly and high-risk adults, RSV infections can be a serious health concern with complications from lower respiratory tract infection being a major contributor to mortality. Approximately 177 000 hospitalizations and 14 000 deaths due to RSV occur annually in the US population aged ≥65 years [2, 3]. For underlying respiratory and circulatory deaths, 78% of RSV-associated deaths occurred among persons ≥65 years [1].
By age 2 years, >90% of infants experienced their first RSV infection [4], followed by frequent reinfections because RSV infections do not induce a sustainable, long-lasting protective immunity [5]. The immunologic factors responsible for RSV protection are not completely understood and infected individuals can produce a wide range of neutralizing antibodies [5, 6]. Severity of RSV disease was found to be associated with lower neutralizing antibodies levels and CD8 memory T-cells [5, 7]. Notably, nasal IgA antibody levels are more correlated with RSV protection than serum antibodies [8].
The novel RSV vaccine candidate MVA-BN-RSV is a live recombinant vaccine based on a nonreplicating modified vaccinia Ankara (MVA-BN) poxvirus that fails to replicate in human cells [9]. During the clinical development of MVA-BN as a smallpox vaccine, over 7800 participants have been vaccinated without significant safety findings and MVA-BN is licensed as a smallpox and monkeypox vaccine [10–12]. MVA-BN-RSV has been targeted to induce broad antibody and cellular immune responses and encodes multiple RSV proteins: the glycoprotein (G) from subtypes A and B, the conserved fusion protein (F) that are both surface proteins known to induce antibody responses [13], together with the internal matrix protein (M2) and the nucleocapsid protein (N).
A phase 1 study has demonstrated that MVA-BN-RSV can elicit both T-cell and antibody responses [14]. This phase 2 study was designed to identify the optimal dose and vaccination schedule. Additionally, the trial explored whether a booster dose 12 months after initial vaccination could recall previously induced immune responses.
METHODS
Study Design
RSV-MVA-002 was a randomized, single-blind, placebo-controlled phase 2 trial in older adults (≥55 years). Study participants were blinded and randomly assigned to 5 groups (1:1:1:1:1 ratio). The single-low-dose or single-high-dose groups received 1 × 10⁸ infectious units (InfU) or 5 × 10⁸ InfU of MVA-BN-RSV at week 0 and placebo at week 4; the 2-low-dose or 2-high-dose groups received 1 × 10⁸ InfU or 5 × 10⁸ InfU of MVA-BN-RSV at weeks 0 and 4; the placebo group received placebo at weeks 0 and 4. Main eligibility criteria were age ≥55 years with no symptomatic cardiopulmonary or metabolic disease and no clinically significant laboratory values. Randomization was stratified by age (≥55 years to <70 years, and ≥70 years), with at least 20% being ≥70 years. One year after the first vaccination, 43 participants in the single-low-dose group and 45 in the single-high-dose group received 1 booster vaccination of the same dose (booster phase) if they still fulfilled eligibility criteria and consented to the booster study.
All enrolled participants were informed of all trial aspects and signed an informed consent form (Supplementary Material). The clinicaltrials.gov registry number is NCT02873286; clinical study reports are dated 23 November 2018 (main phase) and 26 August 2019 (booster).
Vaccine
MVA-BN-RSV consists of MVA-BN [9] encoding 5 codon optimized RSV antigens: F (A long), G (A [strain A2]), G (B [strain 185 37]), N, and M2 (both strain A2). MVA-BN-RSV and placebo were supplied by Bavarian Nordic A/S, Denmark. MVA-BN-RSV was provided as a liquid frozen formulation containing 5 × 10⁸ InfU per 0.5 mL and placebo consisted of the MVA-BN formulation buffer (Tris buffered saline). For the 1 × 10⁸ InfU dose, the vaccine was diluted with placebo. Injections were given intramuscularly.
Immunogenicity Assessments
Antibody responses to MVA-BN-RSV in serum were determined using RSV-specific immunoglobulin G (IgG) enzyme-linked immunosorbent assay (ELISA), IgA ELISA (both using RSV A Long strain as antigens), plaque reduction neutralization test (PRNT; subtype A) and PRNT (subtype B), and RSV G-protein specific IgG ELISAs (G[A] and G[B]), using recombinant G-protein from RSV A (strain rsb1734) and RSV B (strain B1) as antigens. Mucosal responses (nasal swabs) were determined using an IgA ELISA (antigen, RSV A Long strain). Cellular immune responses were assessed by interferon-γ/interleukin-4 (IFN-γ/IL-4) enzyme-linked immunospot assay (ELISPOT) in peripheral blood mononuclear cells (PBMC) (in group-subsets) with RSV-protein peptide pools (F, G[A], G[B], M2, N) and RSV for restimulation (Supplementary Material).
Safety Assessments
Participants were monitored for ≥30 minutes post vaccination. Solicited and unsolicited symptoms were collected over 8- and 29-day follow-up periods, respectively, as well as any serious adverse events (SAEs) during the whole trial period. Solicited symptoms included injection site adverse events (AEs; pain, erythema, swelling, induration, and pruritus) and systemic AEs (increased body temperature, headache, myalgia, chills, nausea, and fatigue) captured in a daily symptom diary, all graded by severity. Safety hematologic and biochemical tests were performed at screening, 2 weeks after each vaccination, and if medically indicated.
Statistical Methods
Primary antibody response and safety analyses were performed on the full analysis set (full set, all participants who received ≥1 vaccination with data available) and on the booster full analysis set (booster set, all participants who received the booster vaccination with data available). Analyses of cellular immune responses were performed on the cellular immunogenicity analysis set (cellular set), a subset of participants in the full set or the booster set with PBMC collection.
Immunogenicity endpoints were summarized by calculating geometric mean titers (GMT) or geometric mean spot forming units (GMSFU) and 95% confidence interval (CI) by taking the antilogarithm of the mean of the log10 titer/SFU transformations. Similarly, geometric mean fold increases (GMFI) were calculated based on the log10 transformations of the participants’ postbaseline titers divided by the baseline titers. AEs were evaluated per participant and vaccination period.
RESULTS
In total, 420 participants were vaccinated and included in the full set; 410 received both vaccinations and 405 completed the trial until the 6-month follow-up visit (Figure 1). Among these, 113 participants (21 to 25 per group) provided PBMC samples (cellular set). About 12 months after the first vaccination, 43 participants from the single-low-dose group and 45 from the single-high-dose group received a same-dose booster vaccination. In this booster set, 30 participants (15 per group) provided PBMC samples for cellular analyses. All participants except for 1 completed the booster phase until the 1-year follow-up (Figure 1).
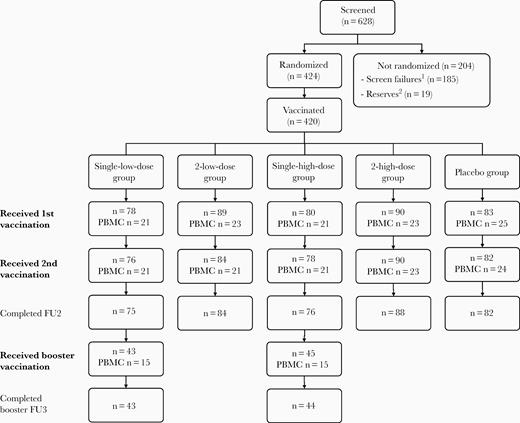
Disposition of all participants. First vaccination given at week 0, second vaccination given at week 4, and the booster vaccination at week 56. Single-low-dose group, 1 × 10⁸ InfU MVA-BN-RSV/placebo; 2-low-dose group, 1 × 10⁸ InfU MVA-BN-RSV/1 × 108 InfU MVA-BN-RSV; single-high-dose group, 5 × 10⁸ InfU MVA-BN-RSV/placebo; 2-high-dose group, 5 × 10⁸ InfU MVA-BN-RSV/5 × 108 InfU MVA-BN-RSV; placebo group, placebo/placebo. 1Not eligible. 2Eligible but not randomized (enrolment closed as the full sample size had been reached). Abbreviations: FU2, main study follow-up 2 (week 30; 6-month follow-up); FU3, booster study follow-up 3 (booster week 52; overall week 108); InfU, infectious units; n, number of study participants; MVA-BN-RSV, multivalent respiratory syncytial virus vaccine; PBMC, peripheral blood mononuclear cells.
Demographics and Baseline Characteristics
The treatment groups were comparable for demographic and baseline characteristics. The mean age was 64.8 to 65.6 years with 30% to 32.5% of participants ≥70 years. All treatment groups had more women (range, 57.8% to 65.6%) and participants were mostly white (Table 1). The 2 booster groups had comparable demographic data (Supplementary Table 1).
Demographics and Baseline Characteristics (Full Analysis Seta)
| Characteristic | Single-Low-Dose Group (N = 78), Cellular Set (N = 21) | 2-Low-Dose Group (N = 89), Cellular Set (N = 23) | Single-High-Dose Group (N = 80), Cellular Set (N = 21) | 2-High-Dose Group (N = 90), Cellular Set (N = 23) | Placebo Group (N = 83), Cellular Set (N = 25) |
|---|---|---|---|---|---|
| Age, y | |||||
| Mean (SD) | 65.1 (8.09) | 64.8 (7.78) | 65.3 (7.18) | 65.0 (7.93) | 65.6 (7.20) |
| Median (range) | 65.0 (55–83) | 64.0 (55–87) | 64.0 (55–87) | 63.0 (55–87) | 65.0 (55–86) |
| Age range, y, n (%) | |||||
| ≥55 to <70 | 53 (67.9) | 61 (68.5) | 56 (70.0) | 63 (70.0) | 56 (67.5) |
| ≥70 | 25 (32.1) | 28 (31.5) | 24 (30.0) | 27 (30.0) | 27 (32.5) |
| Sex, n (%) | |||||
| Female | 47 (60.3) | 56 (62.9) | 49 (61.3) | 59 (65.6) | 48 (57.8) |
| Male | 31 (39.7) | 33 (37.1) | 31 (38.8) | 31 (34.4) | 35 (42.2) |
| Race, n (%) | |||||
| Black/African American | 9 (11.5) | 15 (16.9) | 14 (17.5) | 21 (23.3) | 11 (13.3) |
| White | 69 (88.5) | 69 (77.5) | 66 (82.5) | 69 (76.7) | 71 (85.5) |
| Othersa | 0 | 5 (5.6) | 0 | 0 | 1 (1.2) |
| IgG ELISA, GMT (95% CI) | 1578.4 (1394.0–1787.3) | 1488.6 (1322.4–1675.8) | 1636.1 (1421.9–1882.6) | 1819.5 (1595.2–2075.2) | 1672.2 (1480.7–1888.4) |
| PRNT A, GMT (95% CI) | 256.4 (214.2–307.0) | 208.0 (180.0–240.3) | 234.9 (200.4–275.3) | 276.4 (235.9–323.9) | 251.7 (213.7–296.6) |
| IFN-γ ELISPOT pool F,b GMSFU (95% CI) | 283.2 (210.1–381.7) | 141.3 (88.9–224.6) | 142.6 (85.4–238.3) | 245.8 (162.2–372.2) | 138.9 (83.8–230.2) |
| IFN-γ ELISPOT RSV total,b GMSFU (95% CI) | 432.7 (278.3–672.8) | 258.6 (160.1–417.7) | 226.9 (122.0–421.7) | 435.0 (291.0–650.3) | 253.3 (169.9–377.7) |
Single-low-dose group, 1 × 10⁸ InfU MVA-BN-RSV/placebo; 2-low-dose group, 1 × 10⁸ InfU MVA-BN-RSV/1 × 108 InfU MVA-BN-RSV; single-high-dose group, 5 × 10⁸ InfU MVA-BN-RSV/placebo; 2-high-dose group, 5 × 10⁸ InfU MVA-BN-RSV/5 × 108 InfU MVA-BN-RSV; placebo group, placebo/placebo.
Abbreviations: %, percentage based on N; CI, confidence interval; ELISA, enzyme-linked immunosorbent assay; ELISPOT, enzyme-linked immunospot technique; IFN-γ, interferon gamma; GMSFU, geometric mean spot forming units; GMT, geometric mean titer; IgG, immunoglobulin G; InfU, infectious units; N/n, number of participants; PBMC, peripheral blood mononuclear cells; PRNT, plaque reduction neutralization test; SD, standard deviation; y, years.
aIncludes Asian, American Indian/Alaskan Native, Native Hawaiian/Pacific Islanders.
bCellular set for PBMC data (subset of participants in the full set with PBMC collection).
Baseline antibody levels were similar across all 5 groups for all assays (Table 1 and Supplementary Table 2). However, there was variability between treatment groups in the baseline T-cell levels, with nearly 2-fold higher GMSFUs in the single-low-dose and 2-high-dose groups compared to the other 3 groups (Table 1 and Supplementary Table 3). The wide 95% confidence intervals reflect large within group variability likely due to the small sample size in the cellular set.
Antibody Responses in the Main Study
All participants recorded antibodies against RSV at baseline, but vaccination induced fast booster responses with peak titers after 2 weeks and GMTs remained elevated at week 30 (Supplementary Table 2 and Supplementary Figure 1).
When comparing the 2 vaccine doses at week 2, at a time when only 1 vaccination had been administered, GMFIs were significantly higher for 6 out of the 7 antibody parameters measured in the high-dose groups compared to the respective low-dose groups (Figure 2A). The GMFIs for the serum antibody assays in the high-dose groups ranged from 1.3 (PRNT B) to 3.4 (IgA ELISA), compared to GMFI from 1.2 (PRNT B) to 2.4 (IgA ELISA) in the low-dose groups. RSV-specific IgA responses were also detected in nasal swabs 2 weeks after MVA-BN-RSV vaccination with a GMFI of 1.4 (single-high-dose group) (Figure 2A) and a ratio of 1.35 (95% CI, 1.11–1.65) compared to placebo. Additional analyses suggested that the increase mainly occurred in participants with lower baseline mucosal IgA titers. When baseline titer was below 12 (the overall median), GMFI was 2.12 compared to 0.95 in participants with baseline titer ≥12.
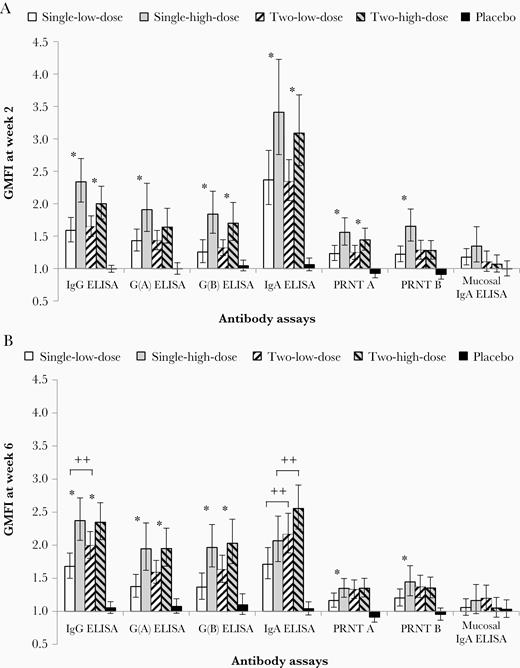
Antibody immune responses to MVA-BN-RSV at week 2 and 6 (full analysis set). Antibody responses (all employed test methods) are displayed for all 5 treatment groups as GMFI at week 2 (A) and at week 6 (B), that is 2 weeks after the first (A) or the second vaccination (B). The first vaccination was given at week 0 and the second vaccination at week 4. Error bars are based on 95% CI. *, significant difference (high/low dose) between 2 groups based on 95% CI not including 1.00. ++, significant difference (2 vaccinations/single vaccination) between 2 groups based on 95% CI not including 1.00. Single-low-dose group, 1 × 10⁸ InfU MVA-BN-RSV/placebo; 2-low-dose group, 1 × 10⁸ InfU MVA-BN-RSV/1 × 108 InfU MVA-BN-RSV; single-high-dose group, 5 × 10⁸ InfU MVA-BN-RSV/placebo; 2-high-dose group, 5 × 10⁸ InfU MVA-BN-RSV/5 × 108 InfU MVA-BN-RSV; placebo group, placebo/placebo. Abbreviations: CI, confidence interval; ELISA, enzyme-linked immunosorbent assay; GMFI, geometric mean fold increase; IgA, immunoglobulin A; IgG, immunoglobulin G; InfU, infectious units; MVA-BN-RSV, multivalent respiratory syncytial virus vaccine; PRNT, plaque reduction neutralization test.
The second vaccinations given at week 4 had no significant impact on most antibody parameters measured regardless of dose (Figure 2B). At week 6, the only significant differences were observed for IgG (GMFI of 1.7 versus 2.0 for 1 and 2 vaccinations, respectively) and IgA (1.7 versus 2.2) between the low-dose groups, and IgA (2.1 versus 2.6) between the high-dose groups. For all antibody responses measured other than IgA, the single-high-dose group generated a higher, or equal response compared to all other groups at all timepoints.
Although antibody levels declined by week 30, they remained elevated above baseline for all ELISA measurements and PRNT(B) in the vaccination groups (Supplementary Table 2 and Supplementary Figure 1). Subgroup analyses of PRNT(A) and IgA revealed no meaningful difference or consistent trend between the ≥55 to <70 years and the >70 years groups across all treatment arms (not shown).
Cellular Immune Responses in the Main Study
At baseline most participants had T-cell signals with IFN-γ ELISPOT GMSFU (RSV total) between 226.9 and 435.0 (Table 1). IFN-γ ELISPOT for peptide pools were also positive at baseline, with the highest level in pool F and lowest level in pool M2 in all groups (Supplementary Table 3 and Supplementary Figure 2). For T-cell responses, GMFIs at week 1 (Figure 3A) were higher in the single-high-dose group (range, 5.4 to 9.7) compared to the 2-low-dose group (range, 4.5 to 5.9) where baseline T-cell levels were similar. No further increases were observed after the second vaccination regardless of dose or baseline levels (Figure 3B). By week 5, T-cell responses had declined but remained elevated above baseline with the best results observed in the single-high-dose group with GMFIs ranging from 2.4 (G[B] protein) to 4.7 (N protein). Together with results from antibody responses, a single high dose was considered the recommended dosing regimen.
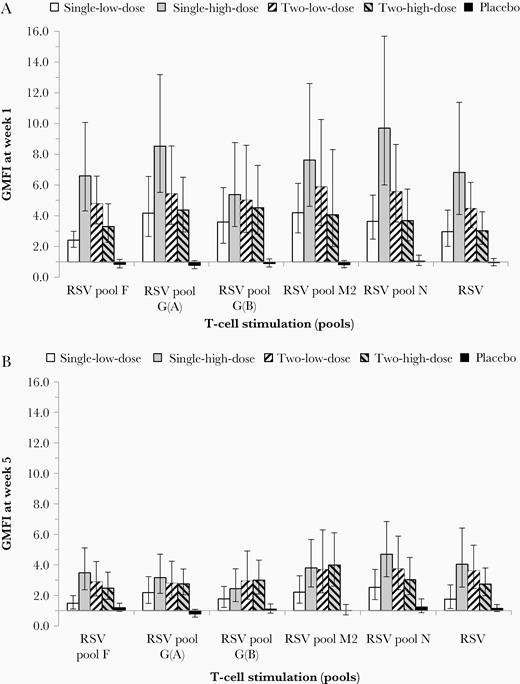
Cellular immune responses (IFN-γ ELISPOT) to MVA-BN-RSV at week 1 and 5 (cellular immunogenicity analysis set, main phase). Cellular immune responses for all 5 treatment groups are shown based on IFN-γ ELISPOT signals after stimulation by all RSV peptide pools and RSV. GMFI either 1 week after the first (week 1; A) or after the second (week 5; B) vaccination are displayed. First vaccination given at week 0, second vaccination given at week 4. Error bars are based on 95% CI. Single-low-dose group, 1 × 10⁸ InfU MVA-BN-RSV/placebo; 2-low-dose group, 1 × 10⁸ InfU MVA-BN-RSV/1 × 108 InfU MVA-BN-RSV; single-high-dose group, 5 × 10⁸ InfU MVA-BN-RSV/placebo; 2-high-dose group, 5 × 10⁸ InfU MVA-BN-RSV/5 × 108 InfU MVA-BN-RSV; placebo group, placebo/placebo. Abbreviations: CI, confidence interval; ELISPOT, enzyme-linked immunospot technique; GMFI, geometric mean fold increase; IFN-γ, interferon gamma; InfU, infectious unit; MVA-BN-RSV, multivalent respiratory syncytial virus vaccine.
Most participants responded to multiple RSV proteins simultaneously, demonstrating broad MVA-BN-RSV–induced T-cell responses at a participant level. In all active treatment groups, more than 60% of the participants (range 62% to 100%) responded (increase ≥2-fold from baseline in ≥2 postbaseline measurements) to 3 or more different RSV proteins and 43% to 65% of participants responded to all 5 RSV proteins encoded in the MVA-BN-RSV vaccine. In the single-high-dose group, all participants responded to at least 3, and 65% responded to all 5, RSV proteins.
IL-4 signals were low or below the detection limit in all treatment groups (Supplementary Figure 2), indicating a T helper 1 (Th1)-biased T-cell response. The placebo group showed no changes in GMSFU over time for either IFN-γ or IL-4.
Immune Responses Following a Booster Vaccination After 12 Months
Antibody and cellular immune responses were measured 1 year after the initial vaccination in the booster set (Figure 1). Average antibody levels for most assays and T-cell signals were still higher at week 56 compared to week 0 in both groups (Figure 4, Supplementary Table 4, and Supplementary Table 5), thus demonstrating persistence of MVA-BN-RSV–induced immune responses for up to 1 year.
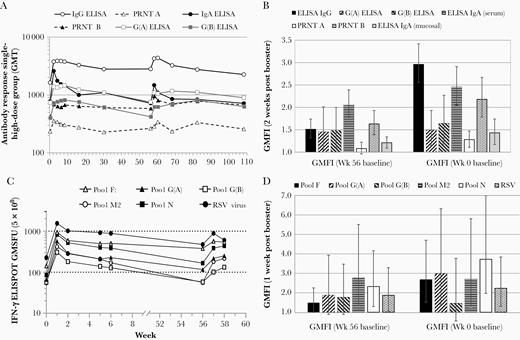
Immune responses before and after booster vaccination. A, GMTs of all serum antibody assays of the single-high-dose group (5 × 10⁸ InfU) are shown up to week 108. GMTs from week 0 to week 30 were based on the full set of 80 participants; GMTs from week 56 to week 108 were based on the booster set of 45 participants. B, GMFIs 2 weeks after the booster vaccination of the single-high-dose group in the booster set are shown for all antibody responses tested. GMFI are either calculated from week 0 baseline signals (right) or from week 56 baseline (left). C, IFN-γ ELISPOT GMSFU of the single-high-dose group after stimulation with all RSV peptide pools (and RSV) are displayed up to week 58. GMSFUs from week 0 to week 6 were based on the full cellular set of 20 participants; GMSFUs from week 56 to week 58 were based on the booster cellular set of 15 participants. D, IFN-γ ELISPOT GMFI 1 week after the booster vaccination of the single-high-dose group after stimulation with all RSV peptide pools (and RSV) are shown. GMFI are either calculated from week 0 baseline signals (right) or from week 56 baseline (left). The first vaccination was given at week 0, the second vaccination at week 4, and the booster vaccination at week 56. Abbreviations: ELISA, enzyme-linked immunosorbent assay; ELISPOT, enzyme-linked immunospot technique; GMFI, geometric mean fold increase; GMSFU, geometric mean spot forming units; GMT, geometric mean titer; IFN-γ, interferon gamma; IgA, immunoglobulin A; IgG, immunoglobulin G; InfU, infectious units; PRNT, plaque reduction neutralization test; RSV, respiratory syncytial virus.
A booster vaccination of MVA-BN-RSV after 1 year elicited antibody responses similar to or higher than peak initial response, with peak GMTs observed 2–4 weeks post booster (Figure 4A and Supplementary Table 5). GMFIs for all serum antibody assays at week 58 (2 weeks post booster) ranged from 1.3 (PRNT A) to 3.0 (IgG ELISA) in the single-high-dose group of the booster set (Figure 4B), which was similar to GMFIs at week 2 in the single-high-dose group of the full set (1.6 [PRNT A] to 3.4 [IgA ELISA]) (Figure 2A). Fold increases from the week 56 baseline were lower, ranging from 1.1 (PRNT A) to 2.1 (IgA ELISA) (Figure 4B). IFN-γ T-cell signals also increased following the booster vaccination for all tested peptide pools and RSV (Figure 4C and Supplementary Table 4). At week 57 (1 week post booster) GMFIs were 1.5-fold (pool F) to 2.8-fold (pool M2) above week 56 and 1.5-fold (pool G[B]) to 3.7-fold (pool N) above week 0 (Figure 4D).
Safety and Reactogenicity
Neither drug-related SAEs nor deaths occurred in this study. Two participants discontinued from the second vaccination due to AEs (Table 2): 1 was a nonserious anemia diagnosed 36 days after first vaccination. Another participant discontinued from the trial because of an SAE of acute pancreatitis, which occurred 3 days after first vaccination. This participant with several underlying conditions had experienced symptoms of pancreatitis (nausea, vomiting) already shortly before vaccination and was considered to have developed pancreatitis due to her many comedications. Both events were considered unrelated to study medication and resolved.
Summary of Solicited and Unsolicited Adverse Events (Full Analysis Set)
| Adverse Event | Single-Low-Dose Group, n (%)/E (N = 78) | 2-Low-Dose Group, n (%)/E (N = 89) | Single-High-Dose Group, n (%)/E (N = 80) | 2-High-Dose Group, n (%)/E (N = 90) | Placebo Group, n (%)/E (N = 83) |
|---|---|---|---|---|---|
| TEAE | 61 (78.2) / 223 | 78 (87.6) / 370 | 75 (93.8) / 393 | 86 (95.6) / 481 | 62 (74.7) / 248 |
| Nonserious TEAE | 60 (76.9) / 219 | 76 (85.4) / 366 | 75 (93.8) / 390 | 86 (95.6) / 479 | 61 (73.5) / 241 |
| SAEa | 2 (2.6) / 4 | 4 (4.5) / 4 | 3 (3.8) / 3 | 2 (2.2) / 2 | 5 (6.0) / 7 |
| Relatedb SAEs | 0 / 0 | 0 / 0 | 0 / 0 | 0 / 0 | 0 / 0 |
| Relatedb TEAE | 28 (35.9) / 64 | 37 (41.6) / 109 | 51 (63.8) / 126 | 58 (64.4) / 164 | 31 (37.3) / 63 |
| TEAE graded ≥ 2 | 27 (34.6) / 62 | 43 (48.3) / 104 | 48 (60.0) / 149 | 70 (77.8) / 156 | 20 (24.1) / 56 |
| TEAE graded ≥ 3 | 7 (9.0) / 20 | 8 (9.0) / 9 | 11 (13.8) / 29 | 15 (16.7) / 19 | 5 (6.0) / 11 |
| Relatedb TEAE graded ≥ 3 | 3 (3.8) / 8 | 4 (4.5) / 5 | 6 (7.5) / 18 | 8 (8.9) / 10 | 0 / 0 |
| AE leading to withdrawal from 2nd vaccination | 0 / 0 | 1 (1.1) / 1 | 1 (1.3) / 1 | 0 / 0 | 0 / 0 |
| AE leading to withdrawal from trial | 0 / 0 | 0 / 0 | 0 / 0 | 0 / 0 | 0 / 0 |
| Deaths | 0 / 0 | 0 / 0 | 0 / 0 | 0 / 0 | 0 / 0 |
Single-low-dose group, 1 × 10⁸ InfU MVA-BN-RSV/placebo; 2-low-dose group, 1 × 10⁸ InfU MVA-BN-RSV/1 × 108 InfU MVA-BN-RSV; single-high-dose group, 5 × 10⁸ InfU MVA-BN-RSV/placebo; 2-high-dose group, 5 × 10⁸ InfU MVA-BN-RSV/5 × 108 InfU MVA-BN-RSV; placebo group, placebo/placebo.
Abbreviations: %, percentage based on N; AE, adverse event; E, number of events recorded; InfU, infectious units; N/n, number of participants; SAE, serious adverse event; TEAE, treatment-emergent adverse event.
aSAEs are included even if they exceeded the 29-day follow-up period after each vaccination.
bUnsolicited or general solicited AEs the investigator considered to have possible, probable, or certain relationship to the vaccine. Although solicited local events are, by definition, always adverse drug reactions, they are not included here.
Of 420 vaccinated participants, 8 participants (1.9%) reported 10 SAEs during the first 8 weeks of the study; in the follow-up phase (up to week 30) 8 participants reported 10 SAEs, resulting in a total of 20 SAEs; 13 from MVA-BN-RSV groups and 7 from the placebo group (Supplementary Table 6); none were considered treatment related. Low percentages of grade ≥3 AEs (including solicited AEs) within 29 days post vaccination were observed, with slightly higher incidence rates in the high-dose (15.3%) compared to the low-dose groups (9.0%) and placebo (6.0%) (Table 2; for unsolicited AEs see Supplementary Table 7).
Most solicited AEs were mild and resolved within 3 days, with injection site pain being the most reported AE (range 52.6% to 86.7% in active treatment groups vs 16.9% in placebo), followed by myalgia (18.0% to 40.0% vs 10.8% in placebo). Grade 3 events in the high-dose groups included injection site pain (5.9%), myalgia (4.7%), fatigue (4.1%), chills (3.0%), headache (1.2%), and nausea (0.6%). In the low-dose groups, they were myalgia (2.4%), headache and fatigue (1.8% each), chills and nausea (0.6% each) (Supplementary Table 8 and Supplementary Table 9). Use of antipyretics or analgesics within 8 days following vaccination were higher in the MVA-BN-RSV groups (6.4% to 12.4%) compared to the placebo group (1.2%), which is in line with higher incidences of systemic reactions. Use of these medications during the 29-day period following vaccination were similar across all groups (range, 12.0% to 22.5%), consistent with the transient nature of the systematic and local reactions.
Clinical laboratory monitoring revealed no significant changes in laboratory results following vaccinations.
DISCUSSION
MVA-BN-RSV was found to be well tolerated with a favorable safety profile and no vaccine-related SAEs reported in over 330 older adults vaccinated in this study. The frequency and pattern of adverse reactions was transient, comparable with routinely administered injectable vaccines, and comparable to the clinical safety data generated for the licensed vaccine vector MVA-BN [10–12]. The study also demonstrated that a single vaccination with the high dose could recall memory responses and induced rapid and broad humoral and T-cell responses to multiple protein targets of RSV. These responses were shown to be durable 6 months later, covering an entire RSV season, and although many of the immunological parameters remained elevated after 12 months, they could be further boosted with an annual booster vaccination. The results from this study confirm the trends observed in phase 1, which was performed in the age groups 18–49 and 50–65 years [14].
Vaccine development often focuses on the induction of neutralizing antibodies to prevent infection from a virus. Higher naturally acquired RSV neutralizing antibody titers have been shown to be associated with less RSV-related hospitalization [15, 16] and maternal antibody levels are closely correlated with the risk of RSV disease in infants [17]. The administration of high doses of neutralizing antibodies has also been found to protect some children from severe RSV disease [18, 19]. Thus, many RSV vaccine candidates have targeted single RSV proteins, for example, fusion protein (F) [16, 20] or glycoprotein protein (G), both known to induce neutralizing antibodies [21]. However, recent late-phase clinical trials with F protein vaccines failed to demonstrate protection against the primary outcome for RSV disease even though neutralizing antibodies were induced in older adults [22, 23], or in infants through maternal vaccination [24]. These setbacks challenge the notion that neutralizing antibodies alone, especially directed to the F protein, are a sufficient correlate of efficacy against RSV.
MVA-BN-RSV induced a broad range of antibody responses and although the neutralizing antibodies against RSV A and RSV B were modest (< 2-fold increase), possibly due to high baseline titers, these were comparable to increases of neutralizing antibodies observed with other RSV vaccine candidates [16, 23, 25, 26]. However, MVA-BN-RSV boosted various IgG ELISA parameters at least 2-fold in a population preexposed to RSV. Interestingly, the strongest antibody parameter boosted in the serum was IgA against RSV (>3-fold increase) and together with the detection of IgA from nasal swabs implies that a mucosal response may have been induced following vaccination. This could be significant, as low RSV-specific nasal IgA have been implicated as a significant risk factor for RSV infection in humans [27] and RSV-specific nasal IgA was shown to correlate stronger with protection from upper airway disease by RSV infection in a human challenge study than serum neutralizing antibody [8].
T-cells are also known to be important for RSV clearance in preclinical models [28, 29] and a pivotal role has been suggested in infants [30]. Children with compromised T-cell responses suffer longer and more severely from RSV disease [31]. Furthermore, severe RSV disease with high mortality rate is seen in adult bone marrow transplant recipients, particularly in recipients with neutropenia, lymphopenia, or with graft-versus-host disease [32]. Adults who have had severe RSV disease seem to have more robust T-cell responses post infection [33–35], suggesting T-cell activation is an important path for adaptive RSV immunity. Vaccination with MVA-BN-RSV induced T-cell responses against multiple RSV proteins with peak responses 5 to 10-fold above baseline, higher than T-cell responses described previously using an F protein-based RSV vaccine [23] or viral vector vaccines [25, 26]. Notably, most vaccinated participants described here were T-cell responders to multiple RSV inserts, demonstrating the induction of a broad cellular immune response by MVA-BN-RSV. This coupled with the induction of antibodies is encouraging, as an adult challenge study indicated that activated CD8 T-cells play an important role in eliminating RSV infected cells, reducing symptom severity and viral load [7].
RSV is well recognized as a cause of severe lower tract respiratory disease in the elderly. Although immunosenescence may make this population more vulnerable, how pre- and postinfection events are associated with disease severity in this population is not fully understood. The level of IFN-γ–producing T-cells was also found to be much lower in the elderly compared to young adults, while there was no difference in neutralizing antibody titers [34]. Data from the study described here suggest that antibody responses in the ≥70 years subgroup are not different from the ≥55 to <70 years subgroup. This is consistent with observation from the phase 1 study where no material differences were noted in the immune responses induced by MVA-BN-RSV in younger (18–49 years) and older participants (50–65 years) [14]. This may reflect the strong ability of MVA to boost primed memory responses. Collectively, the evidence supports the hypothesis that a vaccine that significantly boosts the level of RSV specific IFN-γ producing T-cells may confer protection against severe RSV disease in this older population.
Antibody response following MVA-BN-RSV, although moderate, provides the first line of defense against RSV in the extracellular space. Further, preclinical studies with MVA-BN-RSV indicate that complete protection from RSV requires both RSV-specific antibodies and CD4/CD8 T-cells (K. Endt, Y. Wollmann, J. Haug et al., unpublished data), challenging the traditional method of using a single parameter to determine vaccine efficacy. The rapid immune responses after initial vaccination and the lack of increased response after the second vaccination seen with MVA-BN-RSV are consistent with other studies [25] and likely reflect the booster-like nature of this vaccine in a preexposed population.
Antibodies were boosted by an additional vaccination after 12 months to levels similar or higher than the peak titers triggered by initial vaccination. Peak T-cell responses following the booster vaccination were lower than peak responses following the initial vaccination, suggesting that activation of T-cells may be regulated by preexisting levels of antigen-specific T-cells. This is consistent with the observation that a second vaccination did not induce further T-cell responses. It should be noted that the cellular set that investigated T-cell responses is relatively small and the variability could partially be explained by the small sample size.
In summary, this phase 2 trial demonstrated that the novel multivalent vaccine candidate MVA-BN-RSV induced broad T-cell responses against all 5 encoded RSV antigens, coupled with broad humoral responses, including IgA. The broad immune response elicited by the vaccine suggests that it may activate various adaptive immune responses against RSV, which are expected to contribute to different pathways of protection and the efficacy afforded by MVA-BN-RSV merits to be investigated in a phase 3 efficacy trial.
Supplementary Data
Supplementary materials are available at The Journal of Infectious Diseases online. Consisting of data provided by the authors to benefit the reader, the posted materials are not copyedited and are the sole responsibility of the authors, so questions or comments should be addressed to the corresponding author.
Notes
Acknowledgments. We thank the participants of the clinical trial, the clinical site investigators and their staff, Carolin Schmittwolf for assay development, Nicole Baedeker for clinical trial sample logistics, Claudia Burkhart for quality control review of the manuscript, and Jacqueline Powell for manuscript review.
Author contributions. E. J. contributed supervision, conceptualization, methodology, and writing. S. J. L. contributed supervision, investigation, and resources. T. P. H. M. carried out writing of original draft, methodology, visualization, and validation. D. S. performed supervision, investigation, validation, and writing. S. S. and J. M. carried out project administration. D. S., B. K., and R. G. performed investigations. G. S. performed formal analysis, validation, and software. S. V. performed investigations and validation. L. M. C. performed writing, formal analysis, and software. H. W. and N. S. carried out conceptualization, methodology, and supervision. P. C. contributed conceptualization, methodology, supervision, funding acquisition, and writing. All authors had access to the data and the corresponding author was responsible for submission of the publication.
Financial support. This work was supported by Bavarian Nordic A/S.
Potential conflicts of interest. E. J., T. P. H. M., D. S., S. S., J. M., D. S., B. K., R. G., G. S., S. V., L. M. C., H. W., and P. C. are employees and stakeholders of Bavarian Nordic. N. S. is a consultant of Bavarian Nordic. S. J. L. reports no potential conflicts of interest. All authors have submitted the ICMJE Form for Disclosure of Potential Conflicts of Interest. Conflicts that the editors consider relevant to the content of the manuscript have been disclosed.
Presented in part: 4th ReSViNET Conference, 29 November–1 December 2017, Malaga, Spain, oral presentation; 11th International Respiratory Syncytial Virus (RSV) Meeting, 31 October–4 November 2018, Asheville, NC, poster; and 5th ReSViNET Conference, 12–14 November 2019, Accra, Ghana, poster.
References

