


Abstract
The protection that an influenza vaccine offers can vary significantly from person to person due to differences in immune systems, body types, and other factors. The question, then, is what is the value of efforts to reduce this variability such as making vaccines more personalized and tailored to individuals.
We developed a compartment model of the United States to simulate different influenza seasons and the impact of reducing the variability in responses to the influenza vaccine across the population.
Going from a vaccine that varied in efficacy (0–30%) to one that had a uniform 30% efficacy for everyone averted 16.0–31.2 million cases, $1.9–$3.6 billion in direct medical costs, and $16.1–$42.7 billion in productivity losses. Going from 0–50% in efficacy to just 50% for everyone averted 27.7–38.6 million cases, $3.3–$4.6 billion in direct medical costs, and $28.8–$57.4 billion in productivity losses. Going from 0–70% to 70% averted 33.6–54.1 million cases, $4.0–$6.5 billion in direct medical costs, and $44.8–$64.7 billion in productivity losses.
This study quantifies for policy makers, funders, and vaccine developers and manufacturers the potential impact of efforts to reduce variability in the protection that influenza vaccines offer (eg, developing vaccines that are more personalized to different individual factors).
Within a given influenza season, a vaccine’s ability to protect against disease (ie, vaccine efficacy) can be highly variable among individuals, which prompts the question: What is the value of reducing this variability? Vaccine development currently follows a one-size-fits-all approach for an entire population, with little to no incorporation of individual variability in immune response or genetically determined risk for adverse effects [1]. Although vaccines significantly reduce the burden of infectious disease [2], the current approach is limited in addressing hypervariable and highly complex pathogens [3–6]. Each year, while vaccinated individuals all receive the same formulation of the influenza vaccine, studies have shown that vaccine protection varies considerably among different people [7–9] due to genetic-, age-, and biologic-related differences in humoral and cellular immune responses [4]. Thus, evidence suggests that not everyone’s immune response is the same, causing variability within a given year (which is different than the year-to-year variability due to strain matching between the one included in the annual vaccine and the one circulating). For example, studies suggest that obesity can lead to decreases in antibody response to vaccines [4, 10] and have shown that despite equal serological response to vaccination, overweight individuals can have twice the risk of influenza compared to healthy-weight individuals [10, 11]. As another example, evidence suggests that humoral immunity response and antibody titers vary with genetic variation (ie, polymorphisms) of key immune response genes (eg, human leukocyte antigen, cytokine, and cytokine receptors) [12]. If such variability could be reduced or even eliminated through efforts such as making vaccines more personalized and tailored to individuals to bring everyone to a desired efficacy, decision makers (eg, developers, funders, policy makers) need to understand how this change would impact the spread of influenza, as well as the potential health and economic benefits. To determine this, we used an influenza transmission model linked to an economic outcomes model to simulate the spread of influenza and the epidemiologic and economic impact of reducing variability of influenza vaccine efficacy for a range of maximal seasonal vaccine efficacies.
METHODS
Influenza Transmission Model
Utilizing Microsoft Excel (Microsoft Corporation) with the Crystal Ball add-in (Oracle Corporation), we adapted our previously published susceptible-exposed-infectious-recovered influenza transmission compartment model [13], which represents the entire United States (US) population (2017 estimates) over the course of 1 influenza season. The population (325 719 178 individuals) consists of 6 age groups: 0–4 years, 5–12 years, 13–17 years, 18–49 years, 50–64 years, and ≥ 65 years.
Individuals in the model could be in 1 of 4 mutually exclusive influenza states: (1) susceptible (S, not infected with influenza and able to become infected); (2) exposed (E, infected with influenza, but not able to transmit to others); (3) infectious (I, infected and able to transmit to others); or (4) recovered/immune (R, not infected and unable to become infected). Individuals start in the “S” state with a fraction in the “I” state to seed (ie, start) the influenza season. The model advances in discrete, 1-day time steps, with susceptible and infectious individuals mixing with each other. Each day the following equation governs the number of susceptible individuals who became exposed, moving from the “S” state to “E” state: β × S × I. Beta (β) equals the reproductive rate (R0) divided by the duration of the infectious period and the number of individuals in the population, while S and I represent the number of susceptible and infectious persons, respectively, on any given day. R0 is the average number of secondary cases generated by 1 infectious influenza case. Individuals remain in the “E” state for a duration of the latent period before moving to the “I” state (at a rate of 1 / duration of the latent period). Infectious individuals remain in the “I” state until they recover, moving to the “R” state at the rate of 1 / duration of the infectious period.
Vaccinated individuals move from the “S” state to the “R” state based on vaccine efficacy. We assume protection is complete and immediate such that individuals move to the “R” state on the day of vaccination. Beginning in the last week of August, individuals in the population are vaccinated each day based on the age-specific daily vaccination rate to achieve the total age-specific vaccination coverage level for seasonal influenza in the US on or before 1 April.
FluEcon
Using our previously published FluEcon model [13, 14], we translate the number of vaccinated persons and influenza infections from the transmission model into health outcomes and their corresponding costs from the third-party payer and societal perspectives. Each symptomatic case has probabilities of seeking ambulatory care, being hospitalized, or dying from influenza. Each of these outcomes is associated with costs and health effects. The third-party payer perspective includes direct medical costs (ie, ambulatory care, hospitalization). Societal costs include direct and indirect (ie, productivity losses due to absenteeism and mortality) costs. Hourly wage for all occupations [15] serves as a proxy for productivity losses. Productivity losses for mortality result in the net present value of missed lifetime earnings based on annual wage [15] and years of life lost based on an individual’s life expectancy [16]. We measure health effects in quality-adjusted life-years (QALYs) and calculate these effects as QALYs lost due to influenza (ie, account for reductions in health effects due to influenza and/or death). Each person accrues QALY values based on their age-dependent healthy QALY value attenuated by the influenza-specific utility weight for their illness duration. Death results in the loss of the net present value of QALYs for the remainder of an individual’s lifetime. Thus, FluEcon captures the burden of disease (eg, cost of illness and QALYs lost due to influenza) to show what could be gained by decreasing variability.
Data Sources
Supplementary Table 1 shows key model input parameters, values, and sources. All inputs come from the scientific literature (obtained through an extensive Medline search) or nationally representative data sources and, when available, are age-specific. Additionally, all inputs (except daily vaccination rate, vaccination coverage, and the baseline QALY values) drew from a distribution created based on available data. Where multiple sources are listed, the parameter value represents the mean and standard deviation of all included studies, unless otherwise denoted in Supplementary Table 1. When data were not available, we used ±20% of the point estimate to make a distribution. We held the daily vaccination rate and total vaccination coverage to a point value so that differences between scenarios would represent the effect of reducing the variability in vaccine efficacy and would not additionally be impacted by differences in vaccination coverage across scenarios. Age-specific vaccination coverage comes from the US Centers for Disease Control and Prevention for the 2017–2018 influenza season [17, 18]. Population data come from the US Census Bureau, using the 2017 population estimate [19]. We report all costs in 2019 US dollars, converted using a 3% discount rate.
Scenarios and Sensitivity Analyses
Scenarios consisted of systematically reducing the variability in vaccine efficacy for each maximum seasonal target efficacy across the entire population. For each target efficacy, the base case assumed vaccine efficacy ranged from 0% to the given target value (assuming a uniform distribution), while experimental scenarios narrow the range of variability in vaccine efficacy such that it brings everyone to a desired efficacy (by raising the minimum efficacy in the range). While this increases the protection vaccination garners for some individuals, it also increases the mean vaccine efficacy in the population. For each scenario, we calculated the attack rate (ie, percentage of the population that ends up getting infected with influenza, regardless of symptoms) and the cost of illness (ie, costs and QALYs lost due to influenza). The difference between these scenarios represents the impact of moving those who are vaccinated closer to the maximal target efficacy. We explored reducing the variability in vaccine efficacy over a wide range to represent various possible levels of reduction in that variability and differences in individual responses to the vaccine. Each experiment consists of running a microsimulation of 1000 probabilistic trials (ie, Monte Carlo simulation), varying each parameter throughout their ranges. Multiway sensitivity analyses vary R0 from 1.2 to 2.0 (simulating a base case and experimental scenarios for each R0) and the target vaccine efficacy from 10% to 90%.
RESULTS
Impact of Reducing Efficacy Variability When the Target Vaccine Efficacy Is 10%
A target efficacy of 10% resulted in 92.6 million influenza cases (attack rate of 28%) when efficacy ranged from 0 to 10% (R0 = 1.2). These cases resulted in 127 348 deaths, 1.4 million QALYs lost, $10.8 billion in direct medical costs, and $103.2 billion in productivity losses. Reducing the variability in efficacy to a range of 5%–10% averted 5.8 million (95% confidence interval [CI], 5.4–6.1 million) cases, 11 361 (95% CI, 9062–13 659) deaths, 136 318 (95% CI, 109 232–163 402) QALYs lost, $720 million (95% CI, $612–$829 million) in direct medical costs, and $8 billion (95% CI, $3.5–$12.6 billion) in total costs; further reducing so that everyone had a 10% efficacy averted 11.1 million (95% CI, 10.8–11.4 million) cases, 15 380 (95% CI, 13 148–17 612) deaths, 168 583 (95% CI, 141 267–195 899) QALYs lost, $1.5 billion (95% CI, $1.4–$1.6 billion) in direct medical costs, and $14.6 billion (95% CI, $10.3–$18.8 billion) in total costs. The impact of reducing efficacy variability depends on the transmission dynamics of the influenza season. Reducing the efficacy variability resulted in up to 7.0 and 5.3 million fewer cases (R0 = 1.6 and 2.0, respectively) compared to when efficacy ranged from 0 to 10%, resulting in savings of $6.9 billion (R0 = 1.6) and $3.4 billion (R0 = 2.0) in total costs. However, the peak of the season remained unchanged.
Impact of Reducing Efficacy Variability When the Target Vaccine Efficacy Is 30%
Figure 1 shows how reducing the variability in efficacy impacts the epidemic curve, while Table 1 shows the clinical and economic outcomes averted compared to an efficacy range of 0 to 30% for an R0 of 1.2 (Supplementary Tables 2 and 3 show results for higher R0 values). Reducing efficacy variability resulted in a 2.0% relative reduction to 43.4% relative reduction in the attack rate, depending on the R0 value and efficacy variability range. For example, with an R0 of 1.2, such reductions in variability averted 11.6–31.2 million cases (Table 1) and saved $9.2–$18 billion in total costs (direct medical costs plus productivity losses).
Epidemiologic and Economic Outcomes Averted by Reducing the Variability of Influenza Vaccine Efficacy Across the United States Population, Assuming a Reproductive Rate of 1.2
| Range of Vaccine Efficacy | Absolute Reduction in Attack Rate, % | No. of Influenza Cases Averted, Millions | Deaths Averted | QALY Losses Averted | Direct Medical Costs Averted, Billions, US$ | Productivity Losses Averted, Billions, US$ |
|---|---|---|---|---|---|---|
| When the target vaccine efficacy is 30%, impact of reducing efficacy variability compared to a vaccine efficacy range of 0–30% | ||||||
| 10%–30% | 3.6 | 11.6 (10.6–12.6) | 17 167.4 (14 946.3–19 388.4) | 179 539.5 (153 546.9–205 532.2) | 1.3 (1.1–1.4) | 14.5 (10.9–18.1) |
| 20%–30% | 6.7 | 21.7 (20.8–22.5) | 31 057.3 (29 057.7–33 056.8) | 341 560.7 (318 214.7–364 906.6) | 2.5 (2.3–2.6) | 28.8 (25.6–32.0) |
| 30% | 9.6 | 31.2 (30.4–32.0) | 44 448.3 (42 548.4–46 348.1) | 498 740.3 (476 594.6–520 886.0) | 3.6 (3.5–3.7) | 41.9 (38.9–44.8) |
| When the target vaccine efficacy is 50%, impact of reducing efficacy variability compared to a vaccine efficacy range of 0–50% | ||||||
| 10%–50% | 2.8 | 9.1 (7.6–10.5) | 12 780.6 (10 325.4–15 235.8) | 158 010.2 (128 602.4–187 418.0) | 1.2 (1.0–1.3) | 12.5 (9.2–15.8) |
| 20%–50% | 5.7 | 18.5 (17.2–19.8) | 27 021.9 (24 798.9–29 244.8) | 323 084.6 (296 751.8–349 417.5) | 2.3 (2.1–2.5) | 24.6 (21.7–27.6) |
| 30%–50% | 7.9 | 25.9 (24.7–27.1) | 36 283.1 (34 207.4–38 358.8) | 424 013.4 (399 246.0–448 780.8) | 3.1 (3.0–3.3) | 33.3 (30.4–36.1) |
| 40%–50% | 9.7 | 31.7 (31.5–32.9) | 44 949.8 (42 935.5–46 964.1) | 524 898.3 (500 865.4–548 931.1) | 3.8 (3.7–4.0) | 41.0 (38.3–43.8) |
| 50% | 11 | 35.7 (34.6–36.9) | 50 471.1 (48 476.7–52 465.4) | 583 179.0 (559 333.0–607 025.0) | 4.3 (4.1–4.4) | 46.7 (44.0–49.4) |
| When the target vaccine efficacy is 70%, impact of reducing efficacy variability compared to a vaccine efficacy range of 0–70% | ||||||
| 10%–70% | 2.6 | 8.5 (6.9–10.1) | 11 523.4 (8907.5–14 139.3) | 129 130.6 (99 103.9–159 157.3) | 1.0 (0.8–1.2) | 9.7 (6.5–12.9) |
| 20%–70% | 4.9 | 16.1 (14.6–17.5) | 22 557.3 (20 213.8–24 900.9) | 251 703.1 (224 896.8–278 509.4) | 1.9 (1.7–2.1) | 21.6 (18.8–24.4) |
| 30%–70% | 7.2 | 23.5 (22.2–24.9) | 32 729.7 (30 531.2–34 928.2) | 366 922.3 (341 590.6–392 254.0) | 2.8 (2.6–3.0) | 30.4 (27.8–33.0) |
| 40%–70% | 8.3 | 27.0 (25.7–28.3) | 38 591.1 (36 460.3–40 721.8) | 431 202.6 (406 729.8–455 685.4) | 3.2 (3.0–3.3) | 36.4 (33.8–38.9) |
| 50%–70% | 9.3 | 30.2 (28.9–31.6) | 42 701.0 (40 593.0–44 809.0) | 476 935.1 (452 726.3–501 143.8) | 3.6 (3.4–3.7) | 40.2 (37.7–42.7) |
| 60%–70% | 9.9 | 32.2 (30.9–33.5) | 45 564.5 (43 465.7–47 663.2) | 509 289.2 (485 194.0–533 384.3) | 3.8 (3.6–3.9) | 43.4 (41.0–45.9) |
| 70% | 10.3 | 33.6 (32.3–34.9) | 47 408.7 (45 313.2–49 504.2) | 533 023.5 (508 973.5–557 073.5) | 4.0 (3.8–4.1) | 44.8 (42.4–47.3) |
Data are presented as mean (95% confidence interval) unless otherwise indicated.
Abbreviations: QALY, quality-adjusted life-years; US$, United States dollars.
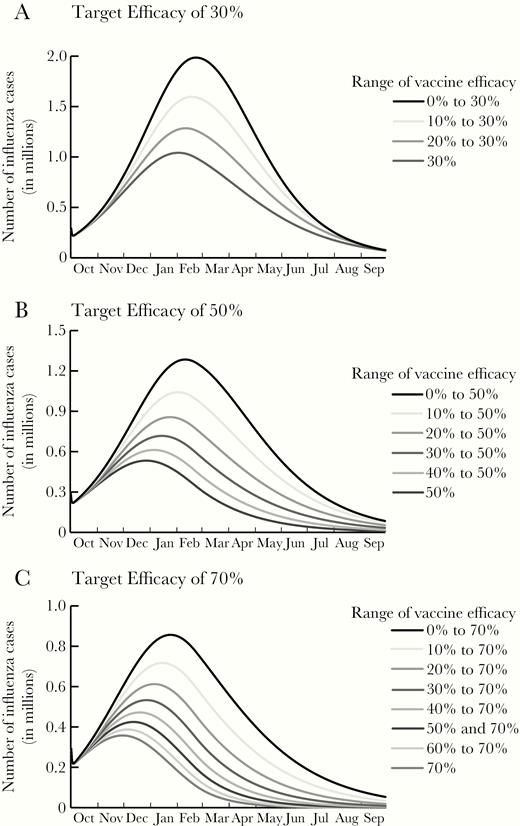
Epidemic curves for a single influenza season with a reproductive rate (R0) of 1.2 for various ranges in influenza vaccine efficacy with a maximal target efficacy of 30% (A), 50% (B), and 70% (C). Note difference in scales across panels.
Impact of Reducing Efficacy Variability When the Target Vaccine Efficacy Is 50%
Reducing efficacy variability for a 50% target efficacy vaccine resulted in 5.2–38.6 million fewer influenza cases, depending on R0 and efficacy variability range (Table 1 and Supplementary Tables 2 and 3). The attack rate decreased by a relative 1.9% to 64.2%, depending on R0 and vaccine efficacy. These decreases saved $9.08 billion (95% CI, –$3.1 to $21.1 billion) to $51.0 billion (95% CI, $48.2–$53.8 billion) in total costs, varying with R0 and vaccine efficacy. As Figure 1B shows, with an R0 of 1.2, reducing the variability not only reduced the magnitude of the peak, but also shifted the curve to earlier in the season (eg, January [week 1] for efficacy range of 40%–50% compared to February [week 7] for a range of 0–50%). However, for higher R0 values, there was minimal impact on timing (Supplementary Figures 1 and 2).
Impact of Reducing Efficacy Variability When the Target Vaccine Efficacy Is 70%
When the target vaccine efficacy is 70%, reducing variability saved up to $48.8 billion (95% CI, $46.2–$51.3 billion) in total costs (ie, direct medical costs plus productivity losses) with an R0 of 1.2 (Table 1); $71.2 billion (95% CI, $64.7–$77.7 billion) with an R0 of 1.6 (Supplementary Table 1); and $53.9 billion (95% CI, $43.9–$63.9 billion) with an R0 of 2.0 (Supplementary Table 3). Figure 1C and Supplementary Figures 1C and 2C show how reducing variability in vaccine efficacy shifts the peak of the epidemic curve with different seasonal transmission dynamics. The additional gain in the number of influenza cases averted lessens as the variability is further narrowed to the target of 70% with an R0 of 1.2 (Table 1), given the distribution of cases throughout the season (Figure 1C).
Impact of Reducing Efficacy Variability When the Target Vaccine Efficacy Is 90%
When efficacy ranged from 0 to 90%, there were 20.1 million (attack rate of 6.2%), 144 million (attack rate of 44.2%), and 215.4 million (attack rate of 66.1%) influenza cases with an R0 of 1.2, 1.6, and 2.0, respectively. Reducing variability decreased the attack rate by a relative 3.3% to 71.0% (depending on R0 and efficacy). Similar to other target efficacies ≥30%, the curve shifted earlier in the season with an R0 of 1.2, from January (week 1) when efficacy ranged from 0 to 90% to November (week 45) when everyone had the target efficacy of 90%. With an R0 of 2.0, the curve shifted 1 week later into the season. With an R0 of 1.2, reducing variability averted 6.8 million (95% CI, 5.2–8.4 million) to 27.3 million (95% CI, 26–28.5 million) cases; 9485 (95% CI, 7059–16 404) to 38 229 (95% CI, 36 296–40 162) deaths; 111 157 (95% CI, 83 280–139 035) to 436 162 (95% CI, 414 045–458 279) QALYs lost; $0.8 billion (95% CI, $0.6–$1 billion) to $3.2 billion (95% CI, $3.1–$3.4 billion) in direct medical costs; and $8.7 billion (95% CI, $5.9–$11.5 billion) to $35.3 billion (95% CI, $33.0–$37.5 billion) in productivity losses (efficacy range, 10%–90% to all 90%). With an R0 of 1.6, reducing variability averted 8.5 million (95% CI, 6.1–10.9 million) to 70.2 million (95% CI, 68.5–72 million) cases; 13 695 (95% CI, 8608–18 782) to 102 093 (95% CI, 98 040–106 146) deaths; 0.2 million (95% CI, 0.1–0.2 million) to 1.2 million (95% CI, 1.11–1.21 million) QALYs lost; $0.8 billion (95% CI, $0.5–$1.1 billion) to $8.1 billion (95% CI, $7.8–$8.4 billion) in direct medical costs, and $2.3 billion (95% CI, –$5.2 to $9.7 billion) to $84.5 billion (95% CI, $78.6–$90.4 billion) in productivity losses, varying with the vaccine efficacy range. With an R0 of 2.0, reducing variability averted up to 53.9 million (95% CI, 52.6–55.2 million) cases, 78 474 (95% CI, 73 124–83 824) deaths, 903 056 (95% CI, 838 885–967 227) QALYs lost, $6.3 billion (95% CI, $6.1–$6.6 billion) in direct medical costs, and $72 billion (95% CI, $62.3–$81.6 billion) in productivity losses.
DISCUSSION
Our study quantifies the potential benefits and cost savings of reducing the variability in efficacy of the influenza vaccine. Reducing variability in efficacy not only reduces the disease burden (ie, reduces the number of infections at the peak of the season) but also reduces adverse clinical outcomes (eg, deaths), and results in cost savings. The more variability is reduced, the greater the reduction in cases and deaths, resulting in more cost savings. However, even a slight reduction in variability (eg, reducing the range of efficacy from 0–90% to 10%–90%) can avert more than 5.0 million cases, $609.8 million in direct medical costs, and $10.7 billion in productivity losses annually. These saving thresholds represent the amount that can be spent on development and vaccination-related costs (eg, vaccine costs, vaccination administration and logistics) above the current vaccine formulations and remain cost-neutral. To put this in perspective, introducing a sugar-sweetened beverage excise tax policy is estimated to save $2.7 billion in healthcare costs annually [20], while implementing a lifestyle intervention for patients diagnosed with prediabetes is estimated to save $64.4 billion in medical costs and $118.4 billion in nonmedical costs a year [21], and treating individuals with hypertension is estimated to save $128.0–$395.3 million in healthcare costs annually [22] (all in 2019 US dollars).
One way to reduce or eliminate the variability in vaccine efficacy is by finding ways to tailor that vaccine to different individual factors that may impact their immune response. For example, researchers are exploring how genetics may play a role in the immune response to a vaccine [3–5] and are working to better determine the relationship between genetic and vaccine immune response. If relationships are elucidated, genetic testing could be utilized to determine which vaccine an individual should get. Other ways to reduce variability include varying dosage based on age, body habitus, or immune response. Another option is use of an adjuvant, which is a substance added to vaccines to boost immune response to the antigen [23]. Currently, adjuvants for influenza vaccines are used for young children and older adults (≥ 65 years). Thus, by first understanding differences in vaccine-induced immune responses, tailored vaccines could overcome these differences and improve response and subsequent protection. Tailored vaccines could also have additional benefits, such as increased compliance and coverage and reduced side effects. For example, a tailored influenza vaccine with greater efficacy could potentially capture a greater proportion of the population that feels the current vaccine is not efficacious enough [24]. However, tailored vaccines may have logistical challenges and costs that would need to be considered. For example, the cost of genetic testing (if required) or screening based on a personal characteristic (eg, weight) may add an extra step for healthcare professionals. Additionally, reducing the variability in vaccine efficacy for smaller groups of people (eg, immunosuppressed) may not be as impactful as reducing it for a larger group. Nevertheless, our results show that even a slight reduction in variability can substantially reduce the number of cases and save costs.
Predicting the resulting ethical and social implications of vaccine tailoring is an important aspect of any potential use in practice or policy [25]. These implications can be grouped into 3 broad contexts (1) research, (2) clinical use, and (3) public health and public policy—all of which deserve deeper analysis. As examples of the kinds of issues to be examined, clinical trials for new vaccines tailored based on personal information (eg, genetics) could face challenges in recruitment and participation if enrollment required participants to forego existing vaccines. This in turn could both affect the power of trials and introduce biases [26, 27]. In clinical use, ethical issues may arise in assessing risk-benefit balancing for individuals weighed against the goals of public health, as well as the cost of tailored vs standard vaccines and who should bear costs. And in considerations of public health policy, given the growing societal hesitation around vaccines, introducing a new version of an existing vaccine based on population characteristics or genetics could further undermine public trust through messaging that response to vaccination is variable among individuals, feeding arguments about vaccine hesitancy [28]. Conversely, tailoring vaccines could enhance societal trust through “precision” or personalized approaches to vaccination, and the more favorable risk-benefit assessments they can offer [29].
By quantifying the potential impact of reduced variability in vaccine response and protection, our study can inform a number of decision makers. Stakeholders in vaccine research and development can use our results to better understand potential health and economic gain from reducing variability, which can guide investments and funding. Vaccine developers and manufacturers can use our findings to understand the impact of reducing variability in efficacy and help determine the level of reduction needed to make vaccine development worthwhile. Clinical providers, health systems, and third-party payers can quantify the potential reduction in health burden and resources use (eg, fewer influenza-related healthcare visits and hospitalizations). Additionally, results such as these can inform policy makers on decisions about vaccine tailoring and new recommendation guidelines when such vaccines reach the market. However, one of the challenges is that there is currently a disconnect between who is bearing the cost of vaccine preventable diseases and who is deciding how much to invest in the development of new vaccines or vaccine technologies. Perhaps quantifying these costs will motivate decision makers to find ways to better connect the need with the capital and vaccine development efforts.
We aimed to be conservative about the benefits of vaccination; as such, we focused on the risk of infection. Vaccines can provide additional benefits that we did not explore—for example, vaccines can also impact clinical outcomes and may reduce the severity of infection. This would increase the value of vaccines eliciting a higher efficacy. Additionally, some have recently proposed incorporating a person’s risk preference for health outcomes along with utility weights in QALY estimates [30]. Including this adjustment for risk preference to the QALY estimates would further increase the value of reducing the variability in influenza vaccine efficacy.
There are limitations to this study. While models serve as an effective tool for understanding complex problems, they cannot account for every possible event or outcome that could occur in real life. Our data inputs are derived from sources of varying rigor and quality; thus, our results may change as better data become available. The course of an actual influenza season may not conform to our model data and assumptions. For example, we assumed individuals mixed equally with each other and that influenza cases were evenly distributed across all age groups; however, in reality the burden may be higher in 1 or more age groups. Additionally, we assumed even vaccination of individuals over the season, when in reality, the timing of vaccination may vary and affect the spread of influenza.
In summary, our study quantifies the potential impact of efforts to reduce variability in the protection that influenza vaccines offer, averting > 6.5 million cases and generating cost savings > $10.7 billion each year. This can help policy makers, funders, and vaccine developers and manufacturers determine the potential benefits of developing vaccines that are more personalized to different individual factors.
Supplementary Data
Supplementary materials are available at The Journal of Infectious Diseases online. Consisting of data provided by the authors to benefit the reader, the posted materials are not copyedited and are the sole responsibility of the authors, so questions or comments should be addressed to the corresponding author.
Notes
Disclaimer. Statements in the manuscript do not necessarily represent the official views of, or imply endorsement by, the Agency for Healthcare Research and Quality (AHRQ) or the US Department of Health and Human Services. The funders did not in any way restrict our ability or right to publish any analyses, results, or interpretation of results that emerged from this study.
Financial support. This work was supported by a seed grant from the Johns Hopkins Center for Bridging Infectious Diseases, Genomics and Society (BRIDGES), a National Human Genome Research Institute–funded Center for Excellence in Ethical, Legal, and Social Implications Research (grant number RM1HG009038); the AHRQ (grant number R01HS023317); the National Institute of General Medical Sciences via MIDAS (grant number U24GM110707); and the Eunice Kennedy Shriver National Institute of Child Health and Human Development Office of Behavioral and Social Sciences Research via the Global Obesity Prevention Center (grant number U54HD070725).
Potential conflicts of interest. The authors: No reported conflicts of interest. All authors have submitted the ICMJE Form for Disclosure of Potential Conflicts of Interest.

