


Abstract
Human papillomavirus (HPV) infection, and its sequelae of precancerous cervical lesions and their subsequent treatment, have been linked with an increased risk of adverse pregnancy outcomes. Publicly funded HPV vaccination of female adolescents began in Australia in 2007 with initial catch-up to age 26 years.
Using data from the National Perinatal Data Collection we compared rates of preterm births and small-for-gestational-age infants born in Australia 2000–2015. We used generalized linear models, assuming a Poisson distribution and log link function, with single-year categories of infant birth year, maternal age, and age-specific HPV vaccination coverage as independent variables.
In maternal cohorts with 60%–80% HPV vaccination coverage as achieved in Australia, there was a relative rate reduction of 3.2% (95% confidence interval, 1.1%–5.3%) in preterm births and 9.8% (8.2% to 11.4%) in small-for-gestational-age infants, after adjustment for infant’s birth year and maternal age.
This analysis provides provisional population-level evidence of a reduction in adverse pregnancy outcomes in cohorts of women offered HPV vaccination. Confounding by smoking or other variables and/or ecological analysis limitations, however, cannot be excluded. These findings indicate potential broader benefits of HPV vaccination than have been documented to date.
Australia’s National HPV Vaccination Program (NHVP) began in 2007, providing free 3-dose quadrivalent (human papillomavirus [HPV] 16/18/6/11) school-based vaccination for girls aged 12–13 years. Free catch-up vaccination was offered to girls and women aged 14–26 years until the end of 2009, delivered through school-based and community-based programs. Nationwide rollout of the NHVP for female adolescents aged 12–18 years at school occurred over 2007–2008 with minor variations by state [1]. HPV vaccination of boys aged 12–13 years began in 2013 with catch-up for boys aged 14–15 years in 2013–2014.
In 2018, the program switched to offering a 2-dose schedule of nonavalent vaccine (which also protects against HPV 31/33/45/52/58). Three-dose quadrivalent vaccination coverage rates reported by the National HPV Vaccination Program Register (NHVPR) have been high: 73%–74% coverage in girls aged 12–15 years in 2007 [2], reaching 80% in eligible girls [3] and 76% in eligible boys [4] in 2017. Reported coverage rates for the catch-up program are lower; 55% and 32% of women aged 18–26 years in 2007, received at least one, and three, doses respectively [5]. The early introduction of a free national program, with wide catch-up and good coverage rates, in combination with the high-quality health data collections, places Australia in a leading position to study the effects of vaccination on HPV-related diseases.
High-risk HPV infections have been linked with an increased risk of adverse pregnancy outcomes (APOs) through indirect, and possibly direct, pathways. Meta-analyses have found that women with a history of treatment for precancerous cervical lesions, (a sequela of HPV infection), have an increased risk of APOs, including preterm birth (PTB) (relative risk, 1.75; 95% confidence interval [CI], 1.57–1.96) and low-birth-weight (LBW) infants (1.81; 1.58–2.07); a higher risk of PTB was associated with treatment by excision (rather than ablation), increasing depth of excision and multiple treatments [6]. It is proposed that loss of cervical tissue secondary to treatment may lead to mechanical weakness affecting cervical competence, resulting in an increased risk of PTB (indirect pathway) [7].
Although HPV has been found in placental tissue [8–10], umbilical cord blood [10], amniotic fluid [11], and fetal membranes [12], studies of any direct association of HPV infection with PTB [8, 13–16] and intrauterine growth retardation (resulting in a small-for-gestational-age [SGA] infant) [15, 17] are conflicting, with many showing no direct impact of HPV on APO [8, 14–16]. Possible pathways include cervical and/or intrauterine inflammation or infection, or triggering of an exaggerated immune response to bacterial coinfections [17–19].
HPV vaccination has reduced rates of HPV infection [20, 21], anogenital warts [22], and high-grade cervical precancerous lesions [23, 24] in Australia. Based on the mechanisms discussed above, it has been suggested that HPV vaccination could potentially decrease APOs by reducing treatment rates for high-grade cervical lesions (indirect mechanism) and/or by reducing HPV infection prevalence (putative direct mechanism) [13, 25, 26].
Infants born preterm or SGA have a considerably higher morbidity and mortality in the neonatal period and beyond [27–29]. Complications from PTB were the commonest cause of death in neonates and children <5 years old in 2017 globally [27]. The aim of this study, therefore, was to assess the rates of PTBs and SGA infants in Australia, before, during, and after the introduction of the NHVP, to determine if there is an association of these APOs with HPV vaccination coverage rates of the maternal cohort.
METHODS
Data
We obtained deidentified aggregated data for singleton births in Australia from 2000–2015 from the Australian Institute of Health and Welfare National Perinatal Data Collection, a comprehensive national population-based collection of pregnancy and childbirth data based on perinatal data routinely collected by each state and territory. Since 1997, mandatory minimum data have been collected for all births in Australia, including demographic, lifestyle and medical details of the mother, and factors relating to the pregnancy, labor, delivery and infant [30]. Births are recorded if either gestational age (GA) was at least 20 weeks or birth weight (BW) was at least 400 g, except in Western Australia and Victoria, where births are included if GA was at least 20 weeks, or if GA was unknown, BW was at least 400 g [31].
Data were obtained for the outcomes of PTB, SGA infants, and LBW infants for singleton live births in Australia from 2000 to 2015 by year of birth of the infant and maternal age. PTBs included births with a GA <37 weeks completed gestation. Infants were considered SGA if their BW was below the 10th percentile for GA and sex according to the most recent national BW percentiles. These national BW percentiles were calculated from data on all live-born singleton infants with known BW, GA, and sex in Australia between 2004 and 2013 with a GA of 20–44 weeks [32] and were applied to all included births. LBW was defined as a BW <2500 g. Total live birth numbers include those with GA and BW not reported. Our primary analyses were restricted to PTBs and SGA, because LBW infants encompass preterm and/or SGA infants, and to live-born infants, because stillbirths may be associated with different risk (see Supplementary Material for secondary analyses).
Data provided were aggregated at the extremes of maternal age to prevent identification due to small numbers (live births: maternal ages of 16 years and younger, or 40 years and over). At all other ages, data were provided by single year of maternal age. Similarly, to maintain deidentification, data could not be stratified further by possible confounders, including maternal demographic, lifestyle, obstetric, and medical factors.
Maternal exposure to HPV vaccination (ie, percentage of girls and women vaccinated, with groups defined by maternal age and calendar year) was based on published coverage estimates from the NHVPR [33] (Supplementary Table 1). Vaccination doses delivered in the community-based catch-up program are known to be underrecorded, because there were barriers to reporting to the NHVPR [34]. To overcome this underreporting, we adjusted 3-dose vaccination coverage rates for women aged 18–26 years in 2007 using data from a national survey that compared doses recorded on the NHVPR with those confirmed by women’s clinical providers [34].
We refer to “maternal cohorts” as groups of mothers defined by the mother’s estimated year of birth (determined by maternal age at time of delivery) and the calendar year of the infant’s birth. Vaccine eligibility was based on the maternal cohort’s estimated age on 1 July 2007. Vaccination coverage of the maternal cohort therefore refers to the vaccination coverage of women with the same birth year, in the infant’s calendar birth year (Supplementary Table 2).
Statistical Analysis
We examined incidence trends in PTBs, SGA infants, and LBW infants in Australia from 2000 to 2015, by maternal age and infant’s year of birth, to compare cohorts who were offered HPV vaccination to unvaccinated cohorts. Generalized linear models, assuming a Poisson distribution and log link function, were used to compare rates of PTBs, SGA infants, and LBW infants. Independent variables in each model were single-year categories of maternal age and year of birth of infant, and either 6 categories of vaccination coverage (0, >0% to <20%, 20% to <40%, 40% to <60%, 60% to <80%, and 80% to <100%) or vaccination coverage entered as a continuous covariate (per 20% increase in coverage). The dependent variable in each model was the number of PTBs, SGA infants, or LBW infants for each combination of categories of maternal age and infant’s birth year, with the corresponding total number of births included as the exposure variable.
The regression models were also used to predict rates of APOs, according to observed levels of vaccination coverage and also if vaccination coverage was 0%. The predicted rates were then used to calculate maternal age-standardized rates. Robust standard errors were used to account for possible overdispersion or underdispersion. The measure of effect from the generalized linear models was the incidence rate ratio (IRR).
Primary analyses examined the outcomes of PTB and SGA in live-born infants in mothers aged 17 years and over. Secondary analyses considered live-born LBW infants in mothers aged 17 years and over, and PTBs and LBW infants for all births (live plus stillbirths) in mothers aged 19 years and over (see Supplementary Material).
To investigate its potential role as a confounder in APOs (because of a known relationship between maternal tobacco smoking behavior and APOs [35], a contemporaneous decline in smoking prevalence in pregnant women [35], and a potential correlation between vaccination uptake in catch-up cohorts and smoking status), we performed exploratory sensitivity analyses, which included maternal smoking over time in the model, based on Australian Institute of Health and Welfare published data (the proportion of mothers who smoked at any time during their pregnancy, by 5-year maternal age categories, in 2005–2015; data not available before 2005) (Supplementary Table 3) [36]. IRRs were also adjusted for rates of smoking anytime in pregnancy (smoothed over years 2005–2015). These adjusted IRRs (aIRRs) were compared with results for 2005–2015 unadjusted for smoking; a >20% change in the vaccination β coefficient was considered indicative of possible confounding.
The total numbers of births included births with missing GA and/or BW; these births were included with term/postterm and normal/high BW birth in the main analyses. Sensitivity analyses were performed for the outcomes of PTB and LBW infants excluding missing data (see Supplementary Material). Sensitivity analyses were also performed using coverage with at least one dose. Statistical analyses were performed using Stata 13.1 software (StataCorp). Ethics approval was not required because only aggregated data were used and reidentification is not possible.
RESULTS
There were 4 425 032 singleton births reported in Australia over 2000–2015, of which 4 395 116 (99.3 %) were live births (Table 1). Among these live births were 268 246 (6.1%) PTBs, 437 412 (10.0%) SGA infants, and 211 322 (4.8%) LBW infants. The vast majority of PTBs and LBW infants were live births (91.8% and 90.1% respectively). GA and BW were not stated in 945 (0.02%), and 1417 (0.03%) live births respectively. The median maternal ages were 32 and 24 years in unvaccinated and vaccinated cohorts, respectively. The median (mean) coverage in the vaccinated cohorts was 42% (49%).
Characteristics of Singleton Live Births and All Births (Live and Stillbirths) in Australia from 2000 to 2015
| Live Births no. (%) | All Births no. (%) | |
|---|---|---|
| Preterm births (<37wk) | 268 246 (6.1) | 292 352 (6.6) |
| Low-birth-weight infants (<2500g) | 211 322 (4.8) | 234 462 (5.3) |
| Small-for-gestational-age infantsa | 437 412 (10.0) |
| Live Births no. (%) | All Births no. (%) | |
|---|---|---|
| Preterm births (<37wk) | 268 246 (6.1) | 292 352 (6.6) |
| Low-birth-weight infants (<2500g) | 211 322 (4.8) | 234 462 (5.3) |
| Small-for-gestational-age infantsa | 437 412 (10.0) |
aBelow the 10th percentile for gestational age and sex according to national birth weight percentiles, calculated from data on all live-born singleton infants born in Australia between 2004 and 2013 with a gestational age of 20–44 weeks (32).
The proportion of live PTBs between 2000 and 2015 trended slightly upward for maternal ages 17 to 40 years and over (particularly at the extremes of maternal age) (Supplementary Figure 1). By comparison, the proportion of SGA infants trended downward, especially in younger mothers (Supplementary Figure 2). No obvious trends were seen in the proportion of LBW infants (Supplementary Figure 3).
The aIRRs for PTBs, adjusted for maternal age and 3-dose vaccination coverage category, rose steadily over the study period, with a 13.5% (95% CI, 11.0%–16.0%) increase from 2000 to 2015 (Figure 1A). The aIRRs for SGA infants trended downward 2000–2007, followed by relatively level rates through 2015, with an overall 8.2% (95% CI, 6.1%–10.3%) reduction over the 15-year study period (Figure 1B). There was an overall 8.2% (95% CI, 5.0%–11.6%) increase in aIRRs for LBW infants over that period (Supplementary Figure 4).
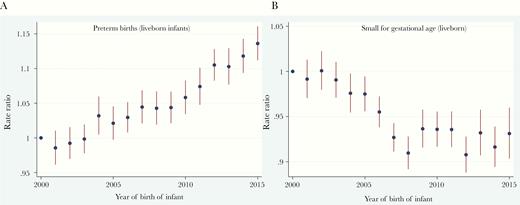
Adjusted incidence rate ratios (aIRRs) with 95% confidence intervals for preterm births (A) and small-for-gestational-age (SGA) infants (B) among live singleton births in Australia, 2000–2015, with adjustment for maternal age and 3-dose human papillomavirus vaccination coverage.
The aIRRs for PTBs and births of LBW infants, adjusted for year of infant birth and vaccination coverage category, were higher at the extremes of age, with the youngest mothers having the highest incidence (Figures 2A and Supplementary Figure 5). The aIRR for SGA infants was highest for mothers aged 17 years, decreasing with increasing maternal age until the mid-30s, with a small increase in older mothers (Figure 2B).
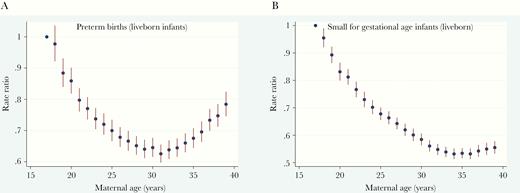
Adjusted incidence rate ratios (aIRRs) with 95% confidence intervals for preterm births (A) and small-for-gestational-age (SGA) infants (B) among live singleton births, for increasing maternal age, with adjustment for year of birth of infant and 3-dose human papillomavirus vaccination coverage in Australia, 2000–2015.
Maternal age was significantly associated with all outcomes for live births (PTB, SGA infants, LBW infants) (P < .001) after adjustment for infant’s birth year and 3-dose vaccination coverage category. Similarly, the infant’s birth year was significantly associated with all outcomes for live births in 2000–2015 (P < .001), after adjustment for maternal age and 3-dose vaccination coverage.
When vaccination coverage was treated as a continuous covariate, each 20% increase in 3-dose vaccination coverage in the maternal cohort was associated with a 1.0% decrease in incidence rates of PTBs (aIRR, 0.990; 95% CI, .985–.996; Ptrend = .001), a 1.8% decrease in incidence rates of SGA infants (0.982; .977–.988; Ptrend < .001), and a 1.1% decrease in incidence rates of LBW infants (0.989; .983–.996; Ptrend = .002) in live births among mothers aged 17 years and over, after adjustment for maternal age and year of infant’s birth (Table 2). Treating vaccination coverage categorically, cohorts with 60%–80% HPV vaccination coverage (no cohorts had 3-dose vaccination coverage >80%) were found to have a 3.2% reduction in incidence rates of PTBs (aIRR 0.968; 95% CI, .947–.989), a 9.8% reduction in SGA infant rates (0.902; .886–.918) and a 4.8% reduction in LBW infant rates (0.952; .928–.977) compared to unvaccinated cohorts.
Adjusted Incidence Rate Ratio for Singleton Preterm Births, Small-for-Gestational-Age Infants, and Low–Birth-Weight Infants in Women Aged ≥17 years in Australia, by Human Papillomavirus Vaccine Coverage of the Maternal Cohort (for Live Births in 2000–2015)
| 3-Dose HPV Vaccine Coveragea | aIRRb (95% CI) | ||
|---|---|---|---|
| Preterm Birthsc | SGA Infantsd | LBW Infantse | |
| Categorical | |||
| 0% | 1 (Reference) | 1 (Reference) | 1 (Reference) |
| >0% to <20% | 1.013 (.986−1.041) | 1.035 (1.014−1.056) | 1.040 (1.016−1.064) |
| 20% to <40% | 0.984 (.970−.998) | 1.029 (1.015−1.044) | 1.006 (.990−1.023) |
| 40% to <60% | 0.975 (.960−.990) | 0.966 (.949−.984) | 0.969 (.949−.990) |
| 60% to <80% | 0.968 (.947−.989) | 0.902 (.886−.918) | 0.952 (.928−.977) |
| P value | .004 | <.001 | <.001 |
| Continuous: per 20% increase in coverage | 0.990 (.985−.996) | 0.982 (.977–.988) | 0.989 (.983–.996) |
| Ptrend | .001 | <.001 | .002 |
Abbreviations: aIRR, adjusted incidence rate ratio; CI, confidence interval; HPV, human papillomavirus; LBW, low-birth-weight; SGA, small-for-gestational-age.
aVaccine coverage of maternal cohort in the calendar year of the infant’s birth. No cohorts had 3-dose HPV vaccination rates of 80%-100%.
bAdjusted for maternal age and year of birth of infant.
cDefined as gestational age (GA) <37 weeks.
dBelow the 10th percentile for GA and sex, according to national birth weight percentiles, calculated from data on all live-born singleton infants born in Australia between 2004 and 2013 with a GA of 20–44 weeks (32).
eDefined as birth weight <2500 g.
Empirical directly age-standardized rates of APOs (which incorporate varying vaccination coverage levels over time), and regression model–predicted age-standardized rates (using either observed vaccination coverage and vaccination coverage of 0% as model inputs) are plotted by year of infant’s birth (Figure 3 and Supplementary Figure 6), with rates standardized to the Australian maternal age distribution of mothers who gave birth in 2000. HPV vaccination at the coverage levels recorded in Australia was estimated to have prevented 1.25 PTBs, 3.65 SGA infants, and 1.15 LBW infants per 1000 live births in mothers aged 17 years and over in 2015 (Supplementary Table 4). The regression model estimated that 371 PTBs, 1082 births of SGA infants, and 340 births of LBW infants were prevented in 2015; since the introduction of the NHVP (2007–2015), HPV vaccination potentially prevented 1964 PTBs, and births of 6005 SGA infants and 1816 LBW infants (Supplementary Table 5). Results for all births were similar to those for live births (Supplementary Material).

Maternal age standardized rate (ASR) (standardized to the age distribution of mothers who gave birth in Australia in 2000) for preterm births (PTBs) (A) and for small-for-gestational-age (SGA) infants (B) for observed levels of 3-dose human papillomavirus (HPV) vaccination coverage versus predicted rate if 3-dose HPV vaccination coverage was 0%, per 1000 live singleton births in mothers aged ≥17 years in Australia, from 2000 to 2015.
The exclusion of the very small numbers of births with missing outcome data had no impact on the sensitivity analyses (PTBs and LBW infants). There was a slight reduction in the size of effect for every 20% increase in coverage, but the effect remained statistically significant for vaccination coverage of at least one dose.
Including smoothed smoking rates for the years 2005–2015 in the models resulted in only a small change in the β coefficient and had minimal impact on the effect estimate for PTB rates (Supplementary Table 6). However, changes in the β coefficients for SGA and LBW indicated potential confounding by maternal smoking, and inclusion of this variable had a substantial impact on the effect estimate for these APOs.
DISCUSSION
We found that for every 20% increase in vaccination coverage of the maternal cohort, there was a reduction of approximately 2% in incidence rates of SGA infants, and 1% in rates of PTBs and LBW infants, after adjustment for infant’s birth year and maternal age. Maternal cohorts with the 60%–80% 3-dose HPV vaccination coverage achieved in Australia are associated with estimated 10%, 3%, and 5% reductions in rates of SGA infants, PTBs, and LBW infants, respectively. This could potentially equate to the prevention of more than 6000 SGA infants, approximately 2000 PTBs, and approximately 1800 LBW infants in live singleton births in mothers aged 17 years and over in Australia over 2007–2015 (with overlap between APOs).
Previous studies examining the safety of HPV vaccination have demonstrated that inadvertent vaccination in the periconceptional period and in pregnancy is not associated with an increase in APOs, including spontaneous abortion, stillbirth, SGA infants, PTBs, and birth defects [37, 38]. However studies of the potential reduction of adverse outcomes in future pregnancies by HPV vaccination are limited. A recent data linkage study found high-grade cervical disease (of which the majority of cases would undergo excisional treatment) was associated with PTBs, but there were no association of PTBs with HPV infection or low-grade cervical disease [16]. No effect was seen from prior HPV vaccination, but the vaccine-eligible cohort was small [16].
In the current study, HPV vaccination seems to be associated with a larger protective effect for SGA infants than for PTBs or LBW infants, but the SGA and LBW results may have been confounded by smoking (as suggested by our exploratory analysis). Notwithstanding the exploratory nature of these analyses including smoking, a protective effect for PTBs but not for SGA infants may indicate that HPV vaccination affects APO indirectly, by reducing rates of treatment for precancerous lesions, rather than by preventing any direct adverse effects of HPV infection itself on the pregnancy, consistent with previous evidence [16].
The reduction in PTBs associated with HPV vaccination occurs against a backdrop of increasing rates of PTBs in many countries where data are available, including Europe, the Americas, and Australia [29, 39], and is confirmed in our study. Suggested causes of this increase include changes in measurement [29], increasing maternal age (adjusted for in our analyses), and increasing rates of multiple births (excluded in our study), assisted reproduction, provider-initiated PTBs, obesity, and maternal medical conditions, including diabetes and hypertension [39]. In Australia, HPV vaccination may have limited the increase in PTBs (Figure 3).
The limitations of the ecological design of our study, the potential role of unmeasured confounders, and/or changes in guidelines and practices may have affected the rates of APOs over the study period, and may be responsible, partly or fully, for our findings. Increasing evidence that low-grade cytological abnormalities represent acute HPV infection [40], and increasing evidence of the higher risk of PTBs in future pregnancies after excisional treatment [41], led to changes in the recommendations for the management of low-grade abnormalities in 2006 to allow for clearance of HPV infection (including less intensive follow-up of low-grade cytology and no active treatment for biopsy-proved low-grade lesions [42]). This resulted in fewer low-grade abnormalities being detected [43, 44] and potentially fewer treatments for low-grade abnormalities. Rates of excisional treatments in women <35 years old fell in Australia from 2004 to 2013, as did rates of excisional treatments per high-grade diagnosis across all age groups [44]. Excision depth during the study period may also have been affected by emerging evidence, since confirmed, of the increasing risk of APOs with increasing depth of excision [6, 45].
Since 2008, Australian guidelines have recommended surveillance of cervical length in women at higher risk of spontaneous PTB, including women with a history of repeated or deep cervical excisions. Intervention with vaginal progesterone or cervical cerclage is recommended for women identified as being at higher risk of PTB [46]. The rates of cervical cerclage procedures have significantly increased in Australia from 2004 to 2013 [47], and this increase in cervical cerclage may account, partly or fully, for the prevented PTBs that we attributed to HPV vaccination. However, the rate of cervical cerclage is 14 times higher in women with a history of treatment for precancerous cervical lesions [6]; it could therefore be expected that HPV vaccination, by reducing the rates of high-grade abnormalities and hence treatment, may reduce the rates of women requiring interventions to prevent PTB (an additional benefit, because these interventions have their own risks, particularly cerclage).
A limitation of our study is the difference in median maternal age between the unvaccinated and vaccinated cohorts (32 vs 24 years) (as vaccination has been offered only since 2007). However, because maternal age is associated with these APOs, we adjusted our analyses by single year of maternal age. We also adjusted for infant’s birth year to take into account changes in the APOs over the study period. A major limitation of our study was that we were unable to adjust for other known risk factors for APOs in Australia, such as maternal smoking status, body mass index, indigenous status, and area-level remoteness and disadvantage. In an exploratory analysis for tobacco smoking as a potential confounder using the limited publicly available data, we found that smoking status substantially changed the effect estimate for births of SGA and LBW infants, but that vaccination coverage continued to show an effect on PTBs after adjustment for maternal smoking rates. Unit level data are required to explore the effect of smoking and other possible confounders on the impact of the vaccine on APOs.
Women vaccinated in the catch-up age groups may have been sexually active and thereby infected with high-risk HPV types before vaccination; they could therefore be expected to remain at increased risk of APOs resulting from these previous infections [48]. Consequently, our coverage rates may have overestimated “effective” vaccination coverage rates. Alternatively, there is increasing evidence of at least some protection with 1 dose of HPV vaccination [49], and therefore the 3-dose analyses may have underestimated the effective vaccination coverage rates. We performed sensitivity analyses for coverage with at least one dose; these showed smaller effect sizes, but results remained statistically significant.
Major strengths of the current study include the availability of high-quality national HPV vaccination coverage and perinatal data, with the former available since the inception of the program and the latter since 1991, allowing us to examine the periods before, during, and after the implementation of the NHVP. Australia was an early adopter of routine HPV vaccination, with a catch-up program extending to women aged 26 years, allowing examination of cohorts of pregnant women aged up to their mid-30s who had been offered vaccination. Together with the good vaccination coverage rates, this provided a relatively unique opportunity for an early assessment of the benefits of HPV vaccination.
The estimated numbers of APOs prevented in our study increased steadily from 2007 to 2015. The numbers of APOs averted would be expected to continue to increase as cohorts of adolescents vaccinated when HPV naive progress through their child-bearing years.
PTBs and SGA are associated with higher morbidity and mortality risks in the neonatal period and beyond. The mechanisms involved in APOs are complex and multifactorial [18]. However, owing to the common occurrence of these APOs, even a small reduction in their rates by HPV vaccination, if confirmed, could have major global health and economic implications. Furthermore, with higher vaccine coverage rates being hampered by vaccine hesitancy in some settings [50], protection against APOs may provide a further incentive to vaccinate and potentially increase vaccination coverage.
Our findings support the hypothesis that HPV vaccination has an impact on rates of APO. Although only a small relative reduction, the potential impact globally is substantial. These findings reinforce the need for continued monitoring of APO outcomes in key settings after the introduction of HPV vaccination.
Supplementary Data
Supplementary materials are available at The Journal of Infectious Diseases online. Consisting of data provided by the authors to benefit the reader, the posted materials are not copyedited and are the sole responsibility of the authors, so questions or comments should be addressed to the corresponding author.
Notes
Acknowledgments. We thank Deanna Eldridge at the Maternal and Perinatal Health Unit, Australian Institute of Health and Welfare for assistance with acquisition of the data
Author contributions. Study design: S. Y., S. E., L. V., and K. C. Literature search: S. Y. Data acquisition: S. Y. Data analysis: S. Y. and S. E. Data interpretation: S. Y., S. E., M. S., L. V., and K. C. Figure production: S.Y. and S. E. Drafting and review of the manuscript: S.Y. Review of the manuscript: S. Y., S. E., M. S., L. V., D. B., and K. C. Expert medical advice and review: C. D. W. Guarantor of the article: K. C. All authors have reviewed and agreed to the final submitted version of the manuscript.
Disclaimer. The content is solely the responsibility of the authors and does not necessarily represent the official views of Cancer Council NSW.
Financial support. This work was supported by Cancer Council New South Wales.
Potential conflicts of interest. C. D. W. has received grants and personal fees from Seqirus, outside the submitted work, is the deputy chair of the VCS Foundation board (honorary), and is a Chief Investigator on the Compass trial pilot and an Associate Investigator on the main Compass trial (http://www.compasstrial.org.aul). K. C. is co–principal investigator of an unrelated investigator-initiated trial of cervical screening in Australia (Compass; ACTRN12613001207707 and NCT02328872), which is conducted and funded by the VCS Foundation, a government-funded health promotion charity. She is also an investigator of Compass New Zealand (ACTRN12614000714684), which was conducted and funded by Diagnostic Medlab, now Auckland District Health Board. The VCS Foundation received equipment and a funding contribution from Roche Molecular Systems and Ventana USA, and Diagnostic Medlab received equipment and a funding contribution for Compass from Roche Molecular Systems. Neither K. C. nor her institution on her behalf (Cancer Council NSW) receives direct funding from industry for this trial or any other project. All authors have submitted the ICMJE Form for Disclosure of Potential Conflicts of Interest. Conflicts that the editors consider relevant to the content of the manuscript have been disclosed.

