


Abstract
Human rhinoviruses (HRVs), human enteroviruses (HEVs) and human parechoviruses (HPeVs) have been linked to acute otitis media (AOM). We evaluated this association in a prospective birth cohort setting.
A total of 324 healthy infants were followed up from birth to age 3 years. Nasal swab samples were collected at age 3, 6, 12, 18, 24, and 36 months and screened for HRV and HEV using real-time reverse-transcription quantitative polymerase chain reaction. Stool samples were collected monthly and analyzed for HRV, HEV, and HPeV. AOM episodes diagnosed by physicians were reported by parents in a diary. The association of viruses with AOM was analyzed using generalized estimation equations, and their relative contributions using population-attributable risk percentages.
A clear association was found between AOM episodes and simultaneous detection of HEV (adjusted odds ratio for the detection of virus in stools, 2.04; 95% confidence interval, 1.06–3.91) and HRV (1.54; 1.04–2.30). HPeV showed a similar, yet nonsignificant trend (adjusted odds ratio, 1.44; 95% confidence interval, .81–2.56). HRV and HEV showed higher population-attributable risk percentages (25% and 20%) than HPeV (11%).
HEVs and HRVs may contribute to the development of AOM in a relatively large proportion of cases.
Globally, upper respiratory infections (URIs) continue to be the leading cause of acute morbidity in all age groups [1]. URIs, most of which have a viral cause, are often complicated by acute otitis media (AOM), especially in young children [2, 3]. In studies carried out among children, approximately one-third of all URIs have been complicated by AOM, which usually occurs within the first 7 days after URI onset [2–5]. Thus, owing to their high frequency, viral URIs constitute a significant risk factor for AOM, making it one of the most common diseases in childhood. Furthermore, children encountering AOM early in life have been shown to be at increased risk of concurrent AOM later on [6]. These episodes result in widespread use of antibiotics and in chronic cases may lead to otologic surgery, causing significant financial losses to families and society [7].
AOM has generally been considered a bacterial complication of URI. However, viruses alone or together with bacterial copathogens have also been shown to cause AOM [8–10]. Furthermore, according to current consensus, the mucosal damage caused by virus infection is a prerequisite for bacteria to be able to enter the middle ear [11]. Thus, elimination of these viruses could offer an efficient means of preventing AOM. Of all viruses causing URIs, picornaviruses (family Picornaviridae) have been found to be among the most common, with human rhinoviruses (HRVs; genus Enterovirus) accounting for up to 73% of all respiratory infections recorded during the first year of life [12, 13]. HRVs as well as human enteroviruses (HEVs; genus Enterovirus) and human parechoviruses (HPeVs; genus Parechovirus) are picornaviruses that have been linked to AOM in a number of studies. In Finnish and Australian studies, HRVs and HEVs were the predominant viruses detected in children with AOM and recurrent AOM [9, 14, 15]. HPeVs have been found to play a smaller role in the development of AOM [16–18].
The aforementioned studies have mostly relied on methods based on reverse-transcriptase (RT) polymerase chain reaction (PCR) assays, the high sensitivity of which has led to the questioning of the clinical relevance of the results. These viruses have also been found in children without concurrent respiratory symptoms [19]. Hence, the presence of HRVs, HEVs, or HPeVs in respiratory or stool samples alone does not establish causality of the concurrent illness. In this study we investigated the possible causal relationship by comparing the frequency of HRV, HEV, and HPeV infections during AOM episodes and AOM-free periods in a cohort of children who were followed up from birth to age 3 years. We also calculated the population-attributable risk (PAR) of these picornaviruses to the development of AOM.
METHODS
Children
This study is a secondary analysis of data collected during the prospective international DIABIMMUNE study carried out from September 2008 to October 2013. The birth cohort included in this study comprises 324 healthy infants (169 boys and 155 girls) born between September 2008 and May 2010, who were enrolled in the DIABIMMUNE study at Jorvi Hospital, Espoo, Finland. All newborns, whose families gave written informed consent to the study, were first screened for HLA DR/DQ alleles conferring susceptibility to type 1 diabetes, using cord blood. Those with an eligible HLA genotype were recruited to prospective follow-up; these constituted approximately 5% of all newborn infants [20]. The local ethics committee approved the DIABIMMUNE study protocol.
Recording of Otitis Media Episodes and Background Characteristics
During the study period, children visited the study clinics at age 3, 6, 12, 18, 24, and 36 months, making 1836 visits altogether to the study clinics. At the first visit, the parents were given a diary in which they were advised to record information related to the child’s diet, allergies, environmental exposures (eg, type of daycare, pets, living environment, and parental smoking), infections, use of medications, and vaccinations between the visits. The number of siblings was also documented and updated during the follow-up period. All data from the diaries were transferred to a central database during each visit. The number of otitis media (OM) episodes that the child had encountered since the last clinic visit was recorded in the database at each visit. The date, the codes from the International Statistical Classification of Diseases, Tenth Revision (ICD-10), and the type of OM diagnosis (parental report or diagnosed by a physician) were also recorded.
After data extraction, OM diagnoses were classified as acute or chronic based on the ICD-10 codes recorded. As customary in Finland for cases diagnosed by means of otoscopy and without myringotomy, >99% of the episodes were recorded as H66.9 (unspecified OM). These were assumed to be acute. All OM episodes reported by the parents were counted as separate episodes regardless of the interval between 2 consecutive episodes.
Detection of Viruses
To assess HRV, HEV, and HPeV infections, a study nurse collected nasal swab (NS) samples on each visit to the study clinic, using a pediatric flocked swab (Copan Diagnostics) After sampling, the swab was put into a tube containing UTM-RT medium (Copan Diagnostics). The samples were frozen immediately and stored at -80°C until analyzed. Parents were also asked to collect stool samples from the children at home every month starting at age 1 month. Parents stored the samples at home at -20°C and brought them to the study clinic at scheduled visits. The frozen samples were then stored at -80°C until analyzed.
Altogether, 1387 NS samples were collected at age 3, 6, 12, 18, 24, and 36 months (mean, 4.3 samples per child), and 2861 stool samples were collected monthly until age 1 year (mean, 8.8 samples per child). At least 1 NS sample was obtained and analyzed from 279 children, and at least 1 stool sample from 316 children.
The NS and stool samples were screened for the presence of viral RNA with real-time RT quantitative PCR (qPCR). First, a 10% stool suspension was prepared from each original stool sample using Hanks solution. Next, RNA was extracted from 140 µL of suspension using the modified Qiagen RNeasy96 kit (Qiagen) to obtain a final 60-uL volume of extracted RNA. Similarly, 140 uL of each NS sample was subjected to RNA extraction to obtain a final 60-uL volume of extracted RNA. RT-qPCR detection of HRVs [21], HEVs [22], and HPeVs [23] was performed using the QuantiTect Probe kit (Qiagen), as described in the respective references. All samples were analyzed in triplicate paralleling RT-qPCR runs, and a sample was considered positive if ≥1 of the triplicate runs yielded a positive result. The cycle threshold (CT) values for positivity were 44 for HRV and 42 for HEV and HPeV. Among the virus-positive NS samples, 77.9% and 73.3% of were positive for HRV and HEV in all 3 runs, respectively. Of the virus-positive stool samples, 63.3%, 68.8%, and 69.7% yielded a positive result in all 3 runs for HRV, HEV, and HPeV, respectively.
Only one-fourth of the NS samples were screened for HPeV. These analyses were discontinued owing to the very low number of positive results (0.5%). Therefore, the HPeV findings for NS samples were excluded from statistical analyses. HRV and HEV PCR was repeatedly validated in regular external quality control rounds (Quality Control for Molecular Diagnostics), in which they got the best possible scores.
Statistical Methods
The background characteristics of children with or without AOM were compared by means of Mann-Whitney U test. The association between host and environmental factors and HRV, HEV, and HPeV infections was analyzed using the Fisher exact test. The association between virus detection and AOM episodes was assessed first by means of univariate logistic regression. The covariates used in the final multivariable models were identified using Akaike information criterion in a stepwise algorithm. Generalized linear models with binomial family and logit link-function were used to fit statistical models. Generalized estimation equations with binomial family and logit link-function were used to take into account intraindividual correlation. Adjusted odds ratios (ORs) and their 95% confidence intervals were presented as the measure of the associations analyzed.
Only the AOM episodes diagnosed by a physician were included in the statistical analyses. Differences were considered statistically significant at P < .05. The analyses were performed using R software, version 3.6.1 (2019-07-05; http://r-project.org), with the stats and gee packages. The contributions of HRV, HEV, and HPeV to AOM were quantified with PAR percentages, which were calculated using the following formula: PAR = P*(OR - 1)/[P*(OR - 1) + 1], where P represents the prevalence of infection in the population (here the proportion of children who experienced ≥1 infection by age 1 year).
RESULTS
The total duration of follow-up was 930 child-years, and the mean duration 34.4 months per child (standard deviation, 6.1 months). Altogether, 930 AOM episodes were recorded (median, 2; range, 0–18 per child), showing a peak at age 19–24 months (14 AOM episodes per 100 child-months) (Figure 1). Being firstborn offered protection from AOM, whereas having a pet living mostly indoors was significantly associated with a higher number of AOM episodes. Table 1 shows the associations between different background characteristics and AOM.
Background Characteristics of Children and Their Impact on the Mean Number of Acute Otitis Media Episodes During Follow-up
| Characteristic | Children, No. (%) | AOM Episodes, Mean No. | P Valuea |
|---|---|---|---|
| Sex | |||
| Male | 169 (52.2) | 3.0 | .45 |
| Female | 155 (47.8) | 2.7 | |
| Firstborn child | |||
| Yes | 170 (52.5) | 2.6 | .045 |
| No | 154 (47.5) | 3.2 | |
| No. of siblings | |||
| ≥1 | 200 (61.7) | 3.0 | .12 |
| 0 | 124 (38.2) | 2.6 | |
| Exclusive breastfeeding at age 3 mo | |||
| Yes | 178 (66.9) | 3.1 | .19 |
| No | 88 (33.1) | 2.6 | |
| Duration of breastfeeding ≥6 mo | |||
| Yes | 226 (73.6) | 3.1 | .053 |
| No | 81 (26.4) | 2.6 | |
| Use of pacifier | |||
| Yes | 200 (73.3) | 3.1 | .80 |
| No | 73 (26.7) | 2.9 | |
| Parental smoking | |||
| Yes | 61 (19.4) | 2.9 | .57 |
| No | 253 (80.6) | 2.9 | |
| Pet living mostly indoors | |||
| Yes | 121 (38.1) | 3.3 | .04 |
| No | 197 (61.9) | 2.6 | |
| Age at starting in daycare | |||
| <12 mo | |||
| Yes | 37 (15.7) | 3.1 | .31 |
| No | 198 (84.3) | 3.4 | |
| <18 mo | |||
| Yes | 128 (54.5) | 3.6 | .17 |
| No | 107 (45.5) | 2.9 | |
| <24 mo | |||
| Yes | 181 (77.0) | 3.5 | .22 |
| No | 54 (23.0) | 2.7 | |
| Living environment | |||
| Urban | 260 (82.8) | 2.9 | .74 |
| Rural | 35 (11.1) | 3.0 | |
| Both | 19 (6.1) | 3.1 |
Abbreviation: AOM, acute otitis media.
aP values based on Wilcoxon rank sum test.
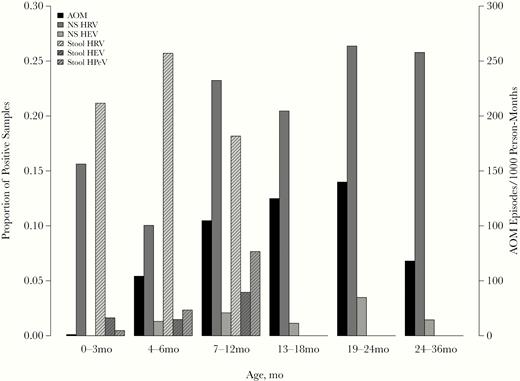
Proportion of virus-positive nasal swab (NS) and stool samples and numbers of acute otitis media (AOM) episodes per month during the indicated follow-up periods (by age). Abbreviations: HEV, human enterovirus; HPeV, human parechovirus; HRV, human rhinovirus.
Three hundred two NS samples (21.8%) and stool samples 594 (20.8%) were positive for HRV, and 25 (1.8%) and 83 (2.9%), respectively, for HEV. Furthermore, 145 stool samples (5.1%) tested positive for HPeV. The proportion of virus-positive NS samples was highest at age 19–24 months for both HRV and HEV. In stool samples obtained during the first year of life, the frequencies of HEV and HPeV were highest at age 7–12 months, whereas HRV infections were most common at age 4–6 months (Figure 1). A clear seasonal pattern of HRV, HEV, and HPeV infections was observed, with HRV infections peaking in late spring/early summer and in autumn, and HEV and HPeV infections peaking in late summer and autumn (Figure 2).
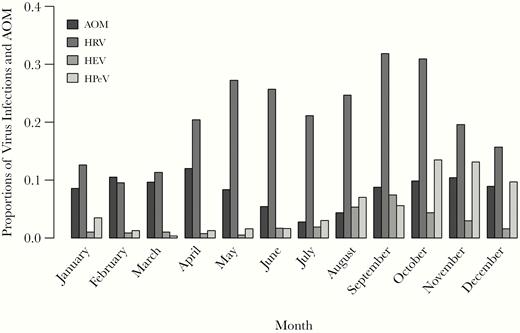
Proportions of acute otitis media (AOM) episodes and human rhinovirus (HRV), human enterovirus (HEV), and human parechovirus (HPeV) RNA findings in nasal swab and/or stool samples detected each month, of all AOM episodes and respective virus findings.
Having siblings significantly increased the proportion of HRV-positive samples (Table 2). Conversely, having siblings and living in the countryside significantly reduced the proportion of HPeV-positive samples. The median starting age for daycare was 17 months (interquartile range, 13–23 months). Starting daycare before age 12 months significantly increased the number of HEV-positive samples.
Association Between Background Characteristics and Proportions of Virus-Positive Samples During Follow-upa
| HRV | HEV | HPeV | |||||||
|---|---|---|---|---|---|---|---|---|---|
| Characteristic | Samples, No. | Positive Samples, No. (%) | P Valueb | Samples, No. | Positive Samples, No. (%) | P Valueb | Samples, No. | Positive Samples, No. (%) | P Valueb |
| Sex | |||||||||
| Male | 2210 | 485 (21.9) | .16 | 2210 | 51 (2.3) | .33 | 1532 | 83 (5.4) | .39 |
| Female | 2038 | 411 (20.2) | 2038 | 57 (2.8) | 1320 | 62 (4.7) | |||
| Firstborn child | |||||||||
| Yes | 2305 | 374 (16.2) | <.001 | 2305 | 50 (2.2) | .10 | 1526 | 95 (6.2) | .004 |
| No | 1943 | 522 (26.9) | 1943 | 58 (3.0) | 1326 | 50 (3.8) | |||
| Siblings | |||||||||
| >1 | 2604 | 628 (24.1) | <.001 | 2604 | 69 (2.6) | .618 | 1768 | 72 (4.1) | .002 |
| None | 1644 | 268 (16.3) | 1644 | 39 (2.4) | 1084 | 73 (6.7) | |||
| Exclusive breastfeeding at age 3 mo | |||||||||
| Yes | 2475 | 539 (21.8) | .86 | 2475 | 63 (2.5) | .49 | 1684 | 90 (5.3) | .77 |
| No | 1040 | 223 (21.4) | 1040 | 31 (3.0) | 693 | 39 (5.6) | |||
| Duration of breastfeeding >6 mo | |||||||||
| Yes | 3077 | 657 (21.4) | .55 | 3077 | 79 (2.6) | .73 | 2074 | 105 (5.1) | .54 |
| No | 980 | 200 (20.4) | 980 | 27 (2.8) | 653 | 37 (5.7) | |||
| Use of pacifier | |||||||||
| Yes | 2690 | 558 (20.7) | .85 | 2690 | 68 (2.5) | >.99 | 1791 | 97 (5.4) | >.99 |
| No | 976 | 205 (21.0) | 976 | 24 (2.5) | 661 | 35 (5.3) | |||
| Parental smoking | |||||||||
| Yes | 822 | 160 (19.5) | .23 | 822 | 23 (2.8) | .71 | 546 | 33 (6.0) | .33 |
| No | 3324 | 713 (21.5) | 3324 | 85 (2.6) | 2236 | 111 (5.0) | |||
| Pet living mostly indoors | |||||||||
| Yes | 1583 | 322 (20.3) | .46 | 1583 | 44 (2.8) | .55 | 1050 | 53 (5.0) | >.99 |
| No | 2619 | 559 (21.3) | 2619 | 64 (2.4) | 1772 | 90 (5.1) | |||
| Age at starting in daycare | |||||||||
| <12 mo | |||||||||
| Yes | 664 | 143 (21.5) | .52 | 664 | 30 (4.5) | <.001 | 449 | 28 (6.2) | .49 |
| No | 2543 | 518 (20.4) | 2543 | 50 (2.0) | 1695 | 91 (5.4) | |||
| <18 mo | |||||||||
| Yes | 1869 | 401 (21.5) | .17 | 1869 | 55 (2.9) | .07 | 1263 | 70 (5.5) | >.99 |
| No | 1338 | 260 (19.4) | 1338 | 25 (1.9) | 881 | 49 (5.6) | |||
| <24 mo | |||||||||
| Yes | 2488 | 503 (20.2) | .32 | 2488 | 67 (2.7) | .22 | 1674 | 87 (5.2) | .17 |
| No | 719 | 158 (22.0) | 719 | 13 (1.8) | 470 | 32 (6.8) | |||
| Living environment | |||||||||
| Urban | 3407 | 705 (20.7) | .15 | 3407 | 88 (2.6) | .14 | 2278 | 124 (5.4) | .03 |
| Rural or both | 731 | 169 (23.1) | 731 | 12 (1.6) | 508 | 16 (3.1) | |||
Abbreviations: HEV, human enterovirus; HPeV, human parechovirus; HRV, human rhinovirus.
aFor HRV and HEV, results are shown for stool and nasal swab samples combined.
bP values based on Fisher exact test.
A majority of the participants (82.4%) experienced ≥1 HRV infection, whereas 18.2% and 29.2% had ≥1 HEV or HPeV infection during the first year of life, respectively. At least 1 AOM episode was registered in 40.7% of participants. Among infants who had ≥1 AOM episode diagnosed by age 1 year, the mean numbers of HRV- and HEV-positive stool samples were higher than among those who did not encounter any AOM episodes by that age (Table 3). Such an association was not seen in NS samples.
Mean Number of Virus-Positive Nasal Swab and Stool Samples Among Children With or Without ≥1 Acute Otitis Media Episode by Age 1 Year
| Virus-Positive Samples, Mean No. | P Valuea | ||
|---|---|---|---|
| Sample Type and Virus | ≥1 AOM Episode | No AOM Episodes | |
| Nasal swab | n = 95b | n = 144b | |
| HRV | 0.5 | 0.5 | .50 |
| HEV | <0.1 | <0.1 | .70 |
| Stool | n = 129 | n = 186 | |
| HRV | 2.3 | 1.6 | <.001 |
| HEV | 0.4 | 0.2 | .04 |
| HPeV | 0.4 | 0.5 | .93 |
| Nasal swab and/or stool | n = 132 | n = 192 | |
| HRV | 2.6 | 1.9 | .002 |
| HEV | 0.4 | 0.2 | .04 |
Abbreviations: AOM, acute otitis media; HEV, human enterovirus; HPeV, human parechovirus; HRV, human rhinovirus.
aP values base on Mann-Whitney U test.
bNumbers (n = 95, n = 144, etc) represent numbers of children.
The time association between virus infections and AOM was studied by comparing the virus detection rate in samples that were collected either within 2 weeks before or after the onset of AOM (101 NS and 184 stool samples) with that in all other samples of the same type (Table 4). HEV detection in NS and stool samples was strongly associated with simultaneous AOM. Furthermore, detection of HRV in stool samples was significantly associated with simultaneous AOM. A similar trend was seen for HPeV, but the association was not statistically significant. The time associations between HRV, HEV, and HPeV detection and AOM episodes remained the same when a longer time window (±3 weeks) was used in these analyses (data not shown).
Proportions of Virus-Positive Samples Obtained From Participants With or Without Acute Otitis Media (AOM) and Association Between Virus Positivity and AOM
| AOMa* | No AOM | OR (95% CI) | |||||
|---|---|---|---|---|---|---|---|
| Sample Type and Virus | Samples, No. | Positive Samples, No. (%) | Samples, No. | Positive Samples, No. (%) | Unadjusted | Adjusted (GLM) | Adjusted (GEEs) |
| Nasal swab | |||||||
| HRV | 101 | 28 (27.7) | 1286 | 274 (21.3) | 1.42 (.90–2.23) | 1.38 (.88–2.18)b | 1.36 (.85–2.18)b |
| HEV | 101 | 5 (5.0) | 1286 | 20 (1.6) | 3.30 (1.21–8.98) | 3.05 (1.12–8.35)b | 3.26 (1.31–8.12)b |
| Stool | |||||||
| HRV | 184 | 50 (27.2) | 2677 | 544 (20.3) | 1.46 (1.04–2.05) | 1.57 (1.10–2.24)c | 1.54 (1.04–2.30)c |
| HEV | 184 | 12 (6.5) | 2677 | 71 (2.7) | 2.56 (1.36–4.81) | 1.94 (1.01–3.72)c | 2.05 (1.10–3.80)c |
| HPeV | 184 | 15 (8.2) | 2668 | 130 (4.9) | 1.73 (.99–3.02) | 1.44 (.81–2.56)d | 1.45 (.84–2.51)d |
| Nasal swab and/or stool e | |||||||
| HRV | 227 | 63 (27.8) | 3309 | 654 (19.8) | 1.56 (1.15–2.11) | 1.53 (1.12–2.09)c | 1.40 (.96–2.04)c |
| HEV | 227 | 15 (6.6) | 3309 | 79 (2.4) | 2.89 (1.64–5.11) | 2.15 (1.19–3.88)c | 2.04 (1.06–3.91)c |
Abbreviations: AOM, acute otitis media; CI, confidence interval; GEEs, generalized estimation equations; GLM, generalized linear model; HEV, human enterovirus; HPeV, human parechovirus; HRV, human rhinovirus; OR, odds ratio.
aAOM within 2 weeks before or after sampling.
bThe final model included virus positivity and having siblings.
cThe final model included virus positivity, being firstborn, and age at time of sampling.
dThe final model included being firstborn and age at time of sampling. Virus positivity was added as an additional variable.
eIncludes only samples obtained during the first 12 months of life.
The PAR percentage was calculated for each virus, using the adjusted ORs shown in Table 4 (combined stool and NS sample results). Based on these estimates, HRV and HEV could explain quite a significant proportion of AOM episodes, HRV slightly more (25%) than HEV (20%), whereas HPeV was less significant (11%).
Discussion
This study aimed to assess the frequency of HRV, HEV, and HPeV infections and their association with AOM in a cohort of Finnish children who were followed up from birth to age 3 years. The study setting allowed the role of these viruses in AOM to be evaluated in an unbiased manner in a child population that was not selected based on hospitalization, diagnosis of AOM, or respiratory infection. This offered an opportunity to evaluate the contribution of HRV, HEV, and HPeV infections to the development of AOM, taking into account the relatively high frequency of these infections in the background population, including children in whom AOM does not develop.
Our findings suggest that HRV and HEV are associated with the development of AOM. According to the PAR percentage calculations, HRVs could theoretically contribute to the development of AOM in up to 25% of AOM cases, and HEVs in up to 20%. HPeVs seem to be less important, because they showed a statistically nonsignificant trend that would equal 10% PAR. Even though the PAR prediction models are not accurate and should be interpreted with caution, the results indicate that the role of these viruses can be significant, particularly during the epidemic seasons. The results also demonstrate the high frequency of HRVs in young children generally, which may lead to overestimation of their role in AOM if a representative control group is not analyzed at the same time.
Overall, our findings regarding the incidence of studied virus infections and their role in the development of AOM are in line with previous reports [9, 14–18, 24, 25]. Of these 3 viruses, HRVs were detected most frequently, with 82.4% and 90.1% of the children testing positive for HRV at least once during the first year of life and by age 3 years, respectively. The incidences of HEV and HPeV infections were lower than that of HRV infections: by age 1 year HEV and HPeV was detected at least once in 18.2% and 29.2% of the participants, respectively, and 21.9% of the participants experienced ≥1 HEV infection by age 3 years. Even though HEV was less common and detected less frequently than HRV or HPeV in samples taken within 2 weeks of an AOM episode, HEV showed the strongest association with the development of AOM. This finding is supported by the results of a prospective, longitudinal cohort study using symptom-driven episodic sampling, which suggested that URI caused by HEV is complicated by AOM slightly more often than URI caused by HRV (34.4% vs 30.4%) [4]. On the other hand, a more recent prospective study among infants based on specimens collected monthly and during URI found HRV to be significantly associated with URI symptoms and AOM development, whereas HEV detection was associated with AOM development only marginally [2, 9].
The incidence of HEV infections in our study was somewhat lower than that found in some other studies [26]. This may partly be explained by our sampling scheme: from age 1 year onward, HEV detection was based solely on NS samples that were collected quite infrequently (every 6–12 months); hence, some HEV infections may have been missed. On the other hand, our finding is in line with those of previous studies suggesting that HEV infections are less common in Finland than in most other European countries [27].
Our findings regarding the incidence of HRV infections agree with those of previous studies, which have shown HRVs to be the most common cause of URIs in early childhood [28]. In the Finnish Otitis Media Cohort Study, 79%–91% of participating children had ≥1 HRV infection during the first 2 years of life, with >20% of children experiencing their first HRV episode by age 6 months [29]. In a recent birth cohort study conducted in Southwestern Finland, HRV was associated with 50% of AOM episodes diagnosed among children aged 0–2 years [30]. Similarly, in the previously mentioned study carried out among 0–12-month-old infants living in the United States, HRV was the most common virus detected during URI, and it was associated with the development of AOM, which complicated 27% of all URI episodes [2]. However, as described above, owing to the high frequency of HRVs in children, the frequency of HRVs during AOM episodes should be compared with those in a representative control group, and most previous studies have not made such comparisons.
One additional factor limiting the ability to draw conclusions from existing literature is the variability in the sensitivity and specificity of RT-qPCR assays used to detect HRV and HEV infections, particularly because both HRVs and HEVs are amplified by the same commonly used primer pairs targeting the conserved 5’ noncoding region of viral genomes. The RT-qPCR assays used in the present study were specific and sensitive for these viruses, as verified repeatedly by best possible scores in external HRV and HEV quality control rounds (Quality Control for Molecular Diagnostics). These assays used primers and probes that were unique to each virus, and therefore no cross-amplification occurred between the viruses.
Previous studies have found that HPeV may also contribute to the development of AOM in at least some cases [16–18]. In the current study, no significant association was seen between HPeV and AOM. This may be due to the relatively small size of our data set. Our study found HEV and HPeV infections to be equally common during the first year of life, because 29% of the participants tested positive for HPeV at least once by age 12 months. This frequency is well in line with the results of 2 birth cohort studies previously conducted in Finland [18, 31].
Our study has some limitations. Because all parental reports of AOM were counted as separate episodes regardless of the time period between consecutive reports, the incidence of AOM may have been overestimated. However, the incidence of AOM during the 3-year follow-up period (1 episode per person-year) agrees well with findings in previous studies in which the incidence of AOM in pediatric populations has varied depending on the study setting and geographic location, ranging from 161 and 256 events per 1000 person-years in Eastern and Western European countries, respectively, to the high incidence of 1470–1540 events per 1000 person-years observed in Finland [14, 32, 33].
The sampling scheme and diagnostic methods applied might be seen as another potential limitation of our study. On the other hand, regular sampling eliminated biases that could have been introduced by symptom-driven episodic sampling. In any case, as viruses were detected by RT-qPCR from samples collected at predefined 1–12-month intervals, some infections were probably missed owing to relatively short shedding of the virus. However, the excretion period of HPeV is relatively long, ranging from 2 to 24 weeks, and monthly collected stool samples have been suggested to be a fairly good method for detecting HPeV infections [31, 34]. Hence, we can assume that our study provides a good estimate for the incidence of HPeV infections among Finnish infants. The shedding periods for HRV and HEV, on the other hand, are thought to be shorter, lasting up to 5–6 weeks for HRV and 2–3 weeks for HEV in NS samples, although longer excretion periods for HEV in stool samples have also been reported [26, 35].
Stool specimens have been considered the classic sample type for HEVs and HPeVs, replicating primarily in the intestinal and oropharyngeal mucosa, but HRVs have also been detected frequently in stool samples [36–38]. A more frequent sampling scheme, including stool samples after 1 year of age or additional use of serologic methods, might have provided a more accurate estimate of the incidence of HRV and HEV infections during the second and third years of life.
Because viruses have been observed to play a significant role in the development of AOM, preventing viral URIs would be beneficial. A systematic review suggested that the influenza vaccine may reduce the incidence of AOM in infants and small children [39]. Our study and previous reports indicate that picornaviruses should also be targeted to prevent AOM in young children. Indeed, a previous study by Seppälä et al [40] implied that the oral polio vaccine, a live attenuated enterovirus vaccine, may reduce the incidence of AOM by providing cross-protection from nonpolio HEVs and other picornaviruses that have been associated with AOM. Although vaccines targeting certain HEVs have already been developed, and currently new HEV vaccines are under clinical development [41], attempts to produce an HRV vaccine have failed [42, 43]. However, recent studies from animal models suggest that it might be possible to develop a multivalent HRV vaccine that can induce immunity against several different HRV types [44]. Altogether, the development of vaccines against AOM-associated picornaviruses remains an important goal in future research, owing to the immense medical and health-economic burden caused by AOM.
In conclusion, our findings in this population-based birth cohort study support previous observations, suggesting that HRVs and HEVs contribute to the development of AOM in young children. HEV showed the strongest association with the development of AOM. These results suggest that antiviral strategies targeted at picornaviruses might be beneficial in preventing AOM in this age group.
Notes
Acknowledgments. The authors thank all the participating children and families in the DIABIMMUNE study, and the physicians, nurses, and technicians in the DIABIMMUNE study centers and laboratories.
Financial support. This work was supported by the European Union Seventh Framework Programme (grant 202063), the Academy of Finland (decision 292538), the Centre of Excellence in Molecular Systems Immunology and Physiology Research (decision 250114), the Liv och Hälsa Fund, Finska Läkaresällskapet, and the Sigrid Juselius Foundation.
Potential conflicts of interest. M. K. and H. H. are shareholders and board members of Vactech, which develops vaccines against picornaviruses. All other authors report no potential conflicts. All authors have submitted the ICMJE Form for Disclosure of Potential Conflicts of Interest. Conflicts that the editors consider relevant to the content of the manuscript have been disclosed.

