


Abstract
Although Schistosoma haematobium infection has been reported to be associated with alterations in immune function, in particular immune hyporesponsiveness, there have been only few studies that have used the approach of removing infection by drug treatment to establish this and to understand the underlying molecular mechanisms.
Schistosoma haematobium-infected schoolchildren were studied before and after praziquantel treatment and compared with uninfected controls. Cellular responses were characterized by cytokine production and flow cytometry, and in a subset of children RNA sequencing (RNA-Seq) transcriptome profiling was performed.
Removal of S haematobium infection resulted in increased schistosome-specific cytokine responses that were negatively associated with CD4+CD25+FOXP3+ T-cells and accompanied by increased frequency of effector memory T-cells. Innate responses to Toll like receptor (TLR) ligation decreased with treatment and showed positive association with CD4+CD25+FOXP3+ T-cells. At the transcriptome level, schistosome infection was associated with enrichment in cell adhesion, whereas parasite removal was associated with a more quiescent profile. Further analysis indicated that alteration in cellular energy metabolism was associated with S haematobium infection and that the early growth response genes 2 and 3 (EGR 2 and EGR3), transcription factors that negatively regulate T-cell activation, may play a role in adaptive immune hyporesponsiveness.
Using a longitudinal study design, we found contrasting effects of schistosome infection on innate and adaptive immune responses. Whereas the innate immune system appears more activated, the adaptive immunity is in a hyporesponsive state reflected in alterations in CD4+CD25+FOXP3+ T-cells, cellular metabolism, and transcription factors involved in anergy.
Schistosomiasis, caused by parasitic trematodes of the genus Schistosoma, affects more than 200 million people worldwide, especially children [1]. Chronic infections with schistosomes are associated with immune hyporesponsiveness characterized by reduced in vitro proliferation of T lymphocytes and decreased cytokine production in response to not only schistosomal antigens [2] but also to third-party antigens such as Mycobacterium tuberculosis purified protein derivative [3, 4]. Treatment with the antischistosomal drug praziquantel (PZQ) leads to clearance of infection [5], elevated antigen-specific proliferation [6], and cytokine production [7, 8]. The mechanisms of T-cell hyporesponsiveness during chronic schistosomiasis are not well understood, but several recent reports have shown that in addition to impaired dendritic cell (DC) activity during schistosome infection [9], regulatory T-cells (Tregs) [10] and regulatory B cells [11] are expanded in schistosome-infected compared with uninfected individuals. However, few studies have examined the effect that parasite elimination by chemotherapy has on CD4+CD25+FOXP3+ T-cells and how this is linked to innate and adaptive immune responses.
Regarding the innate immune system, responses to and expression levels of the Toll-like receptors (TLRs) have been shown to be altered in Schistosoma haematobium-infected individuals [9, 12, 13]. Most of these data come from studies that were cross-sectional in design. Questions remain about whether the removal of schistosome infection with chemotherapy affects innate immune responses and whether there is any link to regulatory responses.
Because immunity against schistosome infection is highly complex and dynamic, pattern-based approaches such as global gene expression profiling could be ideal to further our understanding of mechanisms associated with immune modulation. There are no studies that have examined changes caused by transcriptional signatures of human peripheral blood after effective antischistosomiasis treatment that might give a broader view on and better understanding of how schistosomes affect the immune system. There are also no studies that have simultaneously analyzed immune and transcriptome profiles during infection and treatment.
In the present study, we report the results of immune and transcriptome profiling of a set of longitudinal samples from S haematobium-infected subjects from rural Gabon who were treated with PZQ and uninfected controls who could inform the study of background longitudinal changes not related to treatment.
MATERIALS AND METHODS
Ethics Statement
The study was approved by “Comité d’Ethique Régional Indépendant de Lambaréné” (No. 06/08). Written informed consent was obtained from parents or legal guardians of all participants.
Study Population and Parasitology
Between November 2008 and February 2009 (baseline) and June and December 2009 (follow-up), 79 S haematobium-infected schoolchildren and uninfected controls were recruited for immunological profiling, and an additional 17 were recruited for transcriptome profiling from a S haematobium-endemic rural area surrounding Lambaréné (Gabon) [13].
Schistosoma haematobium infection was determined at baseline and follow-up before blood collection by examining a 10-mL filtrate of urine passed through a 12-µm pore size filter (Millipore); children were classified S haematobium-infected if at least 1 S haematobium egg was detected or uninfected if 3 consecutive samples were negative. Infections with intestinal helminths Ascaris lumbricoides, Trichuris trichiura, and hookworm were determined in 1 fresh stool sample using Kato-Katz at baseline only. Infection with Plasmodium falciparum was determined by polymerase chain reaction (PCR) with a cutoff value of 35 cycle threshold (Ct). After blood collection, all S haematobium-infected children were treated 3 times with single-dose PZQ (40 mg/kg) at 2-month intervals. Intestinal helminth- and malaria-infected children received single-dose albendazole (400 mg) or artemisinin-based combination therapy, respectively, as per national guidelines.
Hematological parameters were analyzed using ADVIA 120 Hematology System (Bayer Health Care), and erythrocyte sedimentation rate (ESR) was determined manually. Circulating anodic antigen (CAA) levels were determined using upconverting phosphor (UCP) technology lateral flow assay [14]. Reagent strips (Cobas) were used to assess hematuria, leukocyturia, and proteinuria, and their scores, ranging from 0 to 3, were added together to calculate the combined reagent strip index (RSI).
Whole Blood Culture
Five hours after venipuncture, heparinized blood was diluted 2× with RPMI-1640 (Invitrogen) supplemented with 100 U/mL penicillin (Astellas), 10 µg/mL streptomycin, 1 mM pyruvate, and 2 mM L-glutamine (all from Sigma-Aldrich). To assess innate responses, whole blood was incubated for 24 hours with 100 ng/mL Pam3CSK-SKKKK (EMC Microcollection). To assess adaptive responses, whole blood was incubated for 72 hours with S haematobium soluble egg antigen (SEA) or adult worm antigen (AWA) (both 10 µg/mL) or 2 µg/mL phytohaemagglutinin ([PHA] Remel). Medium without stimulus was used as negative control. One hundred microliters of ligand(s) in medium was added to wells containing 100 µL diluted blood in 96-well round bottom plates (Nunc) and incubated at 37°C in the presence of 5% CO2. Supernatants were stored at −80°C.
Cytokine Analysis
Supernatants were analyzed simultaneously for interleukin (IL)-10, IL-1β, and tumor necrosis factor (TNF) or IFN-γ, IL-2, IL-5, IL-10, and TNF using customized Luminex cytokine kits (Invitrogen) according to manufacturers’ recommendations. Samples were acquired with Luminex-100 cytometer (Luminex Corporation). Samples below detection limit were assigned values corresponding to half of lowest value detected. For interferon (IFN)-γ, IL-2, IL-5, IL-10, and TNF multiplex assay, lowest values detected were .090 pg/mL for IFN-γ, .063 pg/mL for IL-2, .044 pg/mL for IL-5, .063 pg/mL for IL-10, and .051 pg/mL for TNF. For IL-10, IL-1β, and TNF multiplex assay, lowest values detected were .016 pg/mL for IL-10, .255 pg/mL for IL-1β, and .016 pg/mL for TNF.
Memory and CD4+CD25+FOXP3+ T-Cell Immunophenotyping
Peripheral blood mononuclear cells (PBMCs) were isolated by density centrifugation on Ficoll (AZL pharmacy). For memory T-cell immunophenotyping, PBMCs were fixed in 2.4% formaldehyde (Sigma-Aldrich), frozen in RPMI 1640 medium supplemented with 20% fetal bovine serum (Greiner Bio-One) and 10% dimethyl sulfoxide (Merck), and stored at −80°C. After thawing, cells were stained with anti-CD4-PE-Cy7 (RPA-T4; eBioscience), anti-CD45RA-Horizon V450 (HI100; BD Biosciences), and anti-CD27-FITC (L128; BD Biosciences). For CD4+CD25+FOXP3+ T-cell immunophenotyping, PBMCs were fixed with FoxP3 fixation/permeabilization kit (eBisocience) and stored at −80°C. After thawing, cells were stained with CD4-PE-Cy7 (SK3; BD Biosciences), CD25-PE (2A3; BD Biosciences), and FOXP3-APC (PCH101; eBioscience). Cells were acquired on FACSCanto II flow cytometer (BD Biosciences) and analyzed in FlowJo software version 9 (Tree Star Inc.); boolean gates were used for memory T-cell analysis.
Statistical Analysis
Differences between study groups for gender, malaria, and intestinal helminth infections were tested using Fisher’s exact test. Differences in malaria prevalence pre- to posttreatment were tested with McNemar’s test. Age, ESR, and hemogram parameters were tested using independent t test. Infection indices and T-cell subsets were compared with Mann-Whitney U test. Within group differences between baseline and follow-up were compared with Wilcoxon matched-pairs test. Correlations between infection indices were analyzed by Spearman’s rank correlation.
Stimulated cytokine concentrations were corrected for spontaneous cytokine production by subtracting responses of unstimulated medium wells, with negatives values set to half of the lowest value detected per given cytokine, and normalized by log (base 10) transformation after adding 1 pg/mL. Univariate general linear model analysis adjusted for age was used to compare between infection groups, and resulting adjusted means were antilog-transformed for graphing purposes. Differences within the same group between baseline and follow-up were compared by paired t test.
Repeated-measures, linear mixed-effects model was used to assess the following: longitudinal association between CD4+CD25+FOXP3+ T-cell levels and cytokine responses to Pam3 and schistosomal products with cytokine levels as dependent variable; participant identification as random effect; infection group as fixed effect; and CD4+CD25+FOXP3+ T-cell level as covariate.
For all tests, statistical significance was considered at the 5% level. To adjust for multiple comparisons, Bonferroni-Holm correction was used. Data were analyzed using IBM SPSS Statistics (IBM Corp.).
Ribonucleic Acid (RNA) Isolation and Illumina Sequencing
Ribonucleic acid was extracted from PBMCs and stored in total RNA Lysis solution (Invitrogen) at −80°C. Messenger RNA (mRNA) was purified using ABI PRISM 6100 Nucleic Acid PrepStation (Applied Biosystems) according to manufacturer’s recommendations. Samples were treated with DNAse, integrity of each RNA preparation was verified on 2100 Bioanalyzer (Agilent), and concentration was assessed on a Qubit fluorometer (Thermo Fisher Scientific). Poly(A) RNA was selected from 1 µg total RNA using Dynabeads mRNA Direct Micro kit (Life Technologies) and reverse transcribed using Ovation RNA Amplification System V2 (NuGEN Technologies). Multiplexed, paired-end, small fragment, Illumina libraries were constructed with Kapa LTP Library Prep kit (Kapa Biosystems) and sequenced on Illumina HiSeq 2000 version 3 flow cell according to manufacturer’s recommendations (Illumina Inc). All gene expression data are publically available (National Center for Biotechnology Information [NCBI]’s Gene Expression Omnibus; Series Accession Numbers GSE92917 [GSM2440-348/349/350/351/352/353/354/355/356/357/358/359/360/361] and GSE113287 [GSM3102-791/792/793/794/797/798/801/802/ 803/804/805/806/807/808/811/812/813/814/815/816]).
Bioinformatics Analyses
Paired-end reads were mapped to human genome reference assembly GRCh37-lite with Ensembl 74 annotation (NCBI) using TopHat, which incorporates the Bowtie v2.1.0 algorithm [15]. Resultant TopHat mappings were processed through Cufflinks into transcripts [16], and raw digital read counts were made using HTSeq [17]. Differential expression analysis between S haematobium-infected and uninfected controls and between baseline and follow-up within each group was performed by edgeR likelihood ratio test [18] after normalization by RUVseq [19] applying false discovery rate (FDR) significance cutoff of ≤.05. Gene ontology analysis was performed using WebGestalt [20]. The FDR control (Benjamini and Hochberg method) was used to correct for multiple testing. GSEAPreranked module, with scoring scheme parameter set to classic, was used to conduct gene set enrichment analysis [21] of blood transcription modules (BTMs) [22] and KEGG metabolic pathways. Data were analyzed in R version 3.6.1 and visualized using pheatmap and ggplot2 packages.
RESULTS
Study Population Characteristics
Study subjects for immunological profiling comprised S haematobium-infected schoolchildren (N = 40) and uninfected controls (N = 39). There were no significant differences between the groups in P falciparum, A lumbricoides, T trichiura, and hookworm prevalence or in hematological parameters at baseline (Supplementary Table 1). Schistosome infection as assessed by egg counts, plasma CAA, hematuria, and RSI score are given in Table 1; as expected, all were significantly correlated (P < .001). Praziquantel treatment significantly reduced all parameters in infected schoolchildren (P < .001) (Table 1). A subset of study subjects comprising S haematobium-infected schoolchildren (N = 8) and uninfected controls (N = 9) was profiled transcriptionally. This group showed no demographic, parasitological, or hematological differences (P > .05; data not shown) from subjects included in immunological profiling.
Median Values of Infection Indices in Study Populationa
| Baseline | Follow-up | |||
|---|---|---|---|---|
| Infection Indices | Schistosoma haematobium Uninfected | S haematobium Infected | S haematobium Uninfected | S haematobium Infected |
| Median egg counts (IQR) | 0.0 (0.0–.0)b | 19.5 (5.3–87.0)b,c | 0.0 (0.0–.0) | 0.0 (0.0–.0)c |
| Plasma CAA levels pg/mL (IQR) | 0.0 (0.0–3.0)b | 420.5 (12.3–1196.3)b,c | 0.0 (0.0–.3) | 12.5 (0.0–74.3)c |
| Hematuria score (IQR) | 0.0 (0.0–.0)b | 3.0 (0.0–3.0)b,c | 0.0 (0.0–.0) | 0.0 (0.0–.0)c |
| RSI score (IQR) | 0.0 (0.0–2.0)b | 5.0 2.0–6.3)b,c | 0.0 (0.0–2.0) | 0.0 (0.0–1.0)c |
Abbreviations: CAA, circulating anodic antigen; IQR, interquartile range; RSI, reagent strip index.
aDifferences between groups were tested with Mann-Whitney U test and within group differences between baseline and follow-up with Wilcoxon matched pairs test. Significant between group differences are indicated with b and within group differences with c; all P < .001. Infection indices were all significantly correlated with each other: egg counts with hematuria (ρ = .767, P < .001); egg counts with RSI (ρ = .746, P < .001); CAA with hematuria (ρ = .632, P < .001); CAA with RSI (ρ = .556, P < .001); and egg counts with CAA (ρ = .748, P < .001).
Antischistosome Treatment Decreases Tumor Necrosis Factor (TNF) Levels in Response to Toll-Like Receptor (TLR) Stimulation
Over the 7-month study period, TNF response to Pam3 decreased significantly in infected subjects who successfully cleared infection (Figure 1) but not in uninfected controls. Levels of IL-1β and IL-10 decreased significantly in all study subjects, which may be related to longitudinal seasonal or environmental changes. No differences were observed in cytokine production of unstimulated cells between infection groups or between baseline and follow-up time points (Supplementary Figure 1A).
![Cytokine production in response to Toll-like receptor (TLR)2/1 stimulation in whole blood cultures. Whole blood from Schistosoma haematobium (S.h.)-infected schoolchildren and uninfected controls was stimulated with Pam3 (TLR2/1). After 24 hours of culture, tumor necrosis factor ([TNF] A), interleukin (IL)-1β (B), and IL-10 (C) were measured by Luminex. Differences between groups were tested with general linear model univariate analysis adjusted for age and within groups with a paired sample t test. Results are shown as age-adjusted geometric means. **, P < .01; ***, P < .001. Numbers of donors in each group: S.h. (−) baseline n = 39, S.h. (−) follow-up n = 39, S.h. (+) baseline n = 40, and S.h. (+) follow-up n = 40.](https://oup.silverchair-cdn.com/oup/backfile/Content_public/Journal/jid/222/12/10.1093_infdis_jiz641/1/m_jiz641_fig1.jpeg?Expires=1749888602&Signature=AFXasHWpr6tKCpKe58FZT79J7ij8gfg1-RCEo9xQ3~Xf8d-00QX9Wz2WFzSULWAb7kEmykryWvVUpyi8fpHfNri9tCd-iZ9qd9NhCOm~lg5hnkY8zezKwNI93egdZf4rJQUBsj-M0wX95I~jp9PlebDIPZhLL4Dw5527l-GeKzQlvGp0gBxnaZmhDqRCJBGa0YicnP6nRybKWvWiPP7wOXH8zSTFkuSRbnztdKpY0U8P5wBUGGnk6o6P5laoq~0FFDMCGtgOkiE9TWh~CKyRFvPNhwx~MDD3pQlCUrZIFqiZnqJrYKdsrWxtcr9dy57FQT1H-m9XU5ylelNK375F8Q__&Key-Pair-Id=APKAIE5G5CRDK6RD3PGA)
Cytokine production in response to Toll-like receptor (TLR)2/1 stimulation in whole blood cultures. Whole blood from Schistosoma haematobium (S.h.)-infected schoolchildren and uninfected controls was stimulated with Pam3 (TLR2/1). After 24 hours of culture, tumor necrosis factor ([TNF] A), interleukin (IL)-1β (B), and IL-10 (C) were measured by Luminex. Differences between groups were tested with general linear model univariate analysis adjusted for age and within groups with a paired sample t test. Results are shown as age-adjusted geometric means. **, P < .01; ***, P < .001. Numbers of donors in each group: S.h. (−) baseline n = 39, S.h. (−) follow-up n = 39, S.h. (+) baseline n = 40, and S.h. (+) follow-up n = 40.
Reversal of Antigen-Specific Hyporesponsiveness After Antischistosome Treatment Is Accompanied by an Increase in Effector T-Cells
At baseline, S haematobium-infected schoolchildren responded to SEA and AWA, by producing IFN-γ, IL-2, IL-5, IL-10, and TNF, whereas uninfected controls did not (Figure 2 and Supplementary Table 2A). There were no differences in response to PHA between infected and uninfected controls at baseline. Cytokine responses to SEA and AWA increased after treatment (Figure 2 and Supplementary Table 2B), as did IL-10 in response to PHA (P = .001). No differences were seen in spontaneous cytokine production (in unstimulated cultures) between infected and uninfected children or between baseline and follow-up (Supplementary Figure 1B). Increased adaptive immune responses after PZQ treatment were accompanied by increased frequency of effector memory T-cells ([TEM] CD45RA−CD27−) (Figure 3B).
![Cytokine production in response to schistosomal antigens in whole blood cultures. Whole blood from Schistosoma haematobium-infected schoolchildren and uninfected controls was stimulated with schistosomal egg antigen (SEA) and adult worm antigen (AWA). After 72 hours of culture, levels of Th1 (A), Th2 (B), regulatory (C), proinflammatory (D), and interleukin (IL)-2 (E) cytokines were measured by Luminex. The follow-up samples were obtained at 7 months posttreatment with praziquantel (PZQ) of children that were infected with S haematobium at pretreatment. The uninfected controls were also examined at the same follow-up period but did not receive PZQ. At baseline, S haematobium (S.h.)-infected schoolchildren responded to SEA and AWA by producing cytokines, whereas uninfected controls did not (all P < .01 except for interferon [IFN]-γ [P = .145] and tumor necrosis factor [TNF] [P = .034] in response to SEA). For baseline/follow-up comparison, **P < .01, and ***P < .001. Numbers of donors in each group: S.h. (−) baseline n = 39, S.h. (−) follow-up n = 39, S.h. (+) baseline n = 40, and S.h. (+) follow-up n = 40.](https://oup.silverchair-cdn.com/oup/backfile/Content_public/Journal/jid/222/12/10.1093_infdis_jiz641/1/m_jiz641_fig2.jpeg?Expires=1749888602&Signature=R8MpUut3I4dvG011jpvZ0xd9LikcUP4gggzJISsBsYnHrDw5Mx2r~~HgicaS09U3AQSjg-7jbS84a3bOJLxQaTV5jWMpj-66y0du0B~VinjPthCvXbZmJIg8JLnhte0TsaVVKPlpe2g1bfa~RgnE~7XWdKMgbcX15Zlsp4BUmn3Yksl7iP6bWAv7lPzY2XvQJgFABHt1YCXKvhE0A-EfYs-wGCT1Ic1H8Il1~cKMstZacIIp12iF3mKaLQE0owafMqDtoPByXiMH~XX6ea-66mp98LNWcy5ELNvEtsFLkTEll6QCC100SmYtOO54ZHUWvwKy7-wIK0KSx86niJa4kw__&Key-Pair-Id=APKAIE5G5CRDK6RD3PGA)
Cytokine production in response to schistosomal antigens in whole blood cultures. Whole blood from Schistosoma haematobium-infected schoolchildren and uninfected controls was stimulated with schistosomal egg antigen (SEA) and adult worm antigen (AWA). After 72 hours of culture, levels of Th1 (A), Th2 (B), regulatory (C), proinflammatory (D), and interleukin (IL)-2 (E) cytokines were measured by Luminex. The follow-up samples were obtained at 7 months posttreatment with praziquantel (PZQ) of children that were infected with S haematobium at pretreatment. The uninfected controls were also examined at the same follow-up period but did not receive PZQ. At baseline, S haematobium (S.h.)-infected schoolchildren responded to SEA and AWA by producing cytokines, whereas uninfected controls did not (all P < .01 except for interferon [IFN]-γ [P = .145] and tumor necrosis factor [TNF] [P = .034] in response to SEA). For baseline/follow-up comparison, **P < .01, and ***P < .001. Numbers of donors in each group: S.h. (−) baseline n = 39, S.h. (−) follow-up n = 39, S.h. (+) baseline n = 40, and S.h. (+) follow-up n = 40.
![Memory T-cell (TCM) analysis. CD4+ T-cells were identified, and Boolean gating combinations were used to determine proportions of T-cell subsets based on CD45RA and CD27 expression (A). Proportion of CD4+-gated cells that were CD45RA−CD27+ (TCM), CD45RA+CD27+ (naive), CD45RA−CD27− (memory T-cells [TEM]), and CD45RA+CD27− (TEMRA) were determined for Schistosoma haematobium (S.h.)-infected and -uninfected controls at baseline and follow-up (B). Differences between groups were tested with general linear model univariate analysis adjusted for age and within groups with a paired sample t test. Results are shown as unadjusted values. Horizontal bars represent median. *, P < .05. Numbers of donors in each group: S.h. (−) baseline n = 28, S.h. (−) follow-up n = 27, S.h. (+) baseline n = 31, and S.h. (+) follow-up n = 28. FSC, forward scatter; SSC, side scatter.](https://oup.silverchair-cdn.com/oup/backfile/Content_public/Journal/jid/222/12/10.1093_infdis_jiz641/1/m_jiz641_fig3.jpeg?Expires=1749888602&Signature=via5VYVq1mgUkGnlh3i~57qkunhugKL397-iegKa-aaMyrmfqIIqK8BMMdgDtCYvG9zXXEgkYKrEGRk9dP4QZNTZ~MPd8f60mk2gdowITn2V8WeXY3SCOkWSiO1i0bQJxoGsWc6uP3CHtDfbvjAtFRm~GQcb0DcuL8-~iIKjlTFAPyHU~k4tg5B4HIikTRu-7hkCDCxo0C9rN81nXRLCtDZ8cRu~SdWDZqTAHtsjjwMcISyFwpWS47okvyxamtNqe99XzK~S5DjxOQk1YPPmqBNbaGE5Y6Cv7W2NEfOvZXIyqwis~JgsExqarLUxGc020G7uJ38igYLjfcaVjS0idg__&Key-Pair-Id=APKAIE5G5CRDK6RD3PGA)
Memory T-cell (TCM) analysis. CD4+ T-cells were identified, and Boolean gating combinations were used to determine proportions of T-cell subsets based on CD45RA and CD27 expression (A). Proportion of CD4+-gated cells that were CD45RA−CD27+ (TCM), CD45RA+CD27+ (naive), CD45RA−CD27− (memory T-cells [TEM]), and CD45RA+CD27− (TEMRA) were determined for Schistosoma haematobium (S.h.)-infected and -uninfected controls at baseline and follow-up (B). Differences between groups were tested with general linear model univariate analysis adjusted for age and within groups with a paired sample t test. Results are shown as unadjusted values. Horizontal bars represent median. *, P < .05. Numbers of donors in each group: S.h. (−) baseline n = 28, S.h. (−) follow-up n = 27, S.h. (+) baseline n = 31, and S.h. (+) follow-up n = 28. FSC, forward scatter; SSC, side scatter.
Association Between CD4+CD25+FOXP3+ T-Cells and Innate and Adaptive Cytokine Responses
Percentage of CD4+CD25+FOXP3+ T-cells was found to be significantly higher in infected children at baseline and was significantly reduced, to levels comparable to uninfected controls, after treatment (Figure 4). Longitudinal decrease in CD4+CD25+FOXP3+ T-cell frequencies was parallel with a similar decrease observed in TNF levels in response to Pam3 (estimate β = 1.04; 95% confidence interval [CI], 0.10–1.97; P < .05) (Supplementary Table 3). In contrast, there was a negative association between longitudinal decrease in CD4+CD25+FOXP3+ T-cell frequencies and an increase in adaptive cytokine responses, and this reached statistical significance for IL-5 and IL-10 in response to both SEA and AWA and for IL-2 in response to AWA (estimate β = −1.04 [95% CI = −1.91 to −0.18], estimate β = −1.08 [95% CI = −1.76 to −0.41], estimate β = −1.15 [95% CI = −1.69 to −0.62], estimate β = −0.60 [95% CI = −1.02 to −0.18], and estimate β = −0.47 [95% CI = −0.94 to .00], respectively; all P < .05) (Supplementary Table 3).
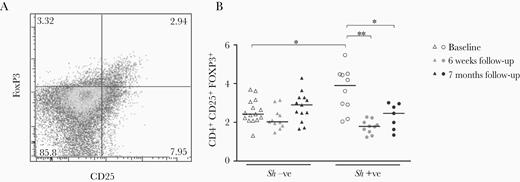
CD4+CD25+FOXP3+ T-cell analysis. CD4+CD25+FOXP3+ T-cells were identified and enumerated in a subset of participants with flow cytometry with initial gating steps performed as described in Figure 3 (A), and frequencies were determined for Schistosoma haematobium (S.h.)-infected children and uninfected controls at baseline and at follow-up (B). Differences between groups were tested with general linear model univariate analysis adjusted for age and within groups with a paired sample t test. Results are shown as unadjusted values. Horizontal bars represent median. *, P < .05; **, P < .01. Numbers of donors in each group: S.h. (−) baseline n = 7, S.h. (−) 6-week follow-up n = 7, S.h. (−) 7-month follow-up n = 6, S.h. (+) baseline n = 10, S.h. (+) 6-week follow-up n = 10, and S.h. (+) 7-month follow-up n = 7.
Schistosoma haematobium Infection and Treatment Are Associated With Distinct Transcriptional Profiles
Schistosoma haematobium infection was associated with altered expression of 320 genes (140 upregulated and 180 downregulated) compared with uninfected controls, whereas after PZQ treatment, only 4 genes were differentially expressed between the 2 groups. Praziquantel treatment was associated with altered expression of 192 genes (34 upregulated and 158 downregulated), whereas 4 genes were differentially expressed over the same time period in the control group (Figure 5A). Results obtained for all 11 112 genes are provided in online Supplementary Table 4, and clustering of the top 50 most significant genes at baseline and after PZQ treatment are shown in Figure 5B. Gene ontology analysis emphasized enrichment in processes associated with cell adhesion during infection, whereas PZQ treatment resulted in downregulation of immune responses and cell cycle (Supplementary Table 5). Blood transcription module (BTM) analysis based on gene networks specific for blood immune responses identified positive enrichment at baseline in S haematobium-infected individuals for T-cells and mitotic cell cycle and reduced gene signatures for natural killer (NK) cells, DCs, and monocytes. Treatment reversed differences in NK cell signatures and mitotic cell cycle, and further differences were observed in reduced overall immune activation, whereas T-cell activation further increased (Figure 6 and Supplementary Table 6). Finally, targeted analysis of KEGG metabolic pathways using GSEA revealed upregulation in “oxidative phosphorylation” and the “citrate/TCA cycle” in schistosome-infected subjects. After PZQ treatment, oxidative phosphorylation was further upregulated, whereas the citrate/TCA cycle was downregulated (Figure 6 and Supplementary Table 6).
![Differentially expressed genes during Schistosoma haematobium infection. Volcano plot displaying differentially expressed genes (false discovery rate [FDR]-adjusted, P < .05) between S haematobium-infected schoolchildren and uninfected controls and within each group between baseline and follow-up (A). Heatmaps of the top 50 differentially expressed genes between S haematobium-infected schoolchildren and uninfected controls at baseline and within S haematobium (S.h.)-infected schoolchildren after praziquantel treatment. Log2-transformed raw counts were mean-centered gene-wise. Dendrograms indicate complete-linkage hierarchical clustering of the euclidean distances among genes or samples (B). Numbers of donors in each group: S.h. (−) baseline n = 9, S.h. (−) follow-up n = 9, S.h. (+) baseline n = 8, and S.h. (+) follow-up n = 8.](https://oup.silverchair-cdn.com/oup/backfile/Content_public/Journal/jid/222/12/10.1093_infdis_jiz641/1/m_jiz641_fig5.jpeg?Expires=1749888602&Signature=WMtTR00CMTe3gZzGs5L5Snahi4jCKXJYhUorEdNl4~py4cuB4WFhUQAu-SDbjYjMQkGcwTE-8IMORKnKJvmbMtPNq4yupQW6guHgAy-SvGkBL2GnFbJXA88KXPhWzOZH~ObQZG3239oDubLvizZUhzhmgIgYd6Y1URGQhHam~G9Tq4T~HIcvg1b209BUStwMmk7vOSgI5ZK20510J6~pM44M6OxyiwjC25k5zq7mJhS0djquXshNwok99X59zhiIC~RCbauVMECkTWV7FUd2CIUfOAzDwXPhFrD3OVe~JLbRTHokJqeI2S4V4o9eXzyQgvnzRxRUnRTugqbxXMRu3w__&Key-Pair-Id=APKAIE5G5CRDK6RD3PGA)
Differentially expressed genes during Schistosoma haematobium infection. Volcano plot displaying differentially expressed genes (false discovery rate [FDR]-adjusted, P < .05) between S haematobium-infected schoolchildren and uninfected controls and within each group between baseline and follow-up (A). Heatmaps of the top 50 differentially expressed genes between S haematobium-infected schoolchildren and uninfected controls at baseline and within S haematobium (S.h.)-infected schoolchildren after praziquantel treatment. Log2-transformed raw counts were mean-centered gene-wise. Dendrograms indicate complete-linkage hierarchical clustering of the euclidean distances among genes or samples (B). Numbers of donors in each group: S.h. (−) baseline n = 9, S.h. (−) follow-up n = 9, S.h. (+) baseline n = 8, and S.h. (+) follow-up n = 8.
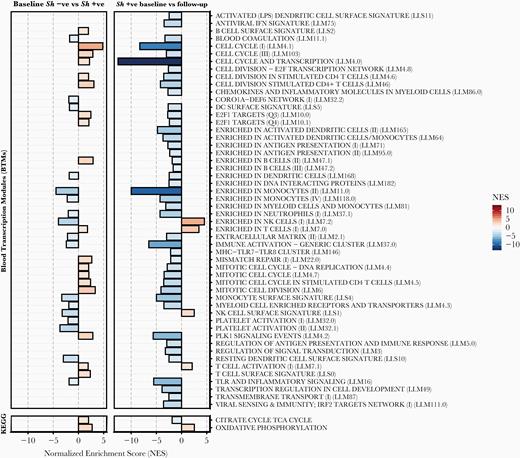
Gene set enrichment analysis (GSEA) of blood transcription modules (BTMs) and metabolic pathways during Schistosoma haematobium infection. The GSEA of BTMs and KEGG metabolic pathways during S haematobium infection and after parasite removal after praziquantel treatment. All modules shown are significantly enriched (false discovery rate-adjusted, P < .05). NES, normalized enrichment score.
DISCUSSION
Downregulation of immune responses has been ascribed to a strong immunomodulatory network induced by schistosomes. In this study, we show that not only (as shown earlier) CD4+CD25+FOXP3+ T-cell numbers decrease after PZQ treatment [10, 23], but we link this to the reversal of T-cell hyporesponsivness. Of note, changes in cell subset levels may also be reflected in the RNA-seq data where elevated levels of mitotic cell cycle and cell division BTMs were observed during infection and were downregulated after PZQ treatment. CD4+CD25+FOXP3+ T-cells seem to have the ability to control effector T-cell responses as suggested by the observation of a parallel increase in effector memory (TEM) cells and an increase in adaptive cytokine production after PZQ treatment of infected children. Interestingly we found that the critical transcriptional factors for the induction of T-cell anergy, the early growth response genes 2 and 3 (EGR2 and EGR3), are significantly downregulated after treatment (Egr2 and Egr3 are zinc-finger transcription factors of the Egr family and both have been shown to be involved in the induction and maintenance of T-cell anergy [24]). These data indicate that in addition to regulation by Tregs, there may also be anergy-related hyporesponsiveness. In a recent study, Fasciola hepatica infection was reported to be associated with enhanced expression of EGR2 [25]. Egr2 and/or Egr3 directly induce expression of suppressor of cytokine signaling (SOCS)1 and SOCS3, inhibitors of STAT1 and STAT3 [26]; a significant decrease in SOCS3 was observed in our dataset after treatment, mirroring the decrease in both EGR2 and EGR3. Further studies will be needed to assess the role of EGR2 and EGR3 in specific cell subsets during schistosomiasis.
At the cytokine level, baseline adaptive cytokine responses of whole blood samples from S haematobium-infected schoolchildren responded to SEA and AWA stimulation, whereas uninfected controls did not, indicating presence of antigen-specific memory T-cells during infection. Chemotherapy over a 7-month period resulted in increased adaptive cytokine production. Enhanced cytokine responses posttreatment have been seen in a number of short-term, 5- to 7-week posttreatment studies [6–8, 23, 27]. A study examining immune responses 1 and 2 years posttreatment of Kenyan Schistosoma mansoni-infected schoolchildren observed an increase in Th2 responses (IL-4, IL-5, IL-9, and IL-13) to both SEA and AWA; however, proinflammatory responses (IL-1β, TNF, CCL5, and IL-6) were decreased in response to SEA or unchanged in response to AWA [28]. It is interesting to speculate that the decrease in IL-1β, TNF, CCL5, and IL-6 in the Kenyan cohort may represent an innate immune component and may be in line with our results in which a significant decrease in innate TNF response was observed posttreatment. In contrast to the Kenyan cohort, we did not see a decrease in TNF response to SEA. However, it should be noted that children recruited in the Kenyan study all presented with hepatomegaly and exhibited predominant proinflammatory responses at pretreatment, whereas children in our study were free of pathology as assessed by bladder ultrasonography (AAA, unpublished data, 2008–2009). Our study indicates that parasite removal over a longer period of time in children without pathology is associated with sustained enhancement of antigen-specific responses, in agreement with short-term treatment studies and the increase in Th2 responses seen in the long-term treatment Kenyan study [28].
The observation of a significant decrease in TNF levels in response to TLR stimulation in vitro in the infected group treated with PZQ is in line with findings that show TNF to be associated with schistosomiasis [13, 29, 30]. It is interesting to note that there was a significant association between the decrease in TNF response to Pam3 and the decrease in CD4+CD25+FOXP3+ T-cells. This is in line with several studies in murine models that show TNF [31] and signaling through TNF receptor II to be important for Tregs [31–33], whereas limited human studies have shown contrasting results [34–37]. The possibility that such differences might be due to involvement of different regulatory T-cell subsets would need to be considered because studies in murine models have shown that natural Tregs (nTregs) but not inducible Tregs (iTregs) require TNF-α for their in vivo function [38], and human studies have shown that anti-TNF-α antibody significantly reduces Helios+ Treg proliferation but increases proliferation of Helios− Tregs [36].
Helminth infections induce inflammation resulting in the mobilization, proliferation, and recruitment of immune cells. Although microarray studies have shown an upregulation of cell migration and chemokines in the liver of Schistosoma japonicum-infected mice [39, 40], our RNA-seq data suggest a previously underappreciated enrichment of cell adhesion in peripheral blood during infection. In addition, a number of top genes differentially expressed during infection or PZQ treatment were chemokine and chemokine receptor genes. It is interesting to note that a study on P falciparum and S haematobium coinfection showed that S haematobium infection was associated with an increased chemokine profile [41].
Recent research has shown that a number of abnormal and atypical immune responses result from incorrect metabolic activity and that manipulation of cellular metabolism can augment and moderate immunity [42]. Metabolic processes including oxidative phosphorylation, glycolysis, and lipid and fatty acid metabolism have highly specific effects on immune cell function [42]. Analysis of classic metabolic pathways showed that citrate/TCA cycle and oxidative phosphorylation were both significantly upregulated during schistosome infection. Recent reports have highlighted the role of these pathways in induction and maintenance of type 2 immunity [43] typically associated with schistosomiasis, and future studies will be needed to explore the relationship between immunometabolism and immune responses during schistosomiasis in endemic populations. Intriguingly, EGR2 was recently shown to play a role in immune metabolism and to be upstream of lipid metabolism genes [44].
Finally, BTM analysis suggests a role for NK cells during S haematobium infection. Natural killer cells have been shown to be activated during helminth infection [45, 46], and in vivo depletion of NK cells in a murine model of filarial infection strongly enhanced worm load and influenced IL-4 and IL-5 plasma levels [47]. In addition, although their activity is significantly depressed in chronically S mansoni-infected patients [48], the role of these cells in protective responses during helminth infection is still not clear and warrants further analysis.
CONCLUSIONS
In summary, this study not only compared S haematobium-infected and -uninfected subjects at baseline, but it also compared subjects whose infection was removed by PZQ treatment, to pinpoint the responses specifically affected by schistosome infection. Our results show that infection with S haematobium is associated with antigen-specific hyporesponsiveness, alterations of the T-cell memory pool, and increased levels of CD4+CD25+FOXP3+ T-cells and that PZQ treatment leads to increased effector T-cell frequencies and decreased levels of CD4+CD25+FOXP3+ T-cells, which were associated with decreased TLR-specific TNF levels and increased antigen-specific cytokine production. Parallel transcriptome interrogation indicates that in addition to regulation by Tregs, there is also hyporesponsiveness due to anergy, and it suggests a previously underappreciated enrichment for immune cell adhesion in peripheral blood and a role of immunometabolism and NK cells in the course of S haematobium infection.
Supplementary Data
Supplementary materials are available at The Journal of Infectious Diseases online. Consisting of data provided by the authors to benefit the reader, the posted materials are not copyedited and are the sole responsibility of the authors, so questions or comments should be addressed to the corresponding author.
Notes
Acknowledgments. We thank the schoolchildren for volunteering to participate in this study. We also thank all of the field workers involved: Anne-Marie Nkoma Mouima, Claude Nzima Moussambi, Evrard Moutembi, Guy Gaspard Nzadi, Paul-Valerie Mbadinga, Olivier Koumba, and Ulrich Tedy Mabama as well as Dr. Eliane Ngoune Feugap who coordinated field activities. Furthermore, we thank Rogier Achterberg, Mareen Datema, and Churnalisa Doran for performing Luminex and enzyme-linked immunosorbent assay of the adaptive responses, Yvonne Kruize for preparing schistosomal antigens and isolating ribonucleic acid from peripheral blood mononuclear cell samples, and Dr. Erliyani Sartono for critical reading of the manuscript. Finally, we thank Govert J. van Dam and Claudia J. de Dood for assistance with circulating anodic antigen measurements. We acknowledge support of Open Access Publishing fund of Leiden University.
Financial support. This work was supported by the European Union (EU)-funded project Innate Immune Responses and Immunoregulation in Schistosomiasis: Novel Mechanisms in the Control of Infection and Disease “SCHISTOINIR” (INCO-CT-2006–032405), the EU-funded project the Immunological Interplay between Poverty Related Diseases and Helminth Infections: An African-European Research Initiative “IDEA” (HEALTH-F3-2009–241642), the Deutsche Forschungsgemeinschaft-funded project Deutsch-Afrikanische Kooperationsprojekte in der Infektiologie (DFG-Projekt KR 1150/6-1) and the National Institutes of Health National Institute of Allergy and Infectious Diseases funded project Comparative Genomics of Parasitic Nematodes (AI081803).
Potential conflicts of interest. All authors: No reported conflicts of interest. All authors have submitted the ICMJE Form for Disclosure of Potential Conflicts of Interest.
Presented in part: International Congress for Tropical Medicine and Malaria, September 2016, Brisbane, QLD, Australia.
References

