


Abstract
We assessed cell-mediated immune (CMI) responses of influenza vaccination in patients with cancer receiving immune checkpoint inhibitors (ICIs), which remain elusive.
Vaccine-elicited CMI responses in patients receiving ICIs or cytotoxic agents were investigated by flow cytometry. Polyfunctional cells were defined as T cells that express 2 or more of interleukin 2 (IL-2), interleukin 4 (IL-4), interferon gamma (IFN-γ), and CD107a. An adequate CMI response was defined as an increase of polyfunctional T cells against both H1N1 and H3N2 strains.
When comparing ICI (n = 11) and cytotoxic chemotherapy (n = 29) groups, H1N1-specific IL-4 or IFN-γ–expressing CD4+ T cells, IL-2, IL-4, IFN-γ, or CD107a-expressing CD8+ T cells, H3N2-specific IFN-γ–expressing CD4+ T cells, and CD107a-expressing CD8+ T cells were more frequent in the ICI group. Fold changes in polyfunctional H3N2-specific CD4+ (median, 156.0 vs 95.7; P = .005) and CD8+ (155.0 vs 103.4; P = .044) T cells were greater in the ICI group. ICI administration was strongly associated with an adequate CMI response for both CD4+ and CD8+ T cells (P = .003).
CMI responses following influenza vaccination were stronger in the ICI group than in the cytotoxic chemotherapy group. Influenza vaccination should be strongly recommended in patients with cancer receiving ICIs.
Immune checkpoint inhibitors (ICIs) have emerged as promising anticancer agents and have gained regulatory approval for various types of cancer [1]. For example, the monoclonal antibodies nivolumab and pembrolizumab, which target programmed cell death protein 1 (PD-1), have become the standard of care for patients with head and neck cancers, non–small cell lung cancer, and colorectal cancer [2]. Since ICIs are able to eliminate malignant cells by reinvigorating exhausted and dysfunctional T cells and unleashing antitumor immune responses, vaccine immunogenicity might differ between patients undergoing ICI treatment and patients treated with conventional cytotoxic agents.
Annual influenza vaccination is strongly recommended for patients with cancer receiving chemotherapy, as these patients are immunosuppressed and, hence, more prone to influenza-induced morbidity [3, 4]. Although the immunogenicity of influenza vaccines is lower in patients with cancer than in healthy individuals [5, 6], we previously found that the humoral immunogenicity of influenza vaccination was higher in patients with cancer receiving ICIs compared with cytotoxic chemotherapy [7].
Although humoral responses, including seroprotection and seroconversion, have been widely used as markers of influenza vaccine immunogenicity, several studies have underscored the importance of influenza-specific T cells in eliminating influenza infection [8–10]. Nevertheless, the cell-mediated immune (CMI) responses following influenza vaccination in patients with cancer receiving ICIs remain largely unknown. Since treatment with ICIs reinvigorates exhausted or dysfunctional T cells, we hypothesized that the cellular immunogenicity of influenza vaccination is higher in patients receiving ICIs compared with cytotoxic chemotherapy. Therefore, we analyzed CD4+ and CD8+ T-cell responses after influenza vaccination in patients with cancer receiving ICIs or cytotoxic chemotherapy who were enrolled in our previous study [7].
MATERIALS AND METHODS
Study Design and Patients
This prospective cohort study involved adult patients with cancer receiving anti–PD-1 ICIs (Opdivo, Bristol-Myers Squibb; or Keytruda, Merck) or cytotoxic chemotherapy at 2 tertiary hospitals, as described previously [7]. All participants received an intramuscular seasonal quadrivalent influenza vaccine (GC Fluquadrivalent PFS [2018/2019], GC Pharma), which contained 15 μg purified viral antigen from the strains A/Singapore/GP1908/2015 IVR-180 (H1N1), A/Singapore/INFIMH-16–0019/2016 IVR-186 (H3N2), B/Phuket/3073/2013 (Yamagata), and B/Maryland/15/2016 NYMC BX-69A (Victoria). The vaccine was administered on day 1 of the chemotherapy cycle.
This study included some patients from our previous study [7]. Written informed consent was obtained from all patients in accordance with the Declaration of Helsinki. Patients with insufficient peripheral blood mononuclear cells (PBMCs) were excluded from the CMI analyses. The study was approved by the Institutional Review Board of Seoul National University Hospital (approval number H-1806-088-951).
Collection of PBMCs
Whole blood was collected in heparin-containing Vacutainer tubes (Becton Dickinson) pre- and postvaccination (days 21–35). PBMCs were separated within 3 hours after blood collection using Ficoll-Hypaque (1.077 g/mL; GE Healthcare Life Sciences). The PBMCs were then stored in liquid nitrogen in a serum-free cryopreservation medium (Cellbanker 2, Zenoaq) until used [11].
Antigen Stimulation and Fluorescence Staining
After thawing, 1 × 10⁶ PBMCs were immediately stimulated with 1 μg/mL hemagglutinins from the A/Singapore/GP1908/2015 IVR-180 (H1N1) or A/Singapore/INFIMH-16–0019/2016 IVR-186 (H3N2) strain (GC Pharma) or with medium alone for 24 hours. PBMCs stimulated with leukocyte activation cocktail (BD Biosciences) were used as a positive control. Antihuman CD28/CD49d for co-stimulation (clone L293/L25), Brilliant Blue 515–antihuman CD4 (clone RPA-T4), and phycoerythrin–antihuman CD107a (clone H4A3) antibodies were added concomitantly with the antigens. Cells were treated with BD GolgiStop (monensin) and BD GolgiPlug (brefeldin A) for the final 4 hours of the antigen stimulation. After stimulation, dead cells were stained with LIVE/DEAD (Thermo Fisher Scientific). Cells were permeabilized and incubated with Brilliant Violet (BV) 510–antihuman CD3 (clone CHT1), peridinin chlorophyll protein complex–antihuman CD8 (clone SK1), allophycocyanin–antihuman interleukin 2 (IL-2) (clone 5344.111), BV421–antihuman interleukin 4 (IL-4) (clone MP4-25D2), phycoerythrin–indotricarbocyanine (Cy7)–antihuman interferon gamma (IFN-γ) (clone B27), and BV605–antihuman CD69 (clone FN50) antibodies (all from BD Biosciences). BD Horizon Brilliant Stain Buffer (BD Biosciences) was added to each sample. Unstimulated cells and compensation beads (UltraComp eBeads, Thermo Fisher Scientific) were used in every experiment for compensation.
Flow Cytometry
Flow cytometry was performed using the FACSCanto (BD Biosciences) with a target event count of 300 000 cells. The flow cytometry results were analyzed using FlowJo software (version 10). Only activated (CD69+) cytokine-expressing T cells were evaluated. A representative gating strategy is shown in Figure 1. To account for nonspecific cytokine production, the percentage of cytokine production in the unstimulated specimens was subtracted from the percentage in the stimulated cells [12]. Similarly, to account for responses unrelated to the vaccine, the percentage of cytokine production in the prevaccination samples was subtracted from that in the postvaccination samples. The final values were regarded as vaccine-elicited immune responses. If there was no vaccine-elicited response, the specimen was given a value of 0.0001% (1 per 1 × 10⁶ CD4+ or CD8+ T cells) [12]. T cells expressing at least 2 of the cytokines/granules IL-2, IL-4, IFN-γ, and CD107a were determined using Boolean gating and were regarded as polyfunctional cells [12].
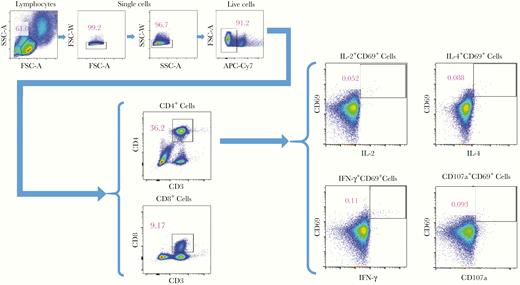
Representative flow cytometry gating strategy of a postvaccination sample. Abbreviations: APC-Cy7, allophycocyanin-indotricarbocyanine; FSC-A, forward scatter area; FSC-W, forward scatter width; IFN-γ, interferon gamma; IL-2, interleukin 2; IL-4, interleukin 4; SSC-A, side scatter area; SSC-W, side scatter width.
Outcomes
Vaccine-elicited cytokine or granule production by CD4+ or CD8+ T cells for each viral strain was compared between the ICI group and cytotoxic chemotherapy group. Fold changes in polyfunctional T cells from pre- and postvaccination were also compared between these 2 groups. The associations between clinical characteristics and an adequate CMI response (arbitrarily defined as an increase in polyfunctional cells postvaccination in both the H1N1 and H3N2 strains) [12], as well as the associations of vaccine-elicited responses with seroprotection (defined as a serum hemagglutination inhibition [HAI] antibody titer ≥1:40) and the HAI antibody titer, were also examined.
Statistical Analyses
The normality of the data distribution was determined using the Shapiro–Wilk test. Continuous variables are presented as mean ± standard deviation or median with interquartile range; statistical significance was determined using the Student t test or Mann–Whitney U test. Categorical variables are presented as proportions, and statistical significance was determined using the χ 2 test or Fisher exact test. The association between the CMI response and HAI antibody titer was evaluated using linear regression.
Two-sided P values <.05 were considered statistically significant. The Benjamini–Hochberg method was used to adjust for multiple comparisons for the vaccine-elicited responses among 4 cytokines and to calculate P values. All statistical analyses were performed in IBM SPSS Statistics for Windows software (version 22).
RESULTS
Patients
Among 46 and 90 patients from our previous study [7] who had received ICI or cytotoxic chemotherapy, 11 and 29 patients, respectively, were finally analyzed for CMI responses, after excluding 35 patients from the ICI group (PBMCs could not be collected, n = 19; insufficient amount of PBMCs, n = 16) and 61 patients from the cytotoxic chemotherapy group (PBMCs could not be collected, n = 32; insufficient amount of PBMCs, n = 29).
The baseline characteristics and humoral immunogenicity of the patients are shown in Table 1 and Supplementary Table 1 [7]. The cancer type, purpose of the treatment, and median treatment cycle number were significantly different between the 2 groups. White blood cell count and hemoglobin levels were significantly higher in the ICI group. The proportions of patients who had been vaccinated during the last influenza season or within the past 3 years were not different. Among the 11 patients in the ICI group, 7 (64%) received nivolumab (Opdivo) and 4 (36%) pembrolizumab (Keytruda). None of the patients had experienced laboratory-confirmed influenza during the 2018–2019 seasons.
Baseline Characteristics of Patients Included in This Study
| Characteristic | ICI (n = 11) | Cytotoxic CTx (n = 29) | P Value |
|---|---|---|---|
| Male | 9 (82) | 20 (69) | .694 |
| Age, y, mean ± SD | 65 ± 8 | 61 ± 9 | .190 |
| Age >60 y | 8 (73) | 16 (55) | .473 |
| ECOG performance status grade 0 | 9 (82) | 25 (86) | 1.000 |
| Comorbidity | |||
| Hypertension | 3 (27) | 5 (17) | .660 |
| Diabetes | 2 (18) | 6 (21) | 1.000 |
| Cancer type | .008 | ||
| Lung | 9 (82) | 9 (31) | |
| Colorectal | 0 (0) | 4 (14) | |
| Breast | 0 (0) | 4 (14) | |
| Lymphoma | 0 (0) | 4 (14) | |
| Head and neck | 0 (0) | 3 (10) | |
| Melanoma | 2 (18) | 0 (0) | |
| Othera | 0 (0) | 5 (17) | |
| Purpose of chemotherapy | .043 | ||
| Palliative | 11 (100) | 15 (52) | |
| Adjuvant | 0 (0) | 6 (21) | |
| Neoadjuvant | 0 (0) | 3 (10) | |
| Curative | 0 (0) | 5 (17) | |
| Chemotherapeutic agents | NA | ||
| Nivolumab | 7 (64) | … | |
| Pembrolizumab | 4 (36) | … | |
| Platinum-containing | … | 12 (41) | |
| Taxane-containing | … | 4 (14) | |
| Doxorubicin-containing | … | 3 (10) | |
| Other cytotoxic agentsb | … | 10 (35) | |
| Cycle of current chemotherapy | .452 | ||
| 1 | 0 (0) | 2 (7) | |
| 2 | 1 (9) | 5 (17) | |
| 3 | 1 (9) | 6 (21) | |
| ≥4 | 9 (82) | 16 (55) | |
| Median (IQR) | 12 (5–21) | 4 (3–5) | .029 |
| Laboratory values before vaccination, mean ± SD | |||
| WBC count, ×103/μL | 8.0 ± 1.6 | 5.4 ± 1.5 | <.001 |
| Absolute neutrophil count, ×103/μL | 4.8 ± 1.7 | 3.2 ± 1.4 | .005 |
| Absolute lymphocyte count, ×103/μL | 2.3 ± 0.7 | 1.4 ± 0.6 | <.001 |
| Hemoglobin, g/dL | 12.9 ± 1.8 | 11.7 ± 1.3 | .026 |
| Thrombocytes, ×103/μL | 264.8 ± 52.9 | 273.8 ± 96.9 | .773 |
| Previous influenza vaccination | |||
| Previous year (2017–2018 vaccine) | 4 (36) | 8 (28) | .704 |
| Within 3 y | 4 (36) | 8 (28) | .704 |
| Seroprotection | |||
| H1N1 | 8 (73) | 19 (66) | 1.000 |
| H3N2 | 8 (73) | 17 (59) | .486 |
| Seroconversion | |||
| H1N1 | 7 (64) | 12 (41) | .208 |
| H3N2 | 5 (46) | 10 (35) | .716 |
Data are presented as No. (%) unless otherwise indicated.
Abbreviations: CTx, chemotherapy; ECOG, Eastern Cooperative Oncology Group; ICI, immune checkpoint inhibitor; IQR, interquartile range; NA, not available; SD, standard deviation; WBC, white blood cell.
aOther type of cancers in the cytotoxic chemotherapy group included advanced gastric cancer (n = 2), esophageal cancer (n = 1), sarcoma (n = 1), and mesothelioma (n = 1).
bOther chemotherapeutic regimens included pemetrexed (n = 2), irinotecan-containing (n = 2), capecitabine (n = 2), methotrexate-containing (n = 2), gemcitabine (n = 1), and etoposide (n = 1).
Vaccine-Elicited CMI Responses
First, we examined the vaccine antigen-specific CMI responses based on the expression of cytokines and CD107a in T cells. The percentages of H1N1-specific CD4+ T cells expressing IL-4 and IFN-γ, as well as of H3N2-specific CD4+ T cells expressing IFN-γ, were significantly higher in the ICI group than in the cytotoxic chemotherapy group (Figure 2). The percentages of H1N1-specific CD8+ T cells expressing IL-2, IL-4, IFN-γ, and CD107a, as well as of H3N2-specific CD8+ T cells expressing CD107a, were also higher in patients receiving ICIs.
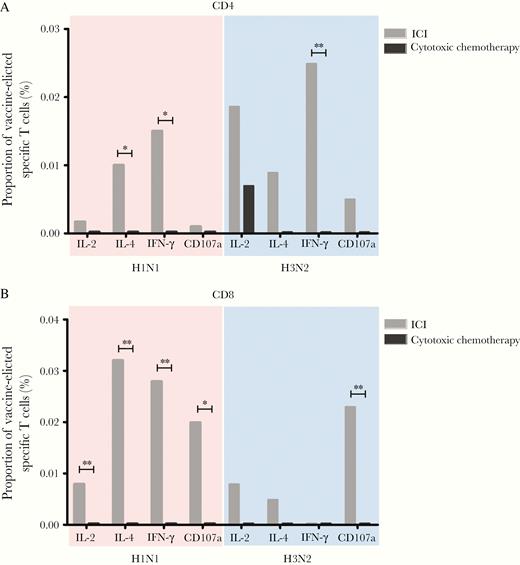
Median proportions of vaccine-elicited influenza-specific CD4+ (A) or CD8+ (B) T cells in the immune checkpoint inhibitor and cytotoxic chemotherapy groups. *P < .05, **P < .01. Abbreviations: ICI, immune checkpoint inhibitor; IFN-γ, interferon gamma; IL-2, interleukin 2; IL-4, interleukin 4.
The fold changes in the frequency of polyfunctional H3N2-specific CD4+ T cells (median, 156.0 vs 95.7; P = .005) and H3N2-specific CD8+ T cells (median, 155.0 vs 103.4; P = .044) from pre- to postvaccination were significantly higher in the ICI group compared with the cytotoxic chemotherapy group (Figure 3). Collectively, our results suggest that the vaccine-elicited CMI responses were more potent in the ICI group compared with the cytotoxic chemotherapy group.

Median of fold changes of polyfunctional T cells following influenza vaccination in the immune checkpoint inhibitor and the cytotoxic chemotherapy groups. Error bars indicate interquartile range. *P < .05, **P < .01. Abbreviation: ICI, immune checkpoint inhibitor.
Association Between ICI Therapy and an Adequate CMI Response
We also examined the association between the clinical characteristics and overall cellular response in terms of an adequate CMI response (Table 2). The numbers of patients who showed an adequate CMI response in CD4+ or CD8+ T cells were 6 (54.5%) and 6 (54.5%) in the ICI group and 5 (17.2%) and 6 (20.7%) in the cytotoxic chemotherapy group, respectively. Six patients (54.5%) in the ICI group and 5 (15.6%) in the cytotoxic chemotherapy group exhibited adequate CMI responses in both CD4+ and CD8+ T cells (P = .003).
Clinical Characteristics and Humoral Responses Related to the Adequate Cell-Mediated Immune Response for Both CD4+ and CD8+ T Cells
| Characteristic | Adequate CMI Response (n = 8) | Inadequate CMI Response (n = 32) | P Value |
|---|---|---|---|
| Male sex | 0 (0) | 11 (34.4) | .080 |
| Age, y, mean ± SD | 67.5 ± 4.5 | 60.9 ± 9.6 | .070 |
| Age >60 y | 7 (87.5) | 17 (53.1) | .114 |
| ICI (vs cytotoxic chemotherapy) | 6 (75.0) | 5 (15.6) | .003 |
| ECOG performance status grade 0 | 6 (75.0) | 28 (87.5) | .580 |
| Comorbidity | |||
| Hypertension | 2 (25.0) | 6 (18.8) | .650 |
| Diabetes | 2 (25.0) | 6 (18.8) | .650 |
| Lung cancer | 6 (75.0) | 12 (37.5) | .110 |
| Purpose of chemotherapy | .420 | ||
| Palliative | 7 (87.5) | 19 (59.4) | |
| Adjuvant | 1 (12.5) | 5 (15.6) | |
| Curative | 0 (0) | 5 (15.6) | |
| Neoadjuvant | 0 (0) | 3 (9.4) | |
| Cycle of current chemotherapy, median (IQR) | 17 (4–28) | 4 (3–6) | .028 |
| Previous influenza vaccination | |||
| Previous year (2017–2018 vaccine) | 5 (62.5) | 7 (21.9) | .039 |
| Within 3 y | 5 (62.5) | 7 (21.9) | .039 |
| Seroprotection | |||
| H1N1 | 7 (87.5) | 20 (62.5) | .236 |
| H3N2 | 7 (87.5) | 18 (56.3) | .219 |
| No. of seroprotective strains, median (IQR) | 4 (2–4) | 2 (1–4) | .138 |
| Seroconversion | |||
| H1N1 | 5 (62.5) | 14 (43.8) | .442 |
| H3N2 | 3 (37.5) | 12 (37.5) | 1.000 |
| No. of seroconverted strains, median (IQR) | 3 (0–4) | 1 (0–4) | .366 |
Data are presented as No. (%) unless otherwise indicated.
Abbreviations: CMI, cell-mediated immune; ECOG, Eastern Cooperative Oncology Group; ICI, immune checkpoint inhibitor; IQR, interquartile range; SD, standard deviation.
Relationship Between Vaccine-Elicited CMI Responses and Seroprotection
To determine the clinical implications of vaccine-elicited immune responses, we explored the association between the CMI and humoral responses elicited by the vaccination. Although the CMI response tended to be stronger in patients who achieved seroprotection, the difference was not statistically significant (Supplementary Tables 2 and 3). Furthermore, we found no significant association between the strength of the CMI response and the HAI antibody titer (Supplementary Table 4 and 5). Taken together, our findings suggested no significant association between vaccine-elicited CMI responses and humoral immune responses.
DISCUSSION
In this study, we evaluated the CMI responses following seasonal influenza vaccination in patients with cancer receiving ICIs or cytotoxic chemotherapy. We found that the vaccine-elicited cytokine or granule production, as well as the increase in polyfunctional T cells, tended to be higher in the ICI group than in the cytotoxic chemotherapy group. Moreover, an adequate CMI response was strongly associated with ICI administration. This is the first study to thoroughly explore vaccination-induced influenza-specific CMI responses in patients with cancer receiving ICIs. With the increasing use of ICIs in clinical practice for treating various cancer types, our findings highlight the necessity of annual influenza vaccination in ICI-treated patients.
Humoral immune responses have been widely used as a marker of immunogenicity after influenza vaccination. However, mounting evidence suggests the importance of T-cell–mediated immunity in the prevention or treatment of influenza infection. Wilkinson et al [9] conducted influenza challenge in 41 healthy volunteers who had no antibodies against influenza and showed that preexisting influenza-specific CD4+ T cells were associated with lower rates of virus shedding and severe illness. Sridhar et al [13] followed 342 healthy adults throughout pandemic influenza waves and found that preexisting IFN-γ +/IL-2–CD8+ T cells were inversely correlated with the symptom score. Herein, we report that the vaccine-elicited influenza-specific IFN-γ responses both in CD4+ and CD8+ T cells, which were proposed as potential correlates of protection in those aforementioned studies, were significantly higher in patients undergoing treatment with ICIs compared with cytotoxic chemotherapy.
Polyfunctional T cells, which express >1 effector cytokine or granule, are associated with delayed infection progression or with stronger protection postvaccination [14, 15]. In this study, we showed that the fold changes in polyfunctional T cells, especially H3N2-specific CD4+ and CD8+ T cells, pre- and postvaccination were also higher in the ICI group compared with the cytotoxic chemotherapy group. In addition, we defined an adequate CMI response as an increased number of polyfunctional T cells in both H1N1 and H3N2 strains, as described previously [12]. We found that an adequate CMI response was strongly associated with ICI administration; however, the clinical implications of the adequate CMI response in the prevention or treatment of influenza infection need further assessment.
A report on increased incidence of immune-related adverse events after influenza vaccination in patients with cancer receiving ICI raised safety concerns [16]. However, following studies reported no increase in incidence or severity of immune-related adverse events in those patients [7, 17, 18], although larger prospective studies are warranted. Therefore, considering together the results of the present study and the higher humoral responses in patients receiving ICIs than in those receiving cytotoxic agents [7], annual influenza vaccination should be recommended in ICI-treated patients.
Similar to previous reports in solid organ transplantation recipients [12, 19], we did not find a significant association between cellular and humoral immune responses. Moreover, the level of vaccine-elicited IL-4 production was not correlated with seroprotection or higher HAI antibody titers. Nevertheless, these associations should be evaluated further in a larger cohort. Moreover, the subcohort included in this study had a significantly lower seroprotection rate against H3N2 compared with the excluded patients (63% vs 82%; P = .013, data not shown). It is possible that the cellular response against H3N2 was underestimated in this study due to the characteristics of the study population.
This study had several limitations. First, although the vaccine-elicited cellular responses were more potent in the ICI group compared with the cytotoxic chemotherapy group in terms of correlates of protection, our observations do not confirm higher protection from influenza infection, since the cellular correlates of protection remain elusive. Second, our study suffered from potential bias, as many patients were excluded due to unavailable or insufficient amounts of PBMCs. Third, since the cytotoxic chemotherapy group included various types of cancer, its heterogeneity or different cancer types between the groups might influence our results. Finally, we did not analyze CMI responses following influenza vaccination in healthy individuals in this study, which limits further interpretation of our findings.
In conclusion, our results showed that CMI responses after seasonal influenza vaccination were more potent in patients with cancer receiving ICI compared with those receiving cytotoxic chemotherapy. Annual influenza vaccination should be strongly encouraged in cancer patients receiving ICIs.
Supplementary Data
Supplementary materials are available at The Journal of Infectious Diseases online. Consisting of data provided by the authors to benefit the reader, the posted materials are not copyedited and are the sole responsibility of the authors, so questions or comments should be addressed to the corresponding author.
Notes
Acknowledgments. We thank Su Jin Choi (Department of Internal Medicine, Seoul National University Hospital, Seoul, Republic of Korea), Mira Song, and Ji Hyun Sung (Flow Cytometry Core Facility, Seoul National University Hospital, Seoul, Republic of Korea) for their assistance with the flow cytometry analysis.
Financial support. This work was supported by GC Pharma and Seoul National University Hospital Research Fund (Seoul, Republic of Korea; number 04-2018-0520).
Potential conflicts of interest. B. K. has received grants from AstraZeneca, MSD, and ONO Pharmaceutical, and personal fees from AstraZeneca, MSD, and Genexine, outside the submitted work. All other authors report no potential conflicts of interest.
All authors have submitted the ICMJE Form for Disclosure of Potential Conflicts of Interest. Conflicts that the editors consider relevant to the content of the manuscript have been disclosed.
References
Author notes
C. K. K. and H.-R. K. contributed equally to this work.
W. B. P. and H. B. K. contributed equally to this work as senior authors.

