


Abstract
Increased pericardial adipose tissue is associated with higher risk of cardiovascular disease. We aimed to determine whether human immunodeficiency virus (HIV) status was independently associated with larger pericardial adipose tissue volume and to explore possible HIV-specific risk factors.
Persons with HIV (PWH) were recruited from the Copenhagen Comorbidity in HIV Infection (COCOMO) Study and matched 1:1 on age and sex to uninfected controls. Pericardial adipose tissue volume was measured using cardiac computed tomography.
A total of 587 PWH and 587 controls were included. Median age was 52 years, and 88% were male. Human immunodeficiency virus status was independently associated with 17 mL (95% confidence interval [CI], 10–23; P < .001) larger pericardial adipose tissue volume. Larger pericardial adipose tissue volume was associated with low CD4+ nadir and prior use of stavudine, didanosine, and indinavir. Among PWH without thymidine analogue or didanosine exposure, time since initiating combination antiretroviral treatment (per 5-year use) was associated with l6 mL (95% CI, −6 to −25; P = .002) lower pericardial adipose tissue volume.
Human immunodeficiency virus status was independently associated with larger pericardial adipose tissue volume. Severe immunodeficiency, stavudine, didanosine, and indinavir were associated with larger pericardial adipose tissue volume. Persons with HIV with prior exposure to these drugs may constitute a distinct cardiovascular risk population.
Persons with human immunodeficiency virus (PWH) have increased risk of atherosclerotic cardiovascular disease (CVD) compared with the uninfected population [1–3]. The etiology of atherosclerosis in human immunodeficiency virus (HIV) infection likely involves an intricate interplay between traditional risk factors (eg, dyslipidemia and smoking) and HIV-specific factors such as combination antiretroviral treatment (cART) and chronic inflammation [4]. Pericardial adipose tissue, delineated by the pericardial sac, is a local fat depot that surrounds the heart and in which the coronary arteries are imbedded. Pericardial adipose tissue, like visceral adipose tissue (VAT), is considered a risk factor for major adverse cardiovascular events in the general population and in PWH [5]. In particular, pericardial adipose tissue may directly contribute to progression of coronary atherosclerosis [6–9]. In the context of increased availability of cardiac computed tomography (CT), pericardial adipose tissue volume has been suggested as a marker of both local inflammation and overall cardiovascular risk [10]. Two smaller studies have suggested that PWH have a higher pericardial adipose tissue volume than uninfected controls [7, 11], and within PWH, pericardial adipose tissue has been associated with myocardial ischemia [11].
In this study, we aimed to determine and compare pericardial adipose tissue volume in PWH and uninfected controls and to investigate whether HIV was independently associated with pericardial adipose tissue volume. We explored possible associations between traditional CVD risk factors and pericardial adipose tissue volume, and we examined the relationship of HIV-specific factors including time since initiating cART and CD4+ T-cell count with pericardial adipose tissue volume. We hypothesized that HIV status is independently associated with larger pericardial adipose tissue volume.
METHODS
Study Design
Persons with HIV were recruited from the Copenhagen Comorbidity in HIV infection (COCOMO) study. The COCOMO study is a noninterventional, observational, longitudinal study with the aim of assessing non-acquired immune deficiency syndrome (AIDS) comorbidities in PWH. Detailed description of recruitment and study protocol is reported elsewhere [12]. The study participants were recruited from the outpatient clinics at Departments of Infectious Diseases at University Hospital Copenhagen Rigshospitalet and Hvidovre University Hospital. Inclusion criteria were seropositive HIV-1 test and age ≥18 years.
In the period between March 2015 and December 2016, 1099 PWH were included. Uninfected controls were recruited from the Copenhagen General Population Study (CGPS), an ongoing population study including more than 100 000 uninfected controls from the greater Copenhagen area [13]. Of all inhabitants living in the Greater Copenhagen area, 25% of the 20- to 40-year-olds and all of the inhabitants older than 40 years of age were invited to participate.
A random subset of CGPS participants ≥40 years of age and all COCOMO participants were offered a research cardiac CT angiography. The only exclusion criterion was serum-creatinine >100 µM. The COCOMO participants with evaluable CT scans and ≥40 years of age were included in the present study (N = 587). Uninfected participants from the CGPS, who had a research cardiac CT angiography performed in the same time span as COCOMO participants and were matched 1:1 with PWH by sex and age using propensity score matching. Ethical approval was acquired by the Regional Ethics Committee of Copenhagen (COCOMO, H-15017350; CGPS, H-KF-01-144/01). Oral and written informed consent was collected from all participants.
Data Collection, Clinical Assessment, and Definitions
Identical, structured questionnaires were used in COCOMO and CGPS to obtain information about ethnicity, smoking status, alcohol consumption, physical activity, and use of medications. Human immunodeficiency virus-related variables were obtained from patient records [12].
Trained clinical staff performed all physical examinations in COCOMO and CGPS using identical protocols. Body mass index (BMI) calculations were performed according to World Health Organization guidelines [14].
Blood pressure was measured on the left arm after 5 minutes rest with the subject in sitting position, using an automatic Digital Blood Pressure Monitor [15]. Nonfasting venous blood samples from both COCOMO and CGPS participants were collected and analyzed at the Department of Clinical Biochemistry, Herlev Hospital, Copenhagen [12].
Diabetes was defined as nonfasting venous plasma glucose ≥11.1 mmol/L or HbA1c ≥6.5% or treatment with antidiabetic drug for type II diabetes. Physical activity was grouped as sedentary (active less than 2 hours/week), mildly active (active 2–4 hours/week), or active (active more than 4 hours/week or strenuous exercise 2–4 hours a week).
According to Joint National Committee guidelines, hypertension was defined as antihypertensive treatment and/or as having ≥140 mmHg systolic and/or ≥90 mmHg diastolic blood pressure values [16]. We defined dyslipidemia as low-density lipoprotein (LDL) ≥4.16 mmol/L (160 mg/dL) and/or lipid-lowering treatment [17]. We calculated Framingham risk score for CVD (10-year risk) for participants younger than 75 [18].
Multidetector Computed Tomographic Angiography Image Acquisition
All CT scans were performed using a 320-slice CT scanner (Aquillion One; Canon Medical Systems, Ōtawara, Tochigi, Japan) as previously described [19] using the same scanning protocol. Tube voltages and currents were chosen based on participants’ BMI ranging between 100–120 kV and 280–500 mA, respectively. A cardioselective β 1-blocker (metoprolol 25–150 mg) was administered orally approximately 1 hour before the procedure if heart rate was above 55 beats per minute unless contraindicated. Participants with inhaler-treated asthma or chronic obstructive pulmonary disease received Ivabradin (Corlentor 15 mg, Servier; Copenhagen, Denmark). Intravenous contrast media (78 mL Visipaque 320 mg I/mL; GE Healthcare, Little Chalfont, Buckinghamshire, UK) was infused with a flow rate of 5 mL/second followed by a saline chaser. A fixed target protocol using 1 rotation acquisition with a prospective exposure window fixed at 350 ms centered at the 75% phase of the RR-cycle was used to restrict radiation dose [19]. Before image acquisition, 1 dose of oral spray nitroglycerin (Nitrolingual; Pohl Boskamp, Hohenlockstedt, Germany) was administered. An automatic raw data motion analysis tool (PhaseXact; Toshiba) was used to determine the optimal motion-free diastolic phase for reconstruction. Images were reconstructed with 0.5-mm slice thickness and increments of 0.25 mm.
Multidetector Computed Tomography Image Analysis
Pericardial adipose tissue volume was evaluated using Vitrea 6.3 (Vital Images Inc., Minnetonka, Minnesota, USA) software using a semi-automated algorithm as previously described [19]. In brief, we defined pericardial adipose tissue as all adipose tissue located between the myocardium and the parietal pericardium as done previously [19]. Within a region of interest with the left main coronary artery as the cranial boundary and the slice just below the posterior descending artery as the caudal boundary, the parietal pericardium was manually traced on axial images. Tracing was done on 7–12 slices, and the software automatically interpolated between each slide with the tracing marker. The borders of the chosen region of interest was visually reviewed, and the total volume of fat tissue within was automatically calculated by summation of voxels with density values within −190 to −70 Hounsfield units because this interval corresponds best with magnetic resonance measurements [19]. The volumes of the 3 main coronary arteries and clearly visible coronary branches were subtracted from the recorded pericardial adipose tissue volume.
Statistical Analysis
Normally distributed continuous variables were reported as mean and standard deviation (SD), whereas nonnormally distributed continuous variables were reported as median and interquartile range. Categorical variables were reported as percentage and frequency.
Different groups were compared using t test for normally distributed data and Mann-Whitney U test for nonnormally distributed continuous data. For categorical data, χ 2 tests were used.
Multivariable linear regression analyses were performed to test our hypotheses. Separate predefined models were fitted to test for associations between independent variables and pericardial adipose tissue volume. Model 1 was adjusted for BMI (continuous), age, and sex. Model 2 consisted of known CVD risk factors: age, sex, BMI, hypertension, smoking (current, former, never smoker), dyslipidemia, and diabetes. Model 3 was additionally adjusted for physical activity (active, mildly active, sedentary). Within PWH, the associations between pericardial adipose tissue volume and HIV-related factors (nadir CD4+ T-cell count; current CD4+ T-cell count; history of AIDS; duration of HIV infection; time since initiating cART; hepatitis C virus; prior exposure to azidothymidine [AZT], stavudine [d4T], and didanosine [ddI] therapy) were added to model 3 one at a time. Exposure to the drugs AZT, d4T, and ddI were considered both separately and as a composite variable, “thymidine analogues and/or ddI.” We further explored whether introducing prior use of indinavir (IDV) therapy would change the association between AZT, d4T, and/or ddI (considered separately and together) and pericardial adipose tissue (model 3 + IDV). We prespecified an interaction analysis between cART duration and thymidine analogue/ddI exposure on pericardial adipose tissue volume. Statistical analyses were conducted in R version 3.4.1.
RESULTS
Characteristics of the Study Population
A total of 587 PWH and 587 age- and sex-matched uninfected controls were included. Characteristics of the study population are shown in Table 1. Most participants were males (88%) and the median age was 52 years. A higher proportion of PWH were current smokers and reported sedentary lifestyle; however, median BMI was lower in PWH than in controls (P < .001) (Table 1). Among PWH, 579 (99%) were on cART and 560 (95%) had undetectable viral replication. Azidothymidine was used by 321 (54%) participants, d4T was used by 92 (16%), ddI was used by 95 (16%), and IDV was used by 119 (20%) of the 587 PWH. Three hundred thirty-six (57%) participants had exposure to thymidine analogues and/or ddI, 2 (0.6%) of which were current users (Table 2).
Characteristics of Study Populationa
| Characteristics | PWH (n = 587) | Controls (n = 587) |
|---|---|---|
| Age, years, median (IQR) | 52 (47–60) | 52 (47–60) |
| Sex, male, n (%) | 518 (88) | 518 (88) |
| Body mass index (BMI), kg/m2, mean (SD) | 24.8 (3.5) | 26.6 (3.5) |
| Smoking Status, n (%) | ||
| Never smoker | 196 (34) | 261 (45) |
| Former smoker | 222 (39) | 240 (41) |
| Current smoker | 157 (27) | 82 (14) |
| Physical Activity, n (%) | ||
| Active | 317 (54) | 327 (56) |
| Mildly active | 193 (33) | 222 (38) |
| Sedentary | 48 (8.2) | 36 (6.1) |
| Hypertension, n (%) | 272 (46) | 368 (63) |
| Diabetes, n (%) | 18 (3.1) | 18 (3.1) |
| Dyslipidemia, n (%) | 128 (22) | 191 (33) |
| Lipid-lowering treatment, n (%) | 79 (13) | 64 (11) |
| LDL, mmol/L, mean (SD) | 2.9 (1.0) | 3.5 (.9) |
| Framingham risk score, median (IQR) | 12.8 (7.1–21.5) | 13.2 (8.2–23.1) |
Abbreviations: BMI, body mass index; HIV, human immunodeficiency virus; IQR, interquartile range; LDL, low-density lipoprotein; PWH, persons with HIV; SD, standard deviation.
aHypertension was defined as systolic blood pressure ≥140 mmHg and/or diastolic blood pressure ≥90 mmHg and/or antihypertensive treatment. Dyslipidemia was defined as LDL ≥4.16 mmol/L (160 mg/dL) and/or lipid-lowering treatment. Diabetes was defined as nonfasting venous plasma glucose ≥11.1 mmol/L or HbA1c ≥6.5% or treatment with antidiabetic drug for type II diabetes. Physical activity was grouped as sedentary if active less than 2 hours/week, mildly active if active 2–4 hours/week, or active if active more than 4 hours/week or strenuous exercise 2–4 hours a week. If numbers and percentages do not add up, it is due to missing values. Framingham risk score was calculated for those 40–74 years of age.
Characteristics Related to HIV Infectiona
| Characteristics | Persons With HIV (n = 587) | |
|---|---|---|
| HIV duration, years, mean (SD) | 15.4 (8.9) | |
| Transmission Mode, n (%) | ||
| MSM | 424 (72) | |
| Intravenous drug user | 5 (.9) | |
| Heterosexual | 124 (21) | |
| Other | 12 (2.0) | |
| Current CD4+ (cells/µL), mean (SD) | 708 (282) | |
| <200 | 8 (1.4) | |
| 200–349 | 40 (6.8) | |
| 350–500 | 87 (15) | |
| >500 | 446 (76) | |
| CD4+ nadir <200 (cells/µL), n (%) | 253 (43) | |
| HIV RNA <50 (copies/mL), n (%) | 560 (95.4) | |
| History of AIDS, n (%) | 112 (19) | |
| Positive hepatitis C virus-RNA, n (%) | 33 (5.6) | |
| Using cART, n (%) | 579 (98.6) | |
| Time since initiating cART, years, mean (SD) | 11.9 (6.6) | |
| Prior Treatment With | ||
| • Azidothymidine, n (%) | 321 (54) | |
| Duration, Years (IQR) | 3.5 (1.3–6.4) | |
| • Stavudine, n (%) | 92 (16) | |
| Duration, Years (IQR) | 2.0 (3.8–5.8) | |
| • Didanosine, n (%) | 95 (16) | |
| Duration, Years (IQR) | 1.0 (3.2–5.8) | |
| • Indinavir, n (%) | 119 (20) | |
| Duration, Years (IQR) | 1.8 (3.9–5.4) |
Abbreviations: AIDS, acquired immunodeficiency syndrome; cART, combination antiretroviral therapy; HIV, human immunodeficiency virus; IQR, interquartile range; MSM, men who have sex with men; RNA, ribonucleic acid; SD, standard deviation.
aIf numbers and percentages do not add up, it is due to missing values. Duration of treatment is only for persons with HIV with exposure for drug in question.
Pericardial Adipose Tissue Volume in Persons With Human Immunodeficiency Virus and Uninfected Controls
Mean pericardial adipose tissue volume was similar in PWH and uninfected controls: 192 (standard deviation [SD] = 62) mL vs 190 (SD = 66) mL (P = .546). Stratified by BMI category, the median pericardial adipose tissue volume was larger in PWH with normal BMI (165 mL) than controls with normal BMI (149 mL) (P < .001), but there were no differences in pericardial adipose tissue volume among overweight or obese individuals (P = .153 and P = .603, respectively) (Figure 1A). Male sex, BMI, hypertension, diabetes, smoking status, dyslipidemia, and sedentary lifestyle were all associated with larger pericardial adipose tissue volume in unadjusted analyses (all P < .05) (Table 2). In analysis adjusting for BMI, age, and sex (model 1), HIV status was independently associated with 15 mL larger pericardial adipose tissue volume (95% confidence interval [CI], 8–21; P < .001). After further adjusting for hypertension, diabetes, dyslipidemia, and smoking (model 2), HIV remained associated with 16 (95% CI, 10–23) mL larger pericardial adipose tissue volume (P < .001). Additional adjustment for physical activity (model 3) did not change this estimate (17 mL; 95% CI, 10–23). In addition to HIV, age, male sex, BMI, sedentary lifestyle, dyslipidemia, and smoking (current and former) were also independently associated with larger pericardial adipose tissue volume (Table 2). Pericardial adipose tissue volume was not independently associated with hypertension or diabetes.
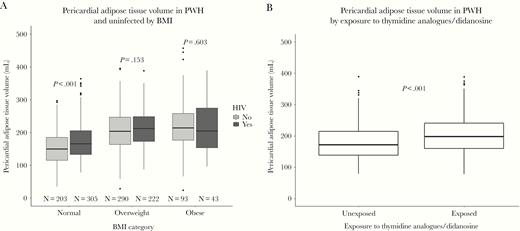
Boxplots of pericardial adipose tissue volume. (A) Pericardial adipose tissue volume (mL) in persons with human immunodeficiency virus (HIV) and uninfected controls stratified by body mass index categories according to the World Health Organization (normal weight, 18.5–24.9 kg/m2; overweight, 25–29.9 kg/m2; obese, ≥30 kg/m2). (B) Pericardial adipose tissue volume (mL) in persons with HIV stratified according to exposure to thymidine analogues and/or didanosine. P values were calculated by Wilcoxon-Mann-Whitney tests. 14 underweight PWH were not included in the figure. There were no underweight controls. BMI, body mass index; PWH, persons with HIV.
Human Immunodeficiency Virus-Related Factors Associated With Pericardial Adipose Tissue Volume
Pericardial adipose tissue volume was 21 (95% CI, −31 to −11) mL larger in PWH with thymidine analogue/ddI exposure compared with PWH without exposure (P < .001) (Figure 1B), whereas BMI was similar (P = .663). In adjusted analyses of PWH only, use of AZT, d4T, and/or ddI (considered together or separately) was associated with larger pericardial adipose tissue (Table 4). Prior exposure to IDV was associated with 19.6 (95% CI, 8.6– 30.6) mL larger pericardial adipose tissue volume, and low nadir CD4+ T-cell count (<200 cells/μL) was associated with 10 (95% CI, 1–19) mL larger pericardial adipose tissue volume (P = .031), but there was no association between current CD4+ count and pericardial adipose tissue volume (P = .381). Longer duration of exposure to AZT, d4T, ddI, and IDV was not associated with larger pericardial adipose tissue volume (Table 4). Further adjustment for IDV attenuated the association between pericardial adipose tissue volume and thymidine analogues and/or ddI and between pericardial adipose tissue and AZT, ddI, and d4T considered separately (Table 4). In a sensitivity analysis with waist-to-hip ratio included in the model, d4T was associated with 10.8 (95% CI, −.9 to 22.6) mL and ddI with 8.5 (95% CI, −3.1 to 20.1) mL larger pericardial adipose tissue volume, whereas AZT was no longer associated with pericardial adipose tissue volume (P = .454). Time with HIV infection and time since initiating cART treatment were not independently associated with pericardial adipose tissue volume (P = .062 and P = .092, respectively). However, exposure to thymidine analogues and/or ddI modified the association between time since initiating cART treatment and pericardial adipose tissue volume (pinteraction = .002). Thus, among PWH with exposure to thymidine analogues and/or ddI, time since initiating cART treatment (per 5-year use) was borderline associated with 8 (95% CI, −0.2 to 15) mL (P = .058) larger pericardial adipose tissue volume, whereas time since initiating cART treatment was associated with l6 (95% CI, −6 to −25) mL lower pericardial adipose tissue volume among those without exposure (P = .002). In adjusted analysis comparing PWH without thymidine analogue/ddI exposure to controls, HIV status was borderline associated with 9 (95% CI, 0.1–18) mL larger pericardial adipose tissue volume (P = .048), whereas PWH with thymidine analogue/ddI exposure had a 22 (95% CI, 14–30) mL larger pericardial adipose tissue volume (P < .001).
Antiretroviral Drugs and Pericardial Adipose Tissue Volume in Persons With HIVa
| Variable | Adjustedb β (95% CI) | P | Adjustedc β (95% CI) | P |
|---|---|---|---|---|
| Years using cART, per 5 years of use | ||||
| Exposed to thymidine analogues/ddI | 7.6 (−.2 to 15.4) | .058 | 3.9 (−4.7 to 12.5) | .374 |
| Not exposed to thymidine analogues/ddI | −15.5 (−25.0 to −6.1) | .002 | −15.5 (−25.1 to −6.0) | .002 |
| Thymidine analogues/ddI, yes vs no | 11.4 (2.1–20.8) | .017 | 6.1 (−4.0 to 16.1) | .237 |
| Azidothymidine, yes vs no | 10.7 (1.4–20.0) | .025 | 5.7 (−4.3 to 15.6) | .265 |
| Azidothymidine per 5 years of use | 2.6 (−6.4 to 11.5) | .576 | 1.3 (−7.7 to 10.2) | .781 |
| Stavudine, yes vs no | 23.0 (10.9–35.1) | <.001 | 18.4 (6.2–30.7) | .003 |
| Stavudine per 5 years of use | −6.2 (−6.3 to 14.0) | .549 | −3.7 (−23.8 to 16.4) | .718 |
| Didanosine, yes vs no | 21.4 (9.7–33.0) | <.001 | 16.4 (4.2–28.6) | .009 |
| Didanosine per 5 years of use | −10.7 (−24.2 to 2.8) | .121 | −10.7 (−24.1 to 2.7) | .118 |
| Indinavir, yes vs no | 19.6 (8.6–30.6) | <.001 | - | - |
| Indinavir per 5 years of use | −9.5 (−25.6 to 6.6) | .249 | - | - |
Abbreviations: cART, combination antiretroviral therapy; CI, confidence interval; ddI, didanosine; HIV, human immunodeficiency virus; thymidine analogues, azidothymidine/stavudine.
aData are shown as β coefficients (95% CI) of pericardial adipose tissue volume in milliliters. Variables were added to the model one at a time.
bMultivariable linear regression models were adjusted for age, sex, body mass index, hypertension, diabetes, dyslipidemia, smoking, and physical activity.
cAdditionally adjusted for indinavir.
DISCUSSION
Human immunodeficiency virus was independently associated with larger pericardial adipose tissue volume. In PWH, prior or current severe immunodeficiency (low nadir CD4+ T cell <200 cells/μL) was associated with larger pericardial adipose tissue volume. It is interesting to note that thymidine analogue/ddI exposure strongly modified the association between time since initiating cART and pericardial adipose tissue volume with larger volume per 5-year use among exposed and lower volume in the unexposed. However, even in PWH without exposure to thymidine analogue/ddI, the pericardial adipose tissue volume was larger than in controls. Larger pericardial adipose tissue volume is a predictor of incident CVD independent of inflammation, coronary artery calcification, and cardiometabolic risk factors in uninfected individuals [6, 9, 20].
In the present study, there was no difference in mean unadjusted pericardial adipose tissue volume between PWH and uninfected controls, but HIV status was independently associated with larger pericardial adipose tissue volume after adjusting for age, sex, and BMI, and the effect estimate changed little with further adjustment for traditional CVD risk factors. Our findings suggest that pericardial adipose tissue volume accumulation is a distinct feature in PWH, even in a predominantly virologically suppressed population. Similar results were reported in male participants of the Multicenter AIDS Cohort Study (MACS) [21]. Of note, the MACS study reported epicardial adipose tissue volumes, whereas we chose to follow the methodology of Framingham and The Multi-Ethnic Study of Atherosclerosis for describing the layer of fat within the pericardial sac. Epicardial adipose tissue is the part of pericardial adipose tissue that lies between the visceral pericardium and the myocardium; however, although the vast majority of pericardial adipose tissue, as defined by Framingham, consists of epicardial adipose tissue, the 2 compartments are not fully identical. Epicardial adipose tissue volume has previously been reported to be higher in PWH compared with uninfected controls [21, 22] and has been associated with duration of cART use, systemic inflammatory biomarkers, and cardiovascular events in PWH [21–23]. However, studies have been conducted in distinct populations (eg, homosexual men), and findings are not consistent in all populations of PWH [24].
Regardless of HIV status and in accordance with previous literature [25, 26], we found that age and male sex were strongly associated with increased pericardial adipose tissue volume. As expected, modifiable risk factors, such as smoking, physical inactivity, and dyslipidemia, were also independently associated with larger pericardial adipose tissue volume. In those with normal BMI, pericardial adipose tissue volume was 22 mL larger in PWH compared with controls, and HIV status was only associated with pericardial adipose tissue volume after adjusting for BMI. In contrast, there was no difference in pericardial adipose tissue volume between PWH and controls who were overweight or obese. We speculate that the lack of association between HIV infection and pericardial adipose tissue before adjustment is due to differences in BMI between PWH and uninfected controls. This suggests that for a given BMI, PWH are more prone to store adipose tissue in ectopic fat depots than uninfected persons are, but the impact of HIV is less pronounced in those with larger fat depots. The exact pathogenesis leading to accumulation of pericardial adipose tissue in PWH is unclear, but larger pericardial adipose tissue volume has been associated with insulin resistance, increased levels of interleukin-6, soluble CD163, as well as longer cART duration in PWH [7, 27]. The mechanisms may be the same as those involved in fat accumulation in lipodystrophy, as evidenced by the fact that including waist-to-hip ratio in the model attenuated the association between AZT, d4T, and ddI and pericardial adipose tissue volume. Epicardial adipose tissue volume has also been associated with cART duration and furthermore with current CD4+ T-cell count [26, 27]. We found that nadir CD4+ T-cell count below 200 cells/µL, indicating prior or current severe immunodeficiency, was independently associated with larger pericardial adipose tissue volume in PWH. Low nadir CD4+ nadir is known to be associated with increased levels of chronic immune activation and inflammation [28]. Inflammation, in turn, is known to be associated with adipose tissue accumulation through its detrimental effects on adipocyte metabolism and maturation in both VAT and pericardial adipose tissue [29]. More important, time since initiating cART was associated with markedly lower pericardial adipose tissue volume among PWH not exposed to thymidine analogue/ddI compared with PWH with exposure. In the unexposed, the effect of 5 years of cART use was comparable to a 2-unit decrease in BMI. This could be due to a positive modulatory effect on systemic inflammation [30]. The effect of time since initiating cART was opposite among those with thymidine analogue/ddI exposure, highlighting that although contemporary cART regimes have improved in terms of cardiovascular safety, the adverse effects of older antiretroviral drugs may still be manifest today among otherwise well treated PWH [31, 32]. These effects may not be limited to thymidine analogue/ddI exposure, and IDV, an early protease inhibitor known to induce lipodystrophy in PWH [33], was also independently associated with larger pericardial adipose tissue volume. The association between AZT, d4T, and ddI and pericardial adipose tissue was larger for d4T and ddI, and the estimates for these drugs were less affected by adjusting for IDV, compared with AZT, which suggest that d4T and ddI may be more toxic to adipocytes than AZT. The association between AZT and pericardial adipose tissue may be entirely explained by prior IDV exposure among those persons who have used AZT. However, the association between HIV status and pericardial adipose tissue volume was not fully explained by thymidine analogue/ddI exposure, and PWH without exposure had larger pericardial adipose tissue volume than uninfected controls, when adjusting for BMI. Taken together, the association between severe immunodeficiency and larger pericardial adipose tissue volume, and that longer time using cART seems to be beneficial among those not exposed to first-generation thymidine analogues, indicates that early cART initiation should be enforced as suggested by other studies [34, 35] and recommended by current treatment guidelines [36, 37].
Our study has several limitations. Because of the cross-sectional study design, we were not able to assess causality in our analyses. Furthermore, participants were mainly Caucasian males and PWH were predominately well treated with respect to HIV. Thus, results may not be generalizable to other populations. Moreover, one should note that contrast-enhanced scans are not needed for measuring pericardial adipose tissue volume. However, contrast-enhanced scans have good concordance with cardiac magnetic resonance imaging, and it is the preferred method at the local cardiac CT unit, which has experience with this method [19]. For this reason, we used cardiac CT angiography scans for this study. We did not have information on previous CVD, and Framingham risk scores should be interpreted accordingly. Major strengths of our study were the inclusion of a large cohort of PWH and a well characterized control population from the same geographical area. Because all demographic, physical, and image information was collected using identical methods/protocols and equipment by trained medical staff, potential bias from these causes was minimized.
CONCLUSIONS
Human immunodeficiency virus status was independently associated with larger pericardial adipose tissue volume. Among PWH, severe immunodeficiency and previous treatment with d4T, ddI, and IDV were associated with larger pericardial adipose tissue volume. Among PWH without exposure to thymidine analogues, time since initiating cART was associated with lower pericardial adipose tissue volume. When gauging cardiovascular risk, PWH with prior exposure to d4T and ddI may constitute a distinct risk population.
Uni- and Multivariable Analysis of Risk Factors Associated With Pericardial Adipose Tissue Volume in Controls and PWH
| Variable | Unadjusted β (95% CI) | P | Adjusteda β (95% CI) | P |
|---|---|---|---|---|
| HIV, yes vs no | 2.3 (−5.1 to 9.6) | .546 | 16.7 (10.0–23.4) | <.001 |
| Sex, male vs female | 55.5 (44.5–66.5) | <.001 | 44.5 (34.4–54.6) | <.001 |
| Age, per 10 years | 21.5 (17.4–25.5) | <.001 | 15.2 (11.3–19.0) | <.001 |
| BMI, per unit | 6.8 (5.9–7.7) | <.001 | 6.8 (5.8–7.7) | <.001 |
| Hypertension, yes vs no | 26.6 (19.3–33.9) | <.001 | 5.6 (−1.3 to 12.4) | .113 |
| Diabetes, yes vs no | 23.5 (2.2–44.8) | .031 | .1 (−18.1 to 18.2) | .994 |
| Smoking Statusb | ||||
| Current smoker | 13.4 (3.4–23.3) | .008 | 13.1 (4.1–22.1) | .005 |
| Former smoker | 21.3 (13.1–29.5) | <.001 | 13.2 (6.0–20.4) | <.001 |
| Dyslipidemia, yes vs no | 31.8 (23.6–40.0) | <.001 | 14.8 (7.6–22.1) | <.001 |
| Sedentary lifestylec | 30.7 (16.3–45.1) | <.001 | 21.4 (8.8–34.0) | <.001 |
Abbreviations: BMI, body mass index; CI, confidence interval; HIV, human immunodeficiency virus; PWH, persons with HIV.
aLinear regression adjusted for age, sex, BMI, hypertension, diabetes, dyslipidemia, smoking, and physical activity.
bReference is “never smoker”.
cDefined as >2 hours/week active, reference is “active”.
Notes
Presented in part: 17th European AIDS Conference, 7 November 2019, Basel, Switzerland.
Acknowledgments. We extend our gratitude to all participants of the Copenhagen Comorbidity in HIV Infection Study and Copenhagen General Population Study and to the nurses and staff of the Department of Infectious Diseases and Department of Radiology at Rigshospitalet, Copenhagen.
Financial support. This work was funded by The Danish Heart Foundation and the Novo Nordic Foundation.
Potential conflicts of interest. A. D. K. has received a grant from The Danish Heart Foundation and a traveling grant from Gilead. A.-M. L. reports the following: traveling grants from Gilead and MSD and advisory board activity for Gilead and GSK/ViiV. S. D. N. reports the following: unrestricted research grants from Novo Nordisk Foundation, Lundbeck Foundation, Augustinus Foundation, and Rigshospitalet Research Council; traveling grants from Gilead, MSD, BMS, and GSK/ViiV; and advisory board activity for Gilead and GSK/ViiV. All authors have submitted the ICMJE Form for Disclosure of Potential Conflicts of Interest. Conflicts that the editors consider relevant to the content of the manuscript have been disclosed.
References
Author notes
A. D. K., L. K.-D., and N. I. D. B. contributed equally to this work.

