


Abstract
Endemic Burkitt lymphoma (eBL) is associated with Epstein-Barr virus (EBV) and Plasmodium falciparum malaria coinfections. However, the role of Kaposi sarcoma-associated herpesvirus (KSHV), also endemic in Africa, has not been evaluated as a cofactor in eBL pathogenesis.
Multiplexed seroprofiles for EBV, malaria, and KSHV were generated for 266 eBL patients, 78 non-eBL cancers, and 202 healthy children. KSHV and EBV loads were quantified by PCR.
KSHV seroprevalence did not differ by study group but was associated with age. Seropositivity, defined by K8.1/LANA or in combination with 5 other KSHV antigens (ORF59, ORF65, ORF61, ORF38, and K5) was associated with antimalarial antibody levels to AMA1 (odds ratio [OR], 2.41, P < .001; OR, 2.07, P < .001) and MSP1 (OR, 2.41, P = .0006; OR, 5.78, P < .001), respectively. KSHV loads did not correlate with antibody levels nor differ across groups but were significantly lower in children with detectable EBV viremia (P = .014).
Although KSHV-EBV dual infection does not increase eBL risk, EBV appears to suppress reactivation of KSHV while malaria exposure is associated with KSHV infection and/or reactivation. Both EBV and malaria should, therefore, be considered as potential effect modifiers for KSHV-associated cancers in sub-Saharan Africa.
Oncogenic viruses are associated with 15%–25% of human cancers worldwide and multiple studies have defined their role in host cell transformation and malignancy [1]. Human gammaherpesviruses including Epstein-Barr virus (EBV, human herpesvirus 4) and Kaposi sarcoma-associated herpesvirus (KSHV, human herpesvirus 8) are biphasic viruses that establish lifelong latency after primary infection. KSHV, originally discovered in Kaposi sarcoma (KS) [2], is today associated with 1% of all human tumors or B-cell hyperplasia, including primary effusion lymphoma [3], a variant of multicentric Castleman disease [4], and KSHV inflammatory cytokine syndrome [5]. Serological studies have revealed widespread prevalence of KSHV in Africa, with 30%–60% [6–8] seropositivity. EBV, first discovered in 1964 in an African endemic Burkitt lymphoma (eBL) tumor [9], has since been associated with other human cancers including diffuse large B-cell lymphoma [10], classical Hodgkin lymphoma [11], and nasopharyngeal and gastric carcinoma [12]. Unlike KSHV, EBV has a high prevalence outside of Africa, with over 90% of adults being seropositive worldwide [13]. In Africa, primary EBV and KSHV infections occurs early in life, usually by the age of 1 or 2 years [14, 15]. While multiple studies have described distinct oncogenic capabilities of KSHV and EBV, as well as evidence of their cooperation [16, 17], the impact of KSHV infection on eBL oncogenesis, and survival outcomes has not been addressed in these high-risk pediatric populations.
Pathogen coinfection is important to deconvolute as their interactions within the human host can impact infection dynamics including transmission, immunity, and associated diseases [18]. Indeed, Plasmodium falciparum and EBV coinfection has been linked to a higher incidence of eBL [19]. For EBV and KSHV coinfection, early studies on primary effusion lymphoma containing both viruses observed that one or the other virus is reactivated in response to specific, but different, stimuli [20]. A model has been proposed for KSHV reactivation with continued EBV latency in dually infected B cells in which the 2 viruses can suppress the lytic reactivation of one another through physical interaction of EBV’s viral transactivator (Zta/ZEBRA) and KSHV’s replication and transcription activator (RTA) [21]. However, KSHV has also been reported to activate lytic EBV infection, whereas EBV has been found to support KSHV persistence in mice with reconstituted human immune system components [16, 17, 22, 23]. While the role of KSHV and EBV dual infections has been studied in KSHV-associated malignancies, little is known about the interactions of these two herpesviruses in eBL, the quintessential EBV-associated B-cell lymphoma. Previous or ongoing exposure to KSHV in endemic settings, accompanied by recurrent malaria parasite infections, can create an environment for molecular interactions between P. falciparum malaria, EBV, and KSHV, which could impact the risk or course of disease [18]. Thus, we conducted a KSHV serosurvey in western Kenya among pathologically confirmed eBL patients compared to children with non-BL cancers and healthy controls. We further assessed the impact of EBV and KSHV loads within these study populations.
METHODS
Study Participants and Ethical Approvals
Children with solid tumors suspected to be eBL were enrolled at the Jaramogi Oginga Odinga Teaching and Referral Hospital and Moi Teaching and Referral Hospital (MTRH) in western Kenya. Diagnostic tests included Giemsa/May-Grünwald staining, cytopathology, flow cytometry, and transcriptome and mutational profiling [24]. Thus, we included 266 confirmed eBL cases and 78 children diagnosed with other cancers (ie, hepatoblastoma, acute myeloid leukemia, non-Hodgkin and Hodgkin lymphomas, nephroblastoma, and rhabdomyosarcoma) in our analysis. One case of KS was excluded and all participants were human immunodeficiency virus (HIV) uninfected at the time of sample collection. Peripheral blood was collected prior to initiation of chemotherapy for eBL and non-BL cancer patients. The healthy controls with no history of cancer were recruited from Kisumu County, a region with high malaria transmission, early age of primary EBV infection, high EBV load, and high incidence of eBL [25, 26]. Written informed consent was obtained from parents of minor study participants. Ethical approval was obtained from the Institutional Review Board at the University of Massachusetts Medical School, the Scientific and Ethics Review Unit at the Kenya Medical Research Institute, and the Institutional Research and Ethics Committee at MTRH and Moi University.
Multiplexed Bead Assay
We used 7 KSHV recombinant open reading frames (ORFs) that have been previously validated to elicit antibody responses that differentiate KSHV-infected individuals with KSHV malignancies from healthy uninfected controls [27]: ORF59, ORF73/latency-associated nuclear antigen (LANA), ORF65, ORF61, ORF38, K8.1, and K5. We refer to this as the 7Agn-KSHV assay in this article. EBV serostatus was determined using viral capsid antigen (VCA) and EBV nuclear antigen-1 (EBNA1) antigens, and malaria exposure using apical membrane antigen-1 (AMA1) and merozoite surface protein-1 (MSP1) recombinant proteins. Bio-plex COOH carboxylated nonmagnetic beads (1.25 × 10⁷ microspheres/mL) were coupled to corresponding antigens at 100 µg/500 µL based on manufacturer’s protocol, and antibody levels for KSHV, EBV, and malaria measured by BioPlex 200 Multianalyte Analyzer (Bio-Rad Laboratories) as previously described [28].
Interassay Variability and Seropositivity Cutoff
To determine inter/intraassay variability, negative and positive control samples were included on each plate in duplicates. A comparison of the mean and standard deviation of duplicates within and between/across plates was used to determine the percent relative standard deviation (%RSD). The intra/interassay %RSD ranged from 2% to 15% for KSHV antigens and 3% to 16% for both EBV and P. falciparum antigens. We used the receiver operating characteristic curve analysis [29] to determine individual seropositivity cutoffs for each of the 7 KSHV antigens using the median fluorescence intensities (MFI) of 11 Africans and 15 North Americans with high and low KSHV infection risk levels, respectively. Antibody levels to EBV (VCA and EBNA1) and P. falciparum (AMA1 and MSP1) were expressed as MFI and stratified as low, medium, and high based on percentiles.
KSHV and EBV Load
Genomic DNA was extracted from ethylenediaminetetraacetic acid (EDTA) anticoagulated whole-blood samples using the Qiagen DNAeasy Kit (QIAGEN Sciences). To ensure high sensitivity and reproducibility [30], we used droplet digital polymerase chain reaction (ddPCR) to measure KSHV and EBV loads. For KSHV, ORF26 gene and human β-actin gene were used to quantify KSHV copies relative to human DNA, with previously described primers and probes [31, 32]. To determine EBV load, we amplified EBV BALF5 and human β-actin gene. The upstream and downstream EBV primers were 5′-CACCTTTCAGACGTCCAGTT-3′ and 5′-AGTCCACACTCTTAGGACCA-3′, respectively, while the probe sequence was 5′-CCACCAAACCTGGTGAGGAAGCAT-3′. Both duplex ddPCR reactions were prepared in a total volume of 20 μL per reaction, which contained 10 μL of ddPCR Supermix for probes (No UTP) (Bio-Rad Laboratories), and 2 sets of primers and probes (0.9 μM of primers and 0.25 μM of probes). The BioRad Automated Droplet Generator (Bio-Rad Laboratories) was used for consistent droplet generation. Generated droplets were transferred to a PCR plate, amplified using a Bio-Rad Thermal Cycler, and the number of positive and negative droplets counted by the Bio-Rad QX200TM droplet reader. KSHV and EBV were quantified as copies/µg human DNA (hDNA).
Statistical Analysis
Statistical analyses were performed in R version 3.5.1 [33]. Evaluation of risk factors for KSHV seropositivity was performed using multivariate logistic regression analysis controlling for potential confounders. Malaria and EBV antibody levels were categorized based on quartiles: MFIs below the 25th quartile was defined as low, between the 25th to 75th quartile as medium, and above 75th quartile as high levels. Pearson χ 2, Fisher exact, and McNemar tests were used for comparing all categorical variables, while Kruskal-Wallis and Wilcoxon rank sum tests were used for comparison of KSHV, malaria, and EBV antibody levels among children stratified by KSHV serostatus or patient group. Statistical significance was defined at P < .05 after Benjamini-Hochberg correction for multiple comparisons, where appropriate.
RESULTS
Characteristics of Study Participants
A total of 546 participants were included (Table 1), consisting of 266 eBL cases (median age, 7 years; range, 1.3–14.3 years), 78 non-BL cancers (median age, 6.7 years; range, 0.5–15 years), and 202 healthy children (median age, 5.6 years; range, 1.3–14.3 years). Of eBL patients recruited, 89 (33%) were female, which is consistent with eBL patients being more likely to be male than female [34].
Demographic Characteristics of Study Participants
| Characteristic | eBL | Non-BL, Non-KS Cancersa | Healthy Controls | Overall |
|---|---|---|---|---|
| Participants, n | 266 | 78 | 202 | 546 |
| Female, n (%) | 89 (33) | 43 (55) | 101 (50) | 233 (43) |
| Age, y (range) | 7 (1.3–14.3) | 6.7 (0.5–15) | 5.6 (1.3–14.3) | 6.5 (0.5–15) |
| Characteristic | eBL | Non-BL, Non-KS Cancersa | Healthy Controls | Overall |
|---|---|---|---|---|
| Participants, n | 266 | 78 | 202 | 546 |
| Female, n (%) | 89 (33) | 43 (55) | 101 (50) | 233 (43) |
| Age, y (range) | 7 (1.3–14.3) | 6.7 (0.5–15) | 5.6 (1.3–14.3) | 6.5 (0.5–15) |
Abbreviations: eBL, endemic Burkitt lymphoma; KS, Kaposi sarcoma; KSHV, Kaposi sarcoma-associated herpesvirus.
aNon-BL cancers included hepatoblastoma, acute myeloid leukemia, non-Hodgkin and Hodgkin lymphomas, nephroblastoma, and rhabdomyosarcoma while children with KS or other KSHV-associated cancers were excluded.
KSHV Seropositivity for eBL Patients Compared to Controls
To test for increased sensitivity, KSHV seropositivity was assessed in our study population using 7 KSHV ORF antigens [27] and compared to seropositivity measured with only the 2 traditional antigens (ORF73/LANA and/or K8.1). Sensitivity but not specificity was significantly higher when using 7Agn-KSHV as compared to 2-KSHV assay (P = .02, McNemar test). Across our study groups, a total of 346 (63%) children were seropositive as defined by LANA or K8.1 compared to 433 (79%) using positivity of any of the 7 antigens to define seropositivity (Table 2).
Seropositivity as Defined by LANA or K8.1 vs 7Agn-KSHV Assay
| LANA or K8.1 | 7Agn-KSHV Assay | |
|---|---|---|
| Seropositive, n (%) | 346 (63) | 433 (79) |
| Children with eBL vs non-BL cancersa | ||
| eBL (n = 266), n (%) | 180 (68) | 220 (83) |
| Other cancers (n = 78), n (%) | 45 (58) | 60 (77) |
| P value | NSb | NSb |
| Children with eBL vs healthy children | ||
| eBL (n = 266), n (%) | 180 (68) | 220 (83) |
| Healthy (n = 202), n (%) | 121 (60) | 153 (78) |
| P value | NSa | NSa |
Abbreviations: eBL, endemic Burkitt lymphoma; KS, Kaposi sarcoma; KSHV, Kaposi sarcoma-associated herpesvirus; LANA, latency-associated nuclear antigen; NS, not significant.
aNon-BL cancers included hepatoblastoma, acute myeloid leukemia, non-Hodgkin and Hodgkin lymphomas, nephroblastoma, and rhabdomyosarcoma while children with KS or other KSHV-associated cancers were excluded.
bStatistical significance determined by Χ2 analysis, P < .05.
To test the hypothesis that KSHV infection could be contributing to eBL pathogenesis, we first compared seroprevalence between eBL patients and various control groups. We found that seropositivity by individual KSHV antigens was not significantly different between eBL patients and children with other cancers. However, eBL children were more likely to be seropositive to K8.1 (P = .01) compared to healthy children (Supplementary Table 1). When antibody levels were compared, eBL children had higher antibody levels to K8.1 (P = .019) and LANA (P = .028) compared to healthy children (Supplementary Figure 1A), a pattern that was not observed when eBL and non-BL cancers were compared (Supplementary Figure 1B). When seropositivity was defined by combining responses for LANA and K8.1 or using the 7Agn-KSHV assay, there were no differences between the 3 study groups (Table 2). However, we did observe an age-dependent increase in KSHV seropositivity similar to observations reported from a study in Uganda [35]. This age effect seems to be driven by the development of antibodies to LANA (Figure 1).
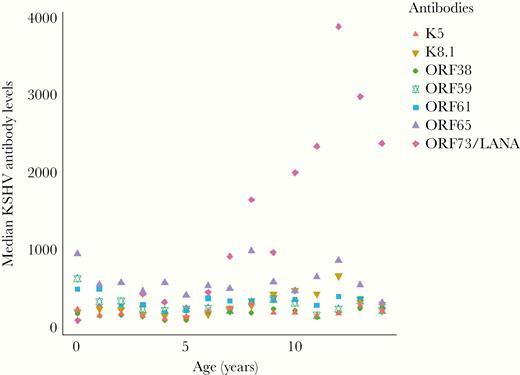
Median Kaposi sarcoma-associated herpesvirus antibody levels by age across all study participants. Median antibody levels for K5, K8.1, ORF38, ORF59, ORF61, ORF65, and LANA, presented by age of all participants, n = 546. Antibody levels are reported as mean fluorescent intensities as measured by a bead-based multiplexed immunoassay. Abbreviations: LANA, latency-associated nuclear antigen; ORF, open reading frame.
Malaria and EBV Associations With KSHV Seropositivity
Previous work described an association between high antimalarial antibody levels and KSHV seropositivity [15]. In our study, when stratifying by the traditional 2-antigen (LANA or K8.1) seropositivity test, antibodies to AMA1 were significantly higher in KSHV-seropositive eBL patients (P = .041; Figure 2A) compared to those who were KSHV seronegative. In healthy controls, both AMA1 (P < .0001) and MSP1 (P = .001) antibody levels (Figure 2B) were significantly higher in KSHV-seropositive children compared to those who were KSHV seronegative. Antibody levels to EBNA1 were significant (P = .031) in healthy but not eBL KSHV-seropositive children. When children were categorized by the 7Agn-KSHV assay, MSP1 antibody levels in eBL patients became significantly associated with KSHV seropositivity (P = .0021), while differences in AMA1 antibody levels were rendered insignificant (Figure 2C). Similarly, antibody levels to VCA (P = .0056) became significant in KSHV-seropositive as compared to seronegative eBL patients, whereas lack of significance for EBNA1 remained unchanged (Figure 2C) when using the 7Agn-KSHV assay. In healthy children, on the other hand, a strong association was maintained between antimalarial AMA1 (P < .0001) and MSP1 (P < .0004) antibody levels (Figure 2D) based on the 7Agn-KSHV assay results. This trend was not observed in healthy malaria-exposed children where antibodies to EBV antigens did not differ by KSHV serostatus (Figure 2D).
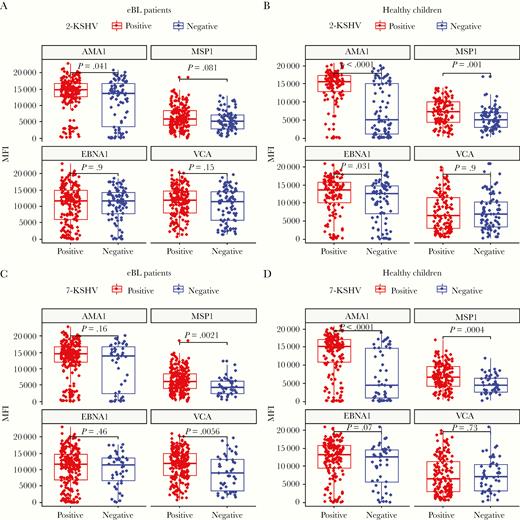
Malaria and EBV antibodies levels stratified by KSHV serostatus, as defined by LANA and K8.1 (2-KSHV) or 7Agn-KSHV assay for eBL and healthy children. Malaria (AMA1 and MSP1) and EBV (EBNA1 and VCA) antibody levels in eBL (n = 266) and healthy children (n = 202) were compared in KSHV seropositive and negative defined by LANA and K8 (A and B) and a 7Agn-KSHV assay (C and D). Centerlines represent medians, with lower and upper boundaries of the boxes representing first and third quartiles, respectively. Positive or negative KSHV serostatus were determined for each assay. Antibodies against Plasmodium falciparum AMA1 and MSP1 are an indication of ever having been infected versus recently infected, respectively. Antibodies to EBV antigens EBNA1 and VCA indicate latent infection and/or lytic reactivation, respectively. Wilcoxon test was performed on the different groups and P value < .05 was considered significant after Benjamini-Hochberg correction for multiple comparisons. Abbreviations: AMA1, apical membrane antigen-1; eBL, endemic Burkitt lymphoma; EBNA1, EBV nuclear antigen-1; EBV, Epstein-Barr virus; KSHV, Kaposi sarcoma-associated herpesvirus; LANA, latency-associated nuclear antigen; MFI, mean fluorescent intensity; MSP1, merozoite surface protein-1; VCA, viral capsid antigen.
We next evaluated the independent role of age, sex, and study group on KSHV seropositivity. As expected, LANA and K8.1 seropositivity increased with age, with children aged 5–9 years (odds ratio [OR], 1.71; 95% confidence interval [CI], 1.15–2.54; P = .008) and 10–14 years (OR, 5.06; 95% CI, 2.87–9.28; P < .001) being significantly more likely to be positive compared to the youngest, 0–4 years, age group. When defined by the 7Agn-KSHV assay, the odds of being seropositive was only significant for children aged 10–14 years (OR, 4.69; 95% CI, 2.28–10.67; P < .001) compared to younger children. A unit increase in age equated with a 25% rise in risk of KSHV seropositivity defined by LANA or K8.1 (OR, 1.25; 95% CI, 1.15–1.31; P < .001) and 15% when defined by 7Agn-KSHV assay (OR, 1.15; 95% CI, 1.07–1.24; P = .0002). Sex and study groups (eBL, non-BL cancers, or healthy children) were not independently associated with KSHV seropositivity (Table 3).
Factors Associated With KSHV Seropositivity (Univariate Analysis)
| Variable | KSHV Seropositivity by LANA and/or K8.1 | Seropositive by 7Agn-KSHV Assay | ||||
|---|---|---|---|---|---|---|
| Seropositive, No. (%) | ORa (95% CI) | P Value | Seropositive, No. (%) | ORa (95% CI) | P Value | |
| Sex | ||||||
| Female | 148 (64) | 1 (Ref) | 186 (80) | 1 (Ref) | ||
| Male | 197 (63) | 0.98 (.69–1.40) | NS | 246 (79) | 0.94 (.62–1.43) | NS |
| Group | ||||||
| Healthy | 121 (60) | 1 (Ref) | 153 (76) | 1 (Ref) | ||
| eBL | 180 (68) | 1.06 (.53–2.15) | NS | 220 (83) | 0.88 (.41–1.93) | NS |
| Non-BL cancers | 44 (57) | 0.61 (.25–1.47) | NS | 59 (77) | 0.95 (.37–2.60) | NS |
| Age group, y | ||||||
| 0–4 | 78 (50) | 1 (Ref) | 112 (71) | 1 (Ref) | ||
| 5–9 | 172 (63) | 1.71 (1.15–2.54) | .008 | 215 (78) | 1.46 (.93–2.29) | NS |
| 10–14 | 95 (83) | 5.06 (2.87–9.28) | < .001 | 105 (92) | 4.69 (2.28–10.67) | < .001 |
| Age, unit increase | 1.25 (1.15–1.31) | <.001 | 1.15 (1.07–1.24) | .0002 |
Bold text indicates a statistically significant difference with a P value less than .05.
Abbreviations: CI, confidence interval; NS, not significant; OR, odds ratio; Ref, reference. *P < .05.
aOR obtained in univariate logistic regression for the different population variables.
We next evaluated the association between malaria and EBV antibody levels with KSHV seropositivity using a regression model controlling for age, study group, and sex. Our results replicated findings from a Ugandan study [36], showing the odds of being seropositive (defined by LANA and K8.1) was higher for those with medium (OR, 6.71; P < .001) and high (OR, 4.79; P < .001) AMA1 and high (OR, 3.27; P < .001) MSP1 antibody levels. This association remained highly significant when KSHV seropositivity was defined using the 7Agn-KSHV assay and when both AMA1 and MSP1 antibody levels were treated as continuous variables (Table 4). Among eBL and healthy children, MSP1 antibody levels were positively correlated with KSHV antibody levels for K5 (R = 0.23, P < .0001), ORF61 (R = 0.2, P < .001), and LANA (R = 0.23, P < .001; Supplementary Figure 2A); while AMA1 antibodies had a weak positive correlation only with LANA antibodies (R = 0.14, P = .004; Supplementary Figure 2B). Considering the effect of age in a multivariate linear regression model, LANA antibody level was associated with higher MSP1 (OR, 1.29; 95% CI, 1.19–1.41; P < .001) and AMA1 (OR, 1.08; 95% CI, 1.03–1.14; P = .001) antibody levels. When seropositivity was defined by the combined 7Agn-KSHV, high EBNA1 antibody levels became slightly associated with KSHV (OR, 2.27; P = .01), but there was no association when both EBNA1 and VCA antibody levels were treated as continuous variables (Table 4). In-hospital survival information was available for 242 eBL and 48 non-BL cancers and the overall survival was 43% and 33%, respectively. Survival outcomes of both eBL (OR, 1.1; P = .84) [26] and non-BL cancers (OR, 0.28; P = .10) was not influenced by KSHV serostatus controlling for age and sex.
Association Between Malaria and EBV Antibody Levels and KSHV Seropositivity (Multivariate Analysis)
| Variable | KSHV Seropositivity by LANA and/or K8.1 | Seropositive by 7Agn-KSHV Assay | ||||
|---|---|---|---|---|---|---|
| Seropositive, No. (%) | ORa (95% CI) | P Value | Seropositive, No. (%) | ORa (95% CI) | P Value | |
| AMA1 | ||||||
| Low | 41 (30) | 1 (Ref) | 81 (60) | 1 (Ref) | ||
| Medium | 208 (76) | 6.71 (4.15–11.03) | <.001 | 236 (86) | 3.90 (2.35–6.56) | <.001 |
| High | 96 (71) | 4.79 (2.80–8.34) | <.001 | 115 (85) | 3.32 (1.84–6.15) | <.001 |
| Log10 (AMA1) | 2.41 (1.87–3.14) | <.001 | 2.07 (1.65– 2.61) | <.001 | ||
| MSP1 | ||||||
| Low | 72 (54) | 1 (Ref) | 91 (67) | 1 (Ref) | ||
| Medium | 165 (60) | 1.34 (.87–2.07) | NS | 215 (79) | 1.84 (1.15–2.95) | .01 |
| High | 108 (79) | 3.27 (1.89–5.78) | <.001 | 126 (93) | 6.11 (3.00–13.54) | <.001 |
| Log10 (MSP1) | 2.41 (1.47– 3.99) | .0006 | 5.78 (3.36– 10.10) | <.001 | ||
| EBNA1 levels | ||||||
| Low | 84 (62) | 1 (Ref) | 101 (74) | 1 (Ref) | ||
| Medium | 166 (61) | 0.97 (.62–1.52) | NS | 213 (78) | 1.30 (.78–2.12) | NS |
| High | 95 (69) | 1.45 (.86–2.46) | NS | 118 (86) | 2.27 (1.22–4.35) | .01 |
| Log10 (EBNA1) | 1.19 (.91–1.57) | NS | 1.12 (.84–1.48) | NS | ||
| VCA levels | ||||||
| Low | 82 (60) | 1 (Ref) | 104 (76) | 1 (Ref) | ||
| Medium | 176 (64) | 1.12 (.71–1.75) | NS | 213 (78) | 1.00 (.60–1.66) | NS |
| High | 87 (64) | 1.06 (.62–1.81) | NS | 115 (85) | 1.51 (.80–2.90) | NS |
| Log10 (VCA) | 1.19 (.78–1.83) | NS | 1.26 (.80– 1.96) | NS |
Bold text indicates a statistically significant difference with a P value less than .05.
Abbreviations: CI, confidence interval; NS, not significant; OR, odds ratio; Ref, reference. *P < .05.
aOR obtained in multivariate logistic regression adjusting for all factors in the table.
KSHV and EBV Load
To further explore possible interactions between KSHV and EBV in eBL pathogenesis, we quantified EBV and KSHV DNA in peripheral blood samples from 120 confirmed eBL, 63 non-BL cancers, and 59 healthy Kenyan children (n = 242). KSHV DNA detection rate was uniformly low across all study groups with 16 (13.3%) eBL, 3 (4.8%) non-BL cancers, and 6 (10.2%) healthy children with detectable viremia, in contrast to 99 (82.5%) eBL, 31 (49.2%) non-BL cancers, and 35 (59.3%) healthy children with detectable EBV viremia. As anticipated based on our previous study [25], eBL patients had significantly higher EBV copies/µg hDNA as compared to healthy children and non-BL cancers (P < .0001; Supplementary Figure 3A). Conversely, KSHV DNA copies were similar across our 3 study groups (P = .25; Supplementary Figure 3B). The number of children with detectable KSHV DNA (n = 25) did not differ in EBV load, stratified by our 3 study groups (Supplementary Figure 3C). We also found no overall correlation between KSHV and EBV DNA copies (Supplementary Figure 4A), nor KSHV DNA and individual KSHV, EBV, and malaria AMA1 antibody levels, although MSP1 antibody levels were negatively correlated with KSHV DNA load, with a trend towards significance (R = 0.52; P = .069; Supplementary Figure 4B). However, an examination of the 25 children with detectable KSHV DNA, stratified based on EBV DNA detection, found that KSHV DNA copies were significantly lower (P = .014) in the 18 dually viremic children (Figure 3A). Of the 18 who were dually infected, 13 were BL patients, 3 were healthy controls, and 2 had non-BL cancers. This finding was independent of age (Supplementary Figure 5A), and the proportion of children with or without detectable KSHV DNA was comparable for those who were EBV DNA positive or negative (P = .661, Fisher exact test). EBV loads were also comparable irrespective of KSHV DNA detection (Figure 3B) or serostatus (Figure 3C), and EBV load did not differ by age when comparing singly EBV-infected to dually viremic children (Supplementary Figure 5B).
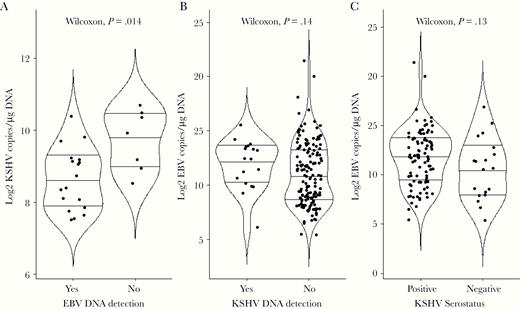
Comparison of KSHV and EBV loads. A, Of the 242 children tested for KSHV by ddPCR, only 25 were found to have detectable virus. The median log copies of KSHV/μg hDNA were compared between the 18 dually infected children and the 7 children without detectable EBV DNA (Wilcoxon, P = .014). B, Of the 242 children tested for EBV by ddPCR, 165 had detectable virus. The median log copies of EBV/μg hDNA were compared between the 18 children with detectable KSHV DNA (dually infected) and 147 children with no detectable KSHV DNA (Wilcoxon, P = .14). C, We stratified a subset of study participants (n = 114) by KSHV serostatus using the 7Agn-KSHV assay and compared EBV load measured by ddPCR. The median log copies of EBV/μg hDNA were compared between 95 KSHV seropositive and 19 seronegative individuals (Wilcoxon, P = .13). Centerlines represent medians, with lower and upper line representing first and third quartiles, respectively. Statistical analysis was performed using Wilcoxon rank sum test with continuity correction; P < .05 was considered significant after Benjamini-Hochberg correction for multiple comparisons. Abbreviations: ddPCR, droplet digital polymerase chain reaction; EBV, Epstein-Barr virus; KSHV, Kaposi sarcoma-associated herpesvirus.
Seroreactivity Pattern to KSHV Antigens
At an individual KSHV antigen level, seropositivity was best captured by LANA, with 60% seropositive across the study population (Supplementary Table 1). However, based on the seroreactivity pattern observed within our study population (Supplementary Figure 6) we decided to test the additive effect contributed by each of the 6 ORFs for KSHV seroprofiling. We found that ORF65, rather than K8.1, best complemented LANA showing a 10% increase in seropositivity. Using 4 antigens (including K8.1 and ORF61) increased the number of seropositive children to 76%, while the inclusion of the additional 3 (ORF 59, ORF38, and K8.1) overlapped with the first 4 and only raised the number seropositive by 3%. Therefore, the KSHV serology panel could arguably be reduced to 4 antigens when assessing the cost-benefits if this method were applied to population-based studies.
DISCUSSION
The goal of this study was to investigate the role of EBV-KSHV coinfection in eBL risk and survival among children residing in Africa where these herpesviruses are typically acquired early in life. By comparing KSHV seroprevalence and viral loads in eBL, non-BL cancers, and healthy children from western Kenya, we show that KSHV coinfection is not associated with eBL development nor influences survival outcomes. We conclude that KSHV infection is not overtly associated with eBL pathogenesis but high K8.1 and LANA antibody levels in eBL relative to healthy children could be an indication of impaired immunosurveillance in cancer patients that otherwise controls chronic viral infections. This is evident by the lack of differences in antibody levels between eBL and non-BL cancer patients and strengthened by the sensitivity of 7 as compared 2 KSHV antigens seroprofiling assay.
KSHV infection is prevalent in sub-Saharan Africa and geographically clusters with P. falciparum endemicity, leading to the hypothesis that P. falciparum malaria infection increases the risk of KSHV infection, seroconversion, and viral shedding/reactivation or transmission [7, 36]. Consistent with previous studies from Uganda, overall KSHV seropositivity in our study was strongly associated with a history of malaria exposure/antimalarial antibody levels. Antibodies to AMA1 and MSP1 have been used to retrospectively indicate the burden of more remote and recent P. falciparum infections, respectively [37]. For eBL patients screened in this study, higher levels of MSP1 antibodies were associated with KSHV seropositivity but AMA1 antibody levels did not vary with KSHV serostatus. This may suggest that a history of recent P. falciparum infection is associated with KSHV infection or reactivation in eBL patients. For healthy children, antimalarial antibody levels were also associated with KSHV seropositivity, suggesting that KSHV acquisition occurs concurrently with P. falciparum infection. The mechanism for P. falciparum infection-associated enhancement of KSHV acquisition is unknown but, similar to EBV [38], could be the result of direct interaction with latently infected cells or modulation of adaptive and innate immunity that favor KSHV transmission. A number of experimental observations also suggest biologically plausible scenarios. For example, host receptors, CD147 and CD36, that mediate merozoite invasion and cytoadherence of P. falciparum-infected red blood cells, respectively, could be potential targets for malaria-induced subversion of KSHV latency [18, 39]. Cross-linking CD36 with a recombinant peptide from the CD36 binding domain of P. falciparum erythrocyte membrane protein 1 (PfEMP-1) appears to trigger KSHV lytic reactivation through the activation of KSHV-RTA promoter [18], possibly increasing infectivity and persistence of KSHV. P. falciparum-malaria infection could also have a detrimental impact on antiviral immune control, leading to increased KSHV susceptibility and persistence [40]. In addition, malaria-associated anemia and subsequent hypoxia could also trigger KSHV lytic replication [15, 39]. Modulation of host immune response towards a T-helper 2 (Th2) phenotype characterized by downregulation of T-helper 1 (Th1) cytokines during parasitic infections could also facilitate KSHV persistence [40, 41]. Interleukin-6 (IL-6), which acts both as a proinflammatory and antiinflammatory cytokine, has been shown to be elevated in eBL patients compared to geographically matched healthy children [42], and is elevated during acute malaria [43] and viral infections [44]. We did not measure IL-6 levels in our study but the potential role of augmented IL-16 production in KSHV-EBV dually infected children and subsequent risk of lymphomagenesis could be explored in future studies. In addition, studies designed to determine KSHV-associated antibody and cell-mediated immune responses during P. falciparum-malaria acute infection are needed to understand the mechanisms underlying these interactions.
The lack of correlation between KSHV and EBV antibody titers and KSHV/EBV viral DNA detection is well established for KSHV [45]. We found no correlation between KSHV antibody levels and viral load, consistent with other studies that reported a lack of correlation between EBV load and specific antibody levels [45, 46]. However, a limitation of most serology studies is the lack of validated samples that are openly available and can be used to determine specificity as well as sensitivity when comparing assays. The observation suggests that during viral replication, cell-mediated but not antibody responses play a major role controlling persistent gammaherpesvirus infections. In our study, KSHV-EBV dually viremic children had significantly lower KSHV DNA copies compared to children without detectable EBV DNA, consistent with the proposed convergence model of interaction and supporting cross-viral suppression of reactivation [21]. The predominantly expressed virus (ie, EBV in our setting) has a suppressive effect on reactivation or seeding of the second virus (ie, KSHV) [39], an opposite scenario to what has previously been reported in primary effusion lymphoma where KSHV suppresses EBV [16, 17, 47]. This suggests an interaction between the 2 viruses characterized by EBV dominance and suppression of KSHV lytic reactivation, KSHV latent reservoir, or primary infection [21]. Additional experiments are needed to confirm if KSHV-infected cells are suppressed by EBV indirectly or directly, or if this is a spurious association due to the small number of children with detectable KSHV DNA.
In conclusion, we found no association between KSHV-EBV dual infections and eBL pathogenesis despite the potential interactions between these 2 viruses. In our pediatric study population, EBV appears dominant, suggesting that dual infections may have a 1-sided effect whereby EBV suppresses reactivation of KSHV. The results from our study corroborate a role for P. falciparum infections in increasing KSHV infectivity in children. However, additional longitudinal and experimental studies are needed to understand the molecular interactions between P. falciparum malaria, KSHV, and EBV and subsequent disease burden within high-risk pediatric populations.
Supplementary Data
Supplementary materials are available at The Journal of Infectious Diseases online. Consisting of data provided by the authors to benefit the reader, the posted materials are not copyedited and are the sole responsibility of the authors, so questions or comments should be addressed to the corresponding author.
Notes
Acknowledgments. The authors acknowledge the dedication of children and families who participated in this study. We also thank Denise Whitby (Frederick National Laboratory for Cancer Research, USA), Jaap Middeldorp (CytoBarr, B.V., Netherlands), and Sheetji Dutta, Evelina Angov, and Elke Bergmann (Walter Reed Army Institute of Research, USA) for kindly providing KSHV, EBV, and malaria antigens, respectively.
Author contributions. P. O. O. designed the study, performed the research, data analysis, and the writing the manuscript; C. S. F. designed the study and performed the experiments; C. I. O. designed and performed the experiments; D. P. D. contributed to experimental samples for DNA viral load research; J. M. O. contributed in sample acquisition and research design; C. M., A. M. M. and J. B. contributed to experimental design, analysis of data, and experimental tools. All authors reviewed the manuscript. The manuscript was approved for publication by the Kenya Medical Research Institute.
Financial support. This work was supported by the National Cancer Institute (NCI) (grant numbers R01 CA189806 to A. M. M. and RO1 CA239583 to D. P. D.).
Potential conflicts of interest. All authors: No reported conflicts of interest. All authors have submitted the ICMJE Form for Disclosure of Potential Conflicts of Interest. Conflicts that the editors consider relevant to the content of the manuscript have been disclosed.

