


Abstract
Evidence establishing effectiveness of influenza vaccination for prevention of severe illness is limited. The US Hospitalized Adult Influenza Vaccine Effectiveness Network (HAIVEN) is a multiyear test-negative case-control study initiated in 2015–2016 to estimate effectiveness of vaccine in preventing influenza hospitalization among adults.
Adults aged ≥18 years admitted to 8 US hospitals with acute respiratory illness and testing positive for influenza by polymerase chain reaction were cases; those testing negative were controls. Vaccine effectiveness was estimated with logistic regression adjusting for age, comorbidities, and other confounding factors and stratified by frailty, 2-year vaccination history, and clinical presentation.
We analyzed data from 236 cases and 1231 controls; mean age was 58 years. More than 90% of patients had ≥1 comorbidity elevating risk of influenza complications. Fifty percent of cases and 70% of controls were vaccinated. Vaccination was 51% (95% confidence interval [CI], 29%–65%) and 53% (95% CI, 11%–76%) effective in preventing hospitalization due to influenza A(H1N1)pdm09 and influenza B virus infection, respectively. Vaccine was protective for all age groups.
During the 2015–2016 US influenza A(H1N1)pdm09–predominant season, we found that vaccination halved the risk of influenza-association hospitalization among adults, most of whom were at increased risk of serious influenza complications due to comorbidity or age.
(.)
Annual influenza vaccination reduces the risk of medically attended outpatient influenza illness by 30%–60% [1], but evidence establishing the effectiveness of influenza vaccination in preventing severe influenza illness is limited, despite the fact that severe illness is the most burdensome manifestation of influenza in terms of human suffering and economic costs. It is widely speculated that, by attenuating disease severity following infection, vaccination may provide better protection against severe influenza outcomes, and several studies in the United States have indeed suggested better protection against influenza hospitalization than against outpatient influenza illness [2–5]. However, this trend has not been observed consistently [6], and much remains unknown about the protective effect of vaccination against severe influenza, most of which occurs among older adults with a wide range of comorbidities that may be associated with poorer vaccine response [7]. To address the need for a better understanding of vaccine performance, the Centers for Disease Control and Prevention (CDC) initiated a multisite, prospective study of effectiveness of influenza vaccine in preventing influenza-associated hospitalization among adults, the US Hospitalized Adult Influenza Vaccine Effectiveness Network (HAIVEN). Here we describe the study, present results from its first season (2015–2016), and assess performance of study methodology.
METHODS
Study Design and Enrollment
The objective of HAIVEN is to provide an annual estimate of vaccine effectiveness (VE) against influenza-associated hospitalization among adults in the United States. We used a prospective test-negative case-control design [8, 9] with active case-finding for persons hospitalized with possible influenza-associated illness at 8 hospitals in Texas, Pennsylvania, Tennessee, and Michigan. Recruitment began when there was laboratory evidence of increasing local influenza activity. Patients ≥18 years of age with qualifying symptoms/syndromes and a respiratory specimen collected ≤10 days from illness onset and ≤72 hours from hospital admission were eligible. Study staff reviewed daily admissions to identify eligible patients using a broad range of qualifying symptoms/syndromes consistent with acute respiratory infection. In brief, patients were eligible if they had a respiratory condition accompanied by evidence of acute infection based on review of chief complaints, admitting diagnoses, and summary of the initial clinical evaluation. Eligible conditions/syndromes included influenza, influenza-like illness (ILI), pneumonia (with or without radiographic evidence), upper respiratory infection, cough, bronchitis, shortness of breath, nasal congestion, chest congestion, sore throat, exacerbations of cystic fibrosis, congestive heart failure (CHF), asthma or chronic obstructive pulmonary disease (COPD) accompanied by at least 1 systemic sign or symptom of infection, and altered mental status accompanied by new onset of a respiratory symptom (Supplementary Figure 1).
Patient Data
After consenting, each participant or his/her proxy was interviewed to collect information on demographics, symptoms, influenza vaccination status, smoking history, and comorbidities. Information about clinical course and disease severity was obtained from electronic medical records. Indicators of comorbidity included self-reported number of recent hospitalizations, general health status, and home oxygen use, as well as history of high-risk conditions, number of respiratory illness–associated hospitalizations in the year prior (Supplementary Table 1), and Charlson comorbidity index [10], defined by discharge diagnosis codes. High-risk conditions were those associated with an increased risk of serious influenza complications as defined by the US Advisory Committee on Immunization Practices [7]. We developed a subjective assessment of frailty using 5 self-reported questions in which responses were dichotomized and summed to create a score ranging from 0 (not frail) to 5 (very frail) (Supplement 2) [11, 12].
Influenza Case Classification
Enrolled patients provided respiratory specimens for influenza testing by assays based on reverse-transcription polymerase chain reaction (PCR). Enrolled patients who tested positive for influenza were classified as cases and those testing negative for all influenza types were controls. To facilitate patient recruitment, participating hospitals had the choice of testing specimens in research laboratories with CDC PCR protocols or using specimens tested with PCR-based assays during routine clinical care in a laboratory completing CDC proficiency testing, provided specimens were collected ≤10 days from onset and ≤72 hours from admission. A time window of ≤10 days from onset was selected to maximize case ascertainment. Although viral shedding decreases over time, misclassification of influenza case status is unlikely to lead to substantial errors in estimated VE when using PCR-based assays with good specificity [13]. Samples were restricted to ≤72 hours from admission to exclude nosocomial infections. At 6 of 8 participating hospitals, patients meeting criteria had respiratory specimens tested with CDC PCR protocols in research laboratories. At 1 hospital, all patients meeting eligibility criteria were swabbed as part of routine clinical care, with specimens tested using the Luminex NxTAG Respiratory Pathogen Panel or Roche Liat Influenza A/B and RSV Assay. At one hospital, patients meeting eligibility criteria were swabbed at the discretion of the clinical team, with specimens tested with the GenMark eSensor Respiratory Viral Panel.
Influenza Vaccination Status
Current-season influenza vaccination status was obtained by patient self-report. For patients who reported receiving current-season influenza vaccination, documentation of vaccination was sought from medical records, immunization registries, and nontraditional vaccination providers, and, at some sites, occupational health records and insurance billing claims. Information collected included date and route of administration, product name, manufacturer, and lot number. Prior-season influenza vaccination status was obtained by patient self-report at all sites. At 3 of 4 sites, prior-season influenza vaccination status was also obtained from electronic medical records.
A participant was considered vaccinated if he or she received the 2015–2016 influenza vaccine ≥14 days prior to illness onset. Those vaccinated 0–13 days prior to illness onset were excluded. A participant was defined as vaccinated if documented evidence of vaccination was obtained from any of the aforementioned sources or if the patient reported vaccination and provided both a location and approximate date of vaccination.
Statistical Analysis
Characteristics of influenza-positive and influenza-negative patients and vaccinated and unvaccinated patients were compared using Pearson χ2 test or Fisher exact test for categorical variables and Wilcoxon rank-sum test or t test for continuous variables.
The analytic dataset excluded influenza-negative controls enrolled prior to the first influenza-positive case or after the final influenza-positive case enrolled at each site. VE was calculated by estimating the odds of influenza positivity among vaccinated patients compared to unvaccinated patients using multivariate logistic regression with influenza positivity as the outcome and vaccination status as the exposure, with VE = (1 – adjusted odds ratio) × 100%. Models were adjusted for age, sex, site, race/ethnicity, days from illness onset to specimen collection, date of illness onset (categorized as prepeak, peak, or postpeak influenza periods; Supplement 3), and 3 measures of health status: number of recent respiratory hospitalizations, history of immunosuppressive disorders, and history of lung disorders (Supplementary Table 2). These variables were used to represent health status because they most strongly correlated with influenza positivity and vaccination status. Frailty score was excluded because it was not associated with influenza positivity in models including these health status measures. Firth penalized regression was used for models with ≤5 vaccinated cases.
We estimated VE stratified by influenza type/subtype, age group, frailty score, 2-year influenza vaccination history (comparing patients vaccinated in 2015–2016 only, patients vaccinated in both 2015–2016 and 2014–2015, and patients vaccinated in 2014–2015 only with patients unvaccinated in both seasons), and intensive care unit (ICU) admission. Sensitivity analyses examined variation in VE related to methodologic alternatives, including vaccination status definition and inclusion of controls with potentially noninfectious conditions resulting from use of broadly sensitive eligibility criteria. For the latter, we examined VE in models limited to patients without COPD and/or CHF, which are representative of chronic cardiopulmonary conditions that could inflate VE estimates if these patients were more likely to be both vaccinated and influenza-negative controls [4, 14], models limited to patients without recent hospitalization for respiratory illness, models limited to patients positive for ≥1 respiratory viral pathogen (by clinical or research testing), and models limited to patients who presented with ILI (defined as subjective fever/feverishness plus cough or sore throat [7]).
Analyses were conducted with SAS version 9.3 software. Statistical significance was defined as a P value <.05 or a 95% confidence interval (CI) excluding the null value. The study protocol was approved by research ethics boards at the participating institutions.
US 2015–2016 trivalent influenza vaccines contained an A/California/7/2009 (H1N1)–like virus, an A/Switzerland/9715293/2013 (H3N2)–like virus, and a B/Phuket/3073/2013-like (Yamagata lineage) virus. Quadrivalent influenza vaccines also contained a B/Brisbane/60/2008-like (Victoria lineage) virus [15]. The 2015–2016 US influenza season was characterized by moderate influenza activity, a late peak in mid-March, and predominance of influenza A(H1N1)pdm09 viruses of the 6B.1 genetic group, although influenza A(H3N2) and influenza B viruses also circulated [16].
RESULTS
From December 2015 to May 2016, we enrolled 2046 hospitalized adults (Supplementary Figure 2). Of these, 579 were excluded because they enrolled earlier or later than the period of influenza circulation in their community (n = 467), were missing required information (eg, influenza or vaccination status; n = 105), or were tested >10 days after illness onset (n = 7) (Figure 1). The resulting dataset (n = 1467) included 192 influenza A cases (180 infected with influenza A[H1N1]pdm09), 44 influenza B cases, and 1231 influenza-negative controls. Similar to national trends, the majority (65 of 75 [87%]) of viruses isolated from study participants were antigenically similar to strains in the 2015–2016 Northern Hemisphere trivalent influenza vaccine [16].
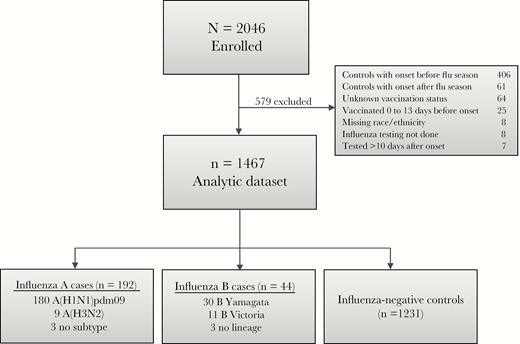
US Hospitalized Adult Influenza Vaccine Effectiveness Network (HAIVEN) study enrollment and influenza case status, 2015–2016.
Mean age of cases and controls was 57 and 58 years, respectively; 34% of cases and 38% of controls were ≥65 years old. Cases were more likely to be of nonwhite race (P < .01). Ninety-three percent of study participants had ≥1 high-risk medical condition, with heart disease (53%), diabetes (36%), and renal disorders (36%) being the most common (Supplementary Figure 3). Cases were less likely than controls to have renal disorders (30% vs 37%), CHF (24% vs 31%), lung disorders other than COPD (20% vs 30%), severe immunosuppression (8% vs 15%), malignancy (17% vs 23%), and cerebrovascular disorders (5% vs 10%) (P < .05 for each). Cases and controls had similar frequencies of COPD, asthma, and metabolic disorders. Of 1467 patients, 828 (56%) presented with ILI (Table 1 and Supplementary Table 3). Among influenza-positive patients aged <65 years and ≥65 years, 85% and 69%, respectively, presented with ILI. Twenty-two (9%) cases and 205 (17%) controls were admitted to intensive care. Two (1%) cases and 24 (2%) controls died in hospital. Compared to controls, influenza cases had a shorter median hospital length of stay (LOS) (3 vs 4 days; P < .01), and were less likely to require intensive care (9% vs 17%; P < .01) or die in hospital (1% vs 2%; P = .05).
Patient Characteristics Overall and by Influenza Status, US Hospitalized Adult Influenza Vaccine Effectiveness Network (HAIVEN) Study, 2015–2016 (n = 1467)
| Characteristic | Total (N = 1467) | Influenza Negative (n = 1231) | Influenza Positive (n = 236) | P Valuea |
| Female sex | 840 (57) | 717 (58) | 123 (52) | .08 |
| Age, y, mean (SD) | 58 (18) | 58 (18) | 57 (17) | .15 |
| Age category, y | ||||
| 18–49 | 409 (28) | 336 (27) | 73 (31) | .35 |
| 50–64 | 504 (34) | 422 (34) | 82 (35) | |
| 65–74 | 286 (20) | 239 (19) | 47 (20) | |
| ≥75 | 268 (18) | 234 (19) | 34 (14) | |
| Race/ethnicity | ||||
| White, non-Hispanic | 1007 (69) | 862 (70) | 145 (62) | <.01 |
| Black, non-Hispanic | 342 (23) | 266 (22) | 76 (32) | |
| Other, non-Hispanic | 60 (4) | 55 (4) | 5 (2) | |
| Hispanic | 58 (4) | 48 (4) | 10 (4) | |
| Site | ||||
| Michigan | 482 (33) | 388 (32) | 94 (40) | <.01 |
| Pennsylvania | 369 (25) | 287 (23) | 82 (35) | |
| Tennessee | 271 (18) | 236 (19) | 35 (15) | |
| Texas | 345 (24) | 320 (26) | 25 (11) | |
| Current-season influenza vaccination statusb | ||||
| Vaccinated | 979 (67) | 861 (70) | 118 (50) | <.01 |
| Unvaccinated | 488 (33) | 370 (30) | 118 (50) | |
| Prior-season influenza vaccination statusc,d | ||||
| Vaccinated | 970 (67) | 849 (70) | 121 (53) | <.01 |
| Unvaccinated | 468 (33) | 359 (30) | 109 (47) | |
| Days from illness onset to specimen collection | ||||
| 0–2 | 447 (31) | 378 (31) | 69 (29) | .12 |
| 3–4 | 457 (31) | 370 (30) | 87 (37) | |
| 5–7 | 397 (27) | 336 (27) | 61 (26) | |
| 8–10 | 166 (11) | 147 (12) | 19 (8) | |
| Frailty scoree,f | ||||
| 0 (least frail) | 281 (19) | 223 (19) | 58 (25) | .04 |
| 1–3 (moderately frail) | 928 (65) | 782 (65) | 146 (63) | |
| 4–5 (most frail) | 226 (16) | 198 (16) | 28 (12) | |
| No. of high-risk comorbiditiesg | ||||
| 0 | 110 (7) | 85 (7) | 25 (11) | .05 |
| 1–2 | 333 (23) | 273 (22) | 60 (25) | |
| ≥3 | 1024 (70) | 873 (71) | 151 (64) | |
| Charlson comorbidity indexh (range, 0–14), median (IQR) | 3 (1–5) | 3 (1–5) | 2 (1–4) | <.01 |
| Hospitalizations associated with respiratory illnessi in the year prior to enrollment | ||||
| 0 | 685 (47) | 581 (47) | 104 (44) | <.01 |
| 1–2 | 574 (39) | 462 (38) | 112 (47) | |
| ≥3 | 208 (14) | 188 (15) | 20 (9) | |
| Presented with ILI (subjective fever AND cough or sore throat) | 828 (56) | 641 (52) | 187 (79) | <.01 |
| Hospital LOS, d, median (IQR) | 4 (2–6) | 4 (2–6) | 3 (2–5) | <.01 |
| ICU admission | 227 (15) | 205 (17) | 22 (9) | <.01 |
| ICU days, median (IQR) | 4 (2–8) | 4 (2–8) | 5 (2–10) | .42 |
| Received invasive ventilatory support | 191 (13) | 176 (14) | 15 (6) | <.01 |
| Received ECMO support | 5 (<1) | 4 (<1) | 1 (<1) | .58 |
| Received dialysis | 47 (3) | 39 (3) | 8 (3) | .86 |
| Discharge location/statusj | ||||
| Died | 26 (2) | 24 (2) | 2 (1) | .05 |
| Home | 1254 (86) | 1042 (85) | 212 (91) | |
| Other | 171 (12) | 153 (13) | 18 (8) | |
| Died within 30 d of discharge (n = 1051)k | 28 (3) | 28 (3) | 0 (0) | .02 |
| Received chest imaging (n = 1319)l | 1063 (81) | 916 (83) | 147 (70) | <.01 |
| Infiltrate reported by radiologist (n = 606)m | 231 (38) | 209 (38) | 22 (37) | .81 |
Data are presented as No. (column %) unless otherwise indicated.
Abbreviations: ECMO, extracorporeal membrane oxygenation; ICU, intensive care unit; ILI, influenza-like illness; IQR, interquartile range; LOS, length of stay; SD, standard deviation.
aP value for test of difference across influenza status using χ2 test for categorical variables and t test and/or Wilcoxon rank-sum test for continuous variables.
bParticipants were considered vaccinated if they had documented evidence of vaccination or plausible self-report of vaccination (affirmative self-report of vaccination with location and approximate date of vaccination) ≥14 days before illness onset.
cParticipants were considered vaccinated in the prior season if they had documented evidence of vaccination or self-reported receiving influenza vaccine during the 2014–2015 influenza season.
dTwenty-nine enrollees were missing information regarding prior vaccination.
eSubjective assessments of frailty across 5 items were dichotomized (present/absent, difficult/not difficult, frequent/not frequent) and summed across items to create a frailty score ranging from 0 (not frail) to 5 (very frail).
fThirty-two enrollees were missing information regarding frailty.
gHigh-risk conditions were identified by discharge diagnoses from outpatient and inpatient medical encounters in the year prior to enrollment, where high-risk conditions were those defined by the US Advisory Committee on Immunization Practices as conditions associated with an increased risk of serious influenza complications.
hCharlson comorbidity index predicts the 10-year mortality risk for a patient who may have multiple comorbid conditions; each of 22 conditions is assigned a numerical weight depending on its associated risk, and weights are summed to provide an overall score.
iRespiratory hospitalizations include acute respiratory infections (International Classification of Diseases-9 (ICD9) Code 480), COPD and allied conditions (ICD9 490), otitis media and other diseases of the ear (ICD9 382).
jSixteen enrollees were missing information regarding discharge location.
kFour hundred sixteen enrollees were missing information regarding vital status within 30 days of hospital discharge.
lOne hundred forty-eight enrollees were missing information regarding receipt of chest imaging (computed tomography and/or radiograph).
mEight hundred sixty-one enrollees were missing information on chest infiltrate findings.
Sixty-seven percent of patients were vaccinated, with influenza cases less likely to be vaccinated than controls (50% vs 70%; P < .01). Among vaccinated patients aged 18–64 years for whom vaccine type was available, 80% received quadrivalent and 20% received trivalent inactivated vaccine. Among vaccinated patients aged ≥65 for whom vaccine type was available, 45% received inactivated high-dose vaccine, 45% quadrivalent standard-dose vaccine, and 10% trivalent standard-dose vaccine. Of 832 subjects with documented receipt of influenza vaccine, 791 (95%) reported they had been vaccinated.
Vaccination status differed by age, race, and all measures of health status, with vaccination rates higher in older patients, white patients, frailer patients, and patients with greater comorbidity (P < .01 for each; Table 2). LOS and frequencies of ICU admission and death did not differ between vaccinated and unvaccinated patients. Among 22 influenza cases admitted to the ICU, median LOS in hospital was shorter among vaccinated compared with unvaccinated cases (8.5 vs 12 days; P = .73).
Patient Characteristics Overall and by Current-Season Influenza Vaccination Status, US Hospitalized Adult Influenza Vaccine Effectiveness Network (HAIVEN) Study, 2015–2016 (n = 1467)
| Characteristic | Total (N = 1467) | Unvaccinated (n = 488) | Vaccinated (n = 979) | P Valuea |
| Female sex | 840 (57) | 270 (55) | 570 (58) | .29 |
| Age, y, mean (SD) | 58 (18) | 52 (17) | 61 (17) | <.01 |
| Age category, y | ||||
| 18–49 | 409 (28) | 198 (41) | 211 (22) | <.01 |
| 50–64 | 504 (34) | 171 (35) | 333 (34) | |
| 65–74 | 286 (20) | 78 (16) | 208 (21) | |
| ≥75 | 268 (18) | 41 (8) | 227 (23) | |
| Race/ethnicity | ||||
| White, non-Hispanic | 1007 (69) | 280 (58) | 727 (74) | <.01 |
| Black, non-Hispanic | 342 (23) | 158 (32) | 184 (19) | |
| Other, non-Hispanic | 60 (4) | 25 (5) | 35 (4) | |
| Hispanic | 58 (4) | 25 (5) | 33 (3) | |
| Site | ||||
| Michigan | 482 (33) | 169 (35) | 313 (32) | .78 |
| Pennsylvania | 369 (25) | 118 (24) | 251 (26) | |
| Tennessee | 271 (18) | 89 (18) | 182 (19) | |
| Texas | 345 (24) | 112 (23) | 233 (24) | |
| Influenza test results | ||||
| Negative | 1231 (84) | 370 (76) | 861 (88) | <.01 |
| Positive | 236 (16) | 118 (24) | 118 (12) | |
| Prior-season influenza vaccination statusc,d | ||||
| Vaccinated | 970 (67) | 131 (28) | 839 (87) | <.01 |
| Unvaccinated | 468 (33) | 345 (72) | 123 (13) | |
| Days from illness onset to specimen collection | ||||
| 0–2 | 447 (31) | 141 (29) | 306 (31) | .28 |
| 3–4 | 457 (31) | 150 (31) | 307 (32) | |
| 5–7 | 397 (27) | 131 (27) | 266 (27) | |
| 8–10 | 166 (11) | 66 (13) | 100 (10) | |
| Frailty scoree,f | ||||
| 0 (least frail) | 281 (19) | 120 (25) | 161 (17) | <.01 |
| 1–3 (moderately frail) | 928 (65) | 299 (63) | 629 (66) | |
| 4–5 (most frail) | 226 (16) | 58 (12) | 168 (17) | |
| No. of high-risk comorbiditiesg | ||||
| 0 | 110 (7) | 75 (15) | 35 (4) | <.01 |
| 1–2 | 333 (23) | 157 (32) | 176 (18) | |
| ≥3 | 1024 (70) | 256 (53) | 768 (78) | |
| Charlson comorbidity indexh (range, 0–14), median (IQR) | 3 (1–5) | 1 (0–3) | 3 (1–5) | <.01 |
| Hospitalizations associated with respiratory illnessi in the year prior to enrollment | ||||
| 0 | 685 (47) | 271 (56) | 414 (42) | <.01 |
| 1–2 | 574 (39) | 177 (36) | 397 (41) | |
| ≥3 | 208 (14) | 40 (8) | 168 (17) | |
| Hospital LOS, d, median (IQR) | 4 (2–6) | 3 (2–6) | 4 (2–6) | .27 |
| ICU admission | 227 (15) | 85 (17) | 142 (15) | .15 |
| ICU days, median (IQR) | 4 (2–8) | 3 (2–8) | 4 (2–8) | .46 |
| Received invasive ventilatory support | 191 (13) | 64 (13) | 127 (13) | .94 |
| Received ECMO support | 5 (<1) | 3 (<1) | 2 (<1) | .34 |
| Received dialysis | 47 (3) | 13 (3) | 34 (3) | .41 |
| Discharge location/statusj | ||||
| Died | 26 (2) | 9 (2) | 17 (2) | .49 |
| Home | 1254 (86) | 424 (88) | 830 (86) | |
| Other | 171 (12) | 50 (10) | 121 (12) | |
| Died within 30 d of discharge (n = 1051)k | 28 (3) | 6 (2) | 22 (3) | .17 |
| Received chest imaging (n = 1319)l | 1063 (81) | 355 (78) | 708 (82) | .14 |
| Infiltrate reported by radiologist (n = 606)m | 231 (38) | 75 (38) | 156 (38) | .96 |
Data are presented as No. (column %) unless otherwise indicated.
Abbreviations: ECMO, extracorporeal membrane oxygenation; ICU, intensive care unit; IQR, interquartile range; LOS, length of stay; SD, standard deviation.
aP value for test of difference across vaccination status using χ2 test for categorical variables and t test and/or Wilcoxon rank-sum test for continuous variables.
bParticipants were considered vaccinated if they had documented evidence of vaccination or plausible self-report of vaccination (affirmative self-report of vaccination with location and approximate date of vaccination) ≥14 days before illness onset.
cParticipants were considered vaccinated in the prior season if they had documented evidence of vaccination or self-reported receiving influenza vaccine during the 2014–2015 influenza season.
dTwenty-nine enrollees were missing information regarding prior vaccination.
eSubjective assessments of frailty across 5 items were dichotomized (present/absent, difficult/not difficult, frequent/not frequent) and summed across items to create a frailty score ranging from 0 (not frail) to 5 (very frail).
fThirty-two enrollees were missing information regarding frailty.
gHigh-risk conditions were identified by discharge diagnoses from outpatient and inpatient medical encounters in the year prior to enrollment, where high-risk conditions were those defined by the US Advisory Committee on Immunization Practices as conditions associated with an increased risk of serious influenza complications.
hCharlson comorbidity index predicts the 10-year mortality risk for a patient who may have multiple comorbid conditions; each of 22 conditions is assigned a numerical weight depending on its associated risk, and weights are summed to provide an overall score.
iRespiratory hospitalizations include acute respiratory infections (International Classification of Diseases-9 (ICD9) Code 480), COPD and allied conditions (ICD9 490), otitis media and other diseases of the ear (ICD9 382).
jSixteen enrollees were missing information regarding discharge location.
kFour hundred sixteen enrollees were missing information regarding vital status within 30 days of hospital discharge.
lOne hundred forty-eight enrollees were missing information regarding receipt of chest imaging (computed tomography and/or radiograph).
mEight hundred sixty-one enrollees were missing information on chest infiltrate findings.
Overall, 24% of unvaccinated patients and 12% of vaccinated patients were infected with influenza.
Vaccination was 51% (95% CI, 29%–65%) and 53% (95% CI, 11%–76%) effective in preventing hospitalization due to influenza A(H1N1)pdm09 and influenza B virus infection, respectively (Table 3). VE was significantly protective for all age groups (18–49 years, 50–64 years, and ≥65 years; Table 3) and did not vary significantly by age among all enrollees or when restricting cases to patients with influenza A(H1N1)pdm09 virus infection (Figure 2). Patients vaccinated in the current season only or in both current and prior influenza seasons had significantly protective VE of 52% (95% CI, 12%–74%) and 55% (95% CI, 35%–69%); residual protection among patients vaccinated in the prior season only did not differ significantly from zero, with VE of 21% (95% CI, –36% to 55%). After controlling for age and other factors, VE was similar among frail and nonfrail patients. When limiting analysis to 227 patients requiring ICU admission, VE adjusted for site and age was 81% (95% CI, 49%–93%).
Influenza Vaccine Effectiveness for Prevention of Influenza A or B–Associated Hospitalization, US Hospitalized Adult Influenza Vaccine Effectiveness Network (HAIVEN) Study, 2015–2016
| Characteristic | Adjustment/Stratification | No. | Vaccinated Cases/ Total Vaccinated, No. (%) | Unvaccinated Cases/ Total Unvaccinated, No. (%) | Unadjusted VE, % (95% CI) | Adjusted VEa, % (95% CI) |
| All ages | Adjusted by study site only | 1467 | 118/979 (12) | 118/488 (24) | 57 (43–68) | 58 (44–68) |
| Adjusted by study site and calendar time | 1467 | 118/979 (12) | 118/488 (24) | 57 (43–68) | 57 (43–68) | |
| Adjusted by study site, calendar time, presence of chronic conditions | 1467 | 118/979 (12) | 118/488 (24) | 57 (43–68) | 52 (36–65) | |
| Fully adjusted | 1467 | 118/979 (12) | 118/488 (24) | 57 (43–68) | 50 (32–64) | |
| Age group, y | 18–49 | 409 | 22/211 (10) | 51/198 (26) | 66 (42–81) | 65 (34–81) |
| 50–64 | 504 | 43/333 (13) | 39/171 (23) | 50 (19–69) | 46 (7–68) | |
| ≥65 | 554 | 53/435 (12) | 28/119 (24) | 55 (25–73) | 50 (12–72) | |
| Influenza type/subtype | Influenza A | 1423 | 95/956 (10) | 97/467 (21) | 58 (43–69) | 51 (30–65) |
| Influenza A(H1N1)pdm09 | 1411 | 89/950 (9) | 91/461 (20) | 58 (42–69) | 51 (29–65) | |
| Influenza B | 1275 | 23/884 (3) | 21/391 (5) | 53 (14–74) | 53 (11–76) | |
| 2-y vaccination historyb | Current-season (2015–2016) vaccination only | 497 | 21/140 (15) | 94/357 (26) | 51 (17–71) | 52 (12–74) |
| Prior-season (2014–2015) vaccination only | 488 | 24/131 (18) | 94/357 (26) | 37 (–4 to 62) | 21 (–36 to 55) | |
| Current- and prior-season vaccination | 1196 | 97/839 (12) | 94/357 (26) | 63 (50–73) | 55 (35–69) | |
| Frailty score | 0 (least frail) | 281 | 24/161 (15) | 34/120 (28) | 56 (20–75) | 52 (2–77) |
| 1–3 (moderately frail) | 928 | 77/629 (12) | 69/299 (23) | 54 (33–68) | 47 (21–64) | |
| 4–5 (most frail) | 226 | 16/168 (10) | 12/58 (21) | 60 (9–82) | 51 (–34 to 82) | |
| ICU admission | Adjusted by site and age | 227 | 6/142 (4) | 16/85 (19) | 81 (49–93) | 81 (49–93) |
| Sensitivity analyses | ||||||
| Timing of specimen collection | ≤7 days after illness onset | 1301 | 112/879 (13) | 105/422 (24) | 56 (41–67) | 47 (27–62) |
| Patients without chronic cardiopulmonary disease | Patients without COPD | 993 | 74/628 (12) | 94/365 (26) | 62 (46–73) | 53 (31–68) |
| Patients without COPD or CHF | 770 | 55/459 (12) | 78/311 (25) | 59 (41–72) | 50 (22–67) | |
| Patients with <3 respiratory hospitalizations in past year | 1259 | 105/811 (13) | 111/448 (25) | 55 (39–66) | 48 (28–63) | |
| Patients with no respiratory hospitalizations in past year | 685 | 43/414 (10) | 61/271 (23) | 60 (39–74) | 56 (29–72) | |
| Clinical presentation | Patients presenting with ILIc | 828 | 87/511 (17) | 100/317 (32) | 56 (38–68) | 52 (31–67) |
Abbreviations: CHF, congestive heart failure; CI, confidence interval; COPD, chronic obstructive pulmonary disease; ICU, intensive care unit; ILI, influenza-like illness; VE, vaccine effectiveness.
aAdjusted for age, site, sex, race, days between onset and respiratory specimen collection, date of illness onset, history of immunosuppressive conditions, number of prior-year respiratory hospitalizations, and history of respiratory disorders other than COPD.
bReference group is patients unvaccinated in both the current and prior influenza seasons.
cDefined as subjective fever/feverishness plus cough or sore throat.
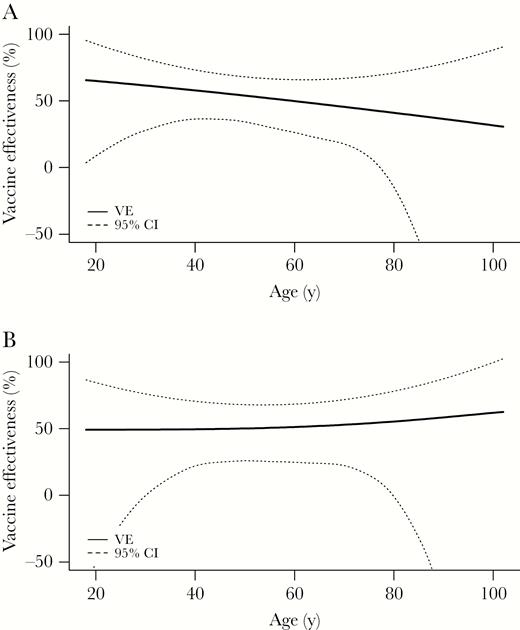
Adjusted vaccine effectiveness against influenza A or B virus–associated hospitalization (A) (P = .68 for interaction between vaccination status and age) and against influenza A(H1N1)pdm09 virus–associated hospitalization (B) (P = .43 for interaction) by age, US Hospitalized Adult Influenza Vaccine Effectiveness Network (HAIVEN) study, 2015–2016 (n = 1467). Abbreviations: CI, confidence interval; VE, vaccine effectiveness.
Sensitivity Analyses
VE estimates differed with alternative definitions of vaccination status (Figure 3), with VE based on patient self-report greater than VE based on documented evidence of vaccination (52% vs 34%). Among patients without common chronic cardiopulmonary conditions, VE was similar to the primary estimate, varying from 48% (95% CI, 28%–63%) to 56% (95% CI, 29%–72%). Among patients positive for ≥1 respiratory viral pathogen (n = 429), VE was 45% (95% CI, 6%–67%). When limiting analysis to 828 (56%) patients presenting with ILI, VE was 52% (95% CI, 30%–67%). VE was 47% (95% CI, 27%–62%) among patients tested ≤7 days from illness onset.
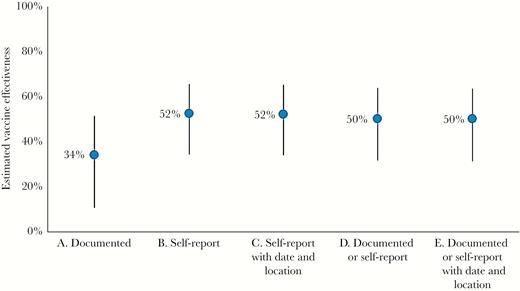
Variation in estimated vaccine effectiveness (against influenza A or B virus–associated hospitalization) with alternative definitions of vaccination status, US Hospitalized Adult Influenza Vaccine Effectiveness Network (HAIVEN) study, 2015–2016. The primary analysis of vaccine effectiveness used is “E. Documented or self-report with date and location.”
DISCUSSION
During the 2015–2016 US influenza season in which influenza A(H1N1)pdm09 was the predominant circulating influenza strain, we found that vaccination halved the risk of influenza-associated hospitalization among adults, most of whom were at increased risk of serious influenza complications due to comorbidity or age. Vaccine protection was similar across influenza types and comparable to that observed for prevention of influenza-associated hospitalization among European adults (41%–51%) [17]. Our observed VE was slightly higher than VE observed against influenza-associated outpatient visits in the United States, which was 41% among adults and 48% among all ages [18] (personal communication with J. Chung, US CDC). However, VE was lower than the average effectiveness against influenza A(H1N1)pdm09 observed in similar studies conducted from 2004 to 2015 (67% among adults and 61% among all ages) [1] (personal communication with E. Belongia, Marshfield Clinic Research Institute). All recent influenza A(H1N1)pdm09 viruses belong to hemagglutinin genetic group 6B and have been antigenically similar to vaccine strains. Although 2 genetic subgroups, 6B.1 and 6B.2, have emerged, with the majority of US viruses belonging to 6B.1, we did not identify any features of viruses from study participants that would be expected to result in decreased VE. Interestingly, we observed higher VE of 81% against the more severe outcome of influenza-associated ICU admission, a pattern similar to that observed in studies from Canada, New Zealand, and Spain [19–22]. While this finding suggests that vaccination may have attenuated severity of influenza illness, this result must be interpreted cautiously given the small sample size.
Our study fills a gap in the evidence base regarding effectiveness of influenza vaccine for prevention of serious influenza outcomes among adults in the United States and complements the existing US Flu VE Network and hospital-based VE networks from other countries [17, 19, 21, 23]. Strengths of our study include substantial enrollment of older adults, active and geographically diverse patient recruitment, use of standardized protocols with symptom-based eligibility, and comprehensive PCR testing.
Our study has limitations, including potential selection bias from inclusion of patients with noninfectious cardiopulmonary conditions, which may bias VE upward [14]. After adjusting for comorbidities, we found an adjusted VE (against influenza A or B) of 50%, lower than the unadjusted VE of 57%, consistent with predictions of simulation models [14]. VE was similar in models restricted to patients without COPD, patients without COPD or CHF, patients without recent respiratory hospitalization, and patients presenting with ILI. These results suggest that minimal bias arose from use of broad eligibility criteria.
Although our results are consistent with other published reports from 2015–2016, aspects of our study warrant comment. Consistent with some previous studies [4, 13], we found that VE estimates varied by vaccine status definition. Lack of full access to outpatient health records and expanding use of nontraditional vaccination providers in the United States makes retrieving documented evidence of vaccination increasingly difficult [24]. Alternatively, self-reported vaccination can be used but is prone to recall bias that may inflate vaccination rates [25–31]. Misclassification of vaccination status due to either missing records or erroneous self-report would bias VE estimates downward if it occurs similarly among cases and controls, underestimating vaccine protection. In addition, we were unable to control for receipt of pneumococcal vaccine. Intensified vaccine verification efforts were added in the second study year to improve completeness of influenza vaccination status ascertainment.
Enrolling sufficient influenza cases to measure VE among patient subgroups was challenging, a limitation addressed by expanding the number of sites and increasing per-site enrollment in subsequent study years. An additional limitation was reliance on influenza testing ordered at clinician discretion at 1 hospital, which could bias VE estimates if vaccinated patients were less likely to be tested. An analysis of data from the hospital using clinician-directed testing found no association between vaccination status and influenza testing [32], and excluding patients enrolled from this hospital yielded a similar VE estimate of 47%. Nevertheless, the study protocol was modified to require PCR-based testing for all consented patients meeting symptom-based enrollment criteria.
Influenza vaccines are unique in that their formulation typically changes yearly. Hence, annual evaluation of vaccine performance is critical for determining effectiveness. While results from a single season, such as the 2015–2016 season reported here, may not generalize to other seasons in which influenza A(H3N2) is the predominant circulating strain, the annual reassessment of VE allows accumulation of evidence needed to critically evaluate performance of the US influenza vaccine program over time. Such assessment of VE is also useful for identifying unanticipated changes in vaccine performance, for example, when the live attenuated vaccine was found to be ineffective against influenza A(H1N1)pdm09 in the United States during the 2013–2014 and 2015–2016 seasons. As additional vaccines become available for older adults and other groups at increased risk for serious influenza complications, evaluation of these vaccines will be essential to determine their ability to improve protection against serious outcomes in these populations. Although sample size was too small to evaluate specific vaccine formulations such as high-dose and adjuvanted vaccines in this first year of the HAIVEN study, the goal is to increase enrollment for this network to evaluate such vaccines using comparative effectiveness models.
In conclusion, this multisite study found that influenza vaccine, even with moderate effectiveness, can substantially reduce the risk of serious consequences of influenza infection among adults, including those whose age or health conditions make them particularly vulnerable.
Supplementary Data
Supplementary materials are available at The Journal of Infectious Diseases online. Consisting of data provided by the authors to benefit the reader, the posted materials are not copyedited and are the sole responsibility of the authors, so questions or comments should be addressed to the corresponding author.
Notes
Acknowledgments. The authors thank Drs Ed Belongia and Huong McLean of the Marshfield Clinic Research Institute for providing summary estimates of VE among adults from their meta-analysis of outpatient test-negative case-control design influenza VE studies.
HAIVEN Study Investigators. Baylor Scott and White Health, Temple, Texas: Manjusha Gaglani, Tresa McNeal, Anne Robertson, Arundhati Rao, Kevin Chang, Kimberly Walker, Meredith Wimberly, Kempapura Murthy, Laurel Kilpatrick, Shekhar Ghamande, Alejandro Arroliga. University of Pittsburgh Medical Center, Pennsylvania: Richard Zimmerman, Donald Middleton, Fernanda Silveira, Heather Eng, Theresa Sax, Julie Paronish, Sean Saul, Balasubramani Goundappa, Mary Patricia Nowalk, Charles Rinaldo, Jr, Arlene Bullota, Lori Steiffel, Diana Pakstis. University of Michigan, Ann Arbor: Arnold Monto, Emily Martin, Ryan Malosh, Joshua Petrie, Adam Lauring, Caroline Cheng, Hannah Segaloff, E. J. McSpadden, Emileigh Johnson, Rachel Truscon. Henry Ford Health System, Detroit, Michigan: Lois Lamerato, Susan Davis, Marcus Zervos. Vanderbilt University Medical Center, Nashville, Tennessee: H. Keipp Talbot, Dayna Wyatt, Yuwei Zhu, Zhouwen Liu, Rendie McHenry, Marie Griffin, Natasha Halasa, Sandra Alvarez Calvillo, Stephanie Longmire, Erin Zipperer, Laura Stewart. CDC: Jill Ferdinands, Alicia Fry, Elif Alyanak, Courtney Strickland, Sarah Spencer, Brendan Flannery, Jessie Chung, Xiyan Xu, Stephen Lindstrom, LaShondra Berman, Wendy Sessions, Rebecca Kondor.
Disclaimer. The findings and conclusions in this report are those of the authors and do not necessarily represent the official position of the CDC.
Financial support. This study was funded by the CDC (cooperative agreement IP15-002). This study was also funded in part at Pittsburgh by the National Institutes of Health (NIH) Clinical and Translational Science Award (CSTA) program, grant UL1 TR001857.
Potential conflicts of interest. A. M. has received personal fees from Sanofi Pasteur and Seqirus. K. M. and M. G. have received grants from AstraZeneca–MedImmune. E. M. has received grants from Merck, Pfizer, and Multiparty Group for Advice on Science (MUGAS) Foundation through an unrestricted grant from Roche Pharmaceuticals. R. Z., D. M., and F. S. have received grants from Merck & Co, Sanofi Pasteur, and Pfizer. H. K. T. has received grants from Sanofi Pasteur. All other authors report no potential conflicts. All authors have submitted the ICMJE Form for Disclosure of Potential Conflicts of Interest. Conflicts that the editors consider relevant to the content of the manuscript have been disclosed.
References
Author notes
The HAIVEN Study Investigators are listed in the Notes.

