


Abstract
Mechanisms linking herpes simplex virus type 2 (HSV-2) with human immunodeficiency virus (HIV) are not fully defined. We tested the hypothesis that HSV-2 and HIV dual infection is associated with cervicovaginal inflammation and/or vaginal dysbiosis.
Genital tract samples were obtained weekly over a 12-week period from 30 women seropositive (+) for HIV and HSV-2 and 15 women each who were seropositive for one or seronegative (−) for both viruses. Immune mediators, antimicrobial activity, and microbial composition and diversity were compared.
Significant differences in the concentrations of interferon-γ (P = .002), tumor necrosis factor-α (P = .03), human beta defensin 1 (P = .001), secretory leukocyte protease inhibitor (P = .01), and lysozyme (P = .03) were observed across the 4 groups (Kruskal-Wallis). There were also significant differences in vaginal microbial alpha diversity (Simpson index) (P = .0046). Specifically, when comparing HIV-1+/HSV-2+ to HIV-1−/HSV-2− women, a decrease in Lactobacillus crispatus and increase in diverse anaerobes was observed. The number of genital HSV outbreaks was greater in HIV+ versus HIV− women (39 versus 12) (P = .04), but there were no significant differences when comparing outbreak to non-outbreak visits.
Increased microbial diversity and cervicovaginal inflammation in HIV and HSV-2 dually infected women may adversely impact genital health and, in the absence of antiretroviral therapy, facilitate HIV shedding.
The worldwide prevalence of herpes simplex virus type 2 (HSV-2) is greater than 400 million with an annual incidence of approximately 20 million cases including 11.8 million women [1]. Herpes simplex virus type 2 is one of the most significant factors fueling the human immunodeficiency virus (HIV) epidemic [2], and being seropositive for both HIV and HSV-2 is linked to higher HIV plasma viral loads (PVLs), accelerated HIV disease progression, and increased risk of HIV transmission. Conversely, higher rates of HSV-2 symptomatic or subclinical shedding are observed in HIV-infected (HIV+) compared with HIV-uninfected (HIV−) individuals [3–6]. However, the biological mechanisms underlying this syndemic have not been fully defined.
Frequent sampling and sensitive polymerase chain reaction (PCR) assays have led to the realization that subclinical HSV-2 reactivation is common and may trigger local inflammatory responses [7–9]. This notion is supported by the finding of increased numbers and persistence of CD4+ and CD8αα+ T cells at sites of HSV-2 reactivation (vulvar and buttock skin biopsies) compared with the contralateral unaffected side [10]. It is possible that a similar inflammatory response to subclinical HSV reactivation may be present within the cervicovaginal environment, the presumed site of HIV acquisition and transmission.
We previously quantified the antiviral activity of cervicovaginal lavage (CVL) against HSV-2 ex vivo and the CVL concentrations of select immune mediators in HIV− women with an active external genital herpetic lesion compared with doubly seronegative (HIV−/HSV-2−) controls. Samples were obtained at the time of a symptomatic HSV lesion, after 1 week of oral acyclovir, and 1 week after completing treatment. Increased concentrations of inflammatory molecules and higher anti-HSV activity were observed at the time of clinical outbreaks, which were primarily located on the vulva or buttocks, and persisted for at least 1 week [11]. These findings support the hypothesis that symptomatic skin recurrences might be associated with an inflammatory response within the cervicovaginal environment. The vaginal microbiome was not assessed, but, in other settings, a loss of protective lactobacilli and increase in microbial diversity have been associated with mucosal inflammation and increased HIV risk [12].
In a cross-sectional study, CVL antimicrobial activity and concentrations of immune molecules were compared in HIV+ women with relatively high PVL (>10 000 copies/mL), low PVL (<2600 copies/mL), or HIV− women [13]. High PVL was associated with higher concentrations of proinflammatory cytokines and chemokines, less endogenous anti-Escherichia coli bactericidal activity, and higher Nugent scores. However, the study only measured mediators at a single time-point, did not include molecular testing for HSV shedding, or characterization of the vaginal microbiome. A few small studies suggest that recurrent genital HSV is associated with a higher Nugent score, decreases in protective lactobacilli, and/or increases in diverse anaerobes [14–16].
Building on this foundation, we conducted a 12-week longitudinal study and compared the vaginal microbiome and the concentrations of immune mediators and antimicrobial activity of genital tract secretions in HIV+/HSV-2+, HIV+/HSV-2−, HIV−/HSV-2+, and HIV−/HSV-2− women. We hypothesized that, even in the setting of antiretroviral therapy (ART) and low PVL, HIV+/HSV-2+ coinfection would be associated with cervicovaginal inflammation, a decrease in CVL antimicrobial activity, loss of vaginal lactobacilli, and/or greater microbial diversity and speculated that such changes could promote HIV shedding in the absence of ART.
METHODS
Ethics Statement
The study was conducted according to the Declaration of Helsinki and approved by the Albert Einstein College of Medicine Institutional Review Board. All participants provided written informed consent.
Study Design
Thirty HIV-1+/HSV-2+ (dually infected), 15 HIV+/HSV-2−, 15 HIV−/HSV-2+, and 15 HIV-1−/HSV-2− (control) women 18 years of age or older were recruited. Participants were excluded for pregnancy, use of suppressive herpes antiviral therapy, history of cervical cancer, hysterectomy, and high-grade intraepithelial neoplasia within the year before enrollment. The Focus HerpeSelect HSV-1 and HSV-2 serum antibody assay was performed at enrollment in all participants, and the OraQuick ADVANCE Rapid HIV-1/2 Antibody Test was performed in those who were not documented HIV-1+. Participants were followed for 12 weeks and, at weekly visits, vaginal pH was measured (Whatman pH paper, pH 3.8–5.5) and vaginal swabs were collected. Cervicovaginal lavage (10 mL normal saline) was obtained at enrollment (visit 1), week 6 (visit 7), and week 12 (visit 13). Women were also asked to return for additional sampling (CVL and swab) if they had a genital herpes outbreak as defined by presence of symptoms (pruritus, pain) and a discrete genital (vulva, vagina, cervix, perineum, buttocks) vesicle or ulcer. Nugent scores were assessed at enrollment, week 12, and during outbreaks [17].
Measurement of Immune Molecules and Antimicrobial Activity
Cervicovaginal lavages and swabs were transported to the laboratory on ice. Cervicovaginal lavages were clarified by centrifugation at 700 × gravity for 10 minutes at 4°C. Supernatants were divided into aliquots and stored at −80°C. An aliquot of unspun CVL was stored for HIV ribonucleic acid (RNA) quantification. The CVL protein concentration was measured by Micro-BCA Protein Assay kit (Thermo Scientific, Rockford, IL). Cervicovaginal lavage concentrations of interleukin (IL)-1 receptor antagonist (IL-1ra), IL-1α, IL-1β, IL-6, IL-8, macrophage inflammatory protein (MIP)-1α, MIP-1β, regulated upon activation, normal T-cell expressed and secreted (RANTES), interferon (IFN)-γ, and tumor necrosis factor (TNF)-α were quantified by multiplex proteome array with beads from Millipore (Billerica, MA), measured using Luminex 100 (Luminex Corp., Austin, TX) and analyzed using StarStation (Applied Cytometry Systems, Sacramento, CA). Commercial enzyme-linked immunosorbent assay kits were used to measure CVL concentrations of secretory leukocyte protease inhibitor (SLPI) (R&D Systems, Minneapolis, MN), lactoferrin (Calbiochem, San Diego, CA), lysozyme (ALPCO Diagnostics, Salem, NH), human neutrophil peptides 1–3 (HNP1-3) (HyCult Biotechnology, Uden, The Netherlands), human beta defensin (HBD) 1, HBD2, and HBD3 (Alpha Diagnostic International, San Antonio, TX), immunoglobulin (Ig)A, and IgG (Cygnus Technologies, Soundport, NC). These mediators were selected for their association with inflammation, HIV risk, and/or endogenous antimicrobial activity [13, 18]. The ability of CVL to inhibit or enhance HIV-1 infection of TZM-bl cells, HSV-2 infection of Vero cells, or E coli growth was measured as previously described and is presented as the mean percentage inhibition relative to control plates [19]. Values greater than 100% are indicative of enhancement of infection.
Human Immunodeficiency Virus Ribonucleic Acid and Herpes Simplex Virus-2 Deoxyribonucleic Acid Quantification
Human immunodeficiency virus-1 RNA was quantified in plasma and CVL and HSV-2 deoxyribonucleic acid (DNA) in vaginal swabs using the Abbott m2000 System (Abbott Molecular, Des Plaines, IL) [20, 21].
Vaginal Microbiome
Deoxyribonucleic acid was extracted from frozen vaginal swabs using a Powersoil DNA Isolation Kit (Mo Bio, Carlsbad, CA). The V1–V3 hypervariable regions of the bacterial 16S ribosomal (rRNA) gene were amplified by PCR using barcoded primers and sequenced using the Illumina MiSeq using 2 × 300 base-paired end technology (384 samples/run) [22]. Sequencing resulted in an average of 74 163 raw paired-reads/sample. The raw paired-end reads were preprocessed using the MeFiT pipeline [23], which merges the overlapping tails to generate the full V1–V3 amplicon and filters it for quality using a maximum expected error rate of 1 per 100 bases. The resulting high-quality amplicons were classified to species-level using STIRRPUS, which uses the USEARCH algorithm combined with a curated vaginal 16S rRNA gene database [18].
Statistical Analyses
A cross-sectional analysis using enrollment sampling was performed. For participants who had an HSV-2 outbreak at enrollment (4 HIV-1+/HSV-2+ and 1 HIV-1−/HSV-2+ only), a non-outbreak sample was used. Concentrations of mediators below the lower limit of detection (LLOD) were set at the LLOD [24]. Differences in participant characteristics, concentrations of CVL immune mediators, and antimicrobial activity (HSV, E coli, and HIV) across all 4 groups were compared using χ2 or Fisher’s exact tests for categorical variables and analysis of variance or Kruskal-Wallis tests for continuous variables. Spearman’s correlation coefficients were estimated to assess associations between antimicrobial activity and concentrations of immune mediators. Additional comparisons between groups were assessed by regression for log-transformed immune mediators with adjustment for age, smoking, and douching. A regression model for testing main and interaction effects of HIV and HSV-2 was performed to assess whether differences were predominantly affected by HIV and/or HSV-2 serostatus. Repeated measures analyses were performed using linear mixed-effect models by including subject-specific random intercept to evaluate effects of HIV and HSV-2 over time and to compare HSV-2 outbreak to non-outbreak visits. Sensitivity analysis was also performed by removing postmenopausal women. Intraclass correlation coefficients (ICC) within participants were calculated for vaginal pH, Nugent score, and other mediators.
Read counts assigned by STIRRUPS at species-level above the identity threshold of 97% were converted to proportions to determine the percentage of the total microbiome contributed by each species. The predominant taxon in a sample refers to the taxon for which the largest number of reads were assigned taxonomic classification with confidence. Microbiomes were categorized by dominant taxa (vagitypes) as previously described [22, 25]. For example, in the Lactobacillus crispatus vagitype, L crispatus was predominant and proportionally ≥30%. A final vagitype included microbiomes in which there was no predominant taxon with ≥30% representation. This strategy is reproducible and has ~90% agreement with other clustering approaches [25], but it provides a higher resolution of vaginal microbiomes than earlier stratification strategies [26].
Linear discriminant analysis (LDA) effect size [27] was used to perform high-dimensional class comparisons to identify species that discriminate the HIV and HSV groups. It applies a Kruskal-Wallis rank-sum test for each bacterium, followed by LDA to estimate effect size of the contributing variable. Only bacterial species that are present in relative abundance of >0.1% in at least 25% of samples in either group were included in the analysis. The bar plots indicate effect size of bacterial species that correlate with HSV and HIV status with a minimum LDA score cutoff of 3.0.
RESULTS
Clinical and Demographic Characteristics
Most of the HIV+ women were on ART, had low or undetectable PVL, and had similar numbers of CD4+ T cells in the peripheral blood when comparing the HSV-2+ and HSV-2− participants (Table 1). The dually infected women were older, more likely to report being postmenopausal, had completed less formal education, were more likely to be current smokers, and to report a history of douching compared with the other groups. Most participants (58 of 75, 77%) completed at least 10 of the scheduled study visits; 5 completed only the baseline visit (2 in the HIV+/HSV-2− group and 1 in each of the other groups).
Demographic and Clinical Characteristics of Study Participants
| Characteristic | HIV−/HSV-2− | HIV−/HSV-2+ | HIV+/HSV-2− | HIV+/HSV-2+ | P Value |
|---|---|---|---|---|---|
| (n = 15) | (n = 15) | (n = 15) | (n = 30) | ||
| Age (years), mean ± SD | 36 ± 9.2 | 39.4 ± 8.2 | 32.8 ± 10.5 | 46.2 ± 10.5 | <.01 |
| Race: White, Black, Other, Unknown | 4, 7, 4, 0 | 4, 7, 4, 0 | 1, 6, 6, 2 | 4, 18, 6, 2 | .46 |
| Ethnicity: Hispanic, Non-Hispanic | 4, 11 | 6, 9 | 7, 8 | 9, 21 | .60 |
| Education: <High school | 1 (7) | 1 (7) | 2 (13) | 9 (30) | .04 |
| High school | 3 (20) | 4 (27) | 4 (27) | 10 (33) | |
| Some college | 3 (20) | 7 (46) | 7 (46) | 8 (27) | |
| College or graduate | 8 (53) | 3 (20) | 2 (13) | 3 (10) | |
| Current smoking | 3 (20) | 4 (27) | 7 (47) | 17 (57) | .06 |
| Hormonal contraception | 2 (13) | 0 | 2 (13) | 3 (10) | .55 |
| Postmenopausal | 1 (7) | 2 (13) | 1 (7) | 10 (30) | .06 |
| History of douching | 3 (20) | 3 (20) | 6 (40) | 19 (63) | .01 |
| Vaginal pH | 4.5 (4.4, 4.7) | 4.6 (4.4, 4.9) | 4.9 (4.6, 5.5) | 5.2 (4.7, 5.5) | <.001 |
| Nugent score: 0–3 | 9 (60) | 8 (57) | 3 (20) | 5 (29) | .14 |
| 4–6 | 2 (13) | 1 (7) | 6 (40) | 3 (18) | |
| 7–10 | 4 (27) | 5 (36) | 6 (40) | 9 (53) | |
| HSV-1 IgG seropositive | 12 (80) | 8 (53) | 10 (67) | 19 (63) | .49 |
| ART use | 12 (80) | 26 (87) | .56 | ||
| CD4 count (cells/μL) | 499 (386, 665) | 512 (282, 729) | .80 | ||
| HIV-1 RNA undetectable in plasma | 8 (53) | 13 (45) | .59 | ||
| HIV-1 RNA detectable in CVL | 4 (27) | 12 (40) | .51 | ||
| Symptomatic HSV outbreaksa | .04 | ||||
| 0 (no. of outbreaks per participant) | 4 | 10 | |||
| 1 | 8 | 6 | |||
| 2 | 2 | 7 | |||
| 3 | 0 | 5 | |||
| 4 | 0 | 1 | |||
| Total number of outbreaks | 12 | 39 | |||
| HSV DNA detected (enrollment) | 1/12 (8%) | 7/26 (27%) | .38 |
Abbreviations: ART, antiretroviral therapy; CVL, cervicovaginal lavage; DNA, deoxyribonucleic acid; HSV, herpes simplex virus; IgG, immunoglobulin G; RNA, ribonucleic acid; SD, standard deviation; VL, viral load.
NOTE: Categorical variables reported as n (%) and continuous variables reported as median (25th%, 75th%), unless otherwise noted.
aThe HSV genital outbreaks were compared between the 2 groups by Cochran Armitage test for trend.
Although not statistically significantly different, the percentage of women with HIV detected in CVL was higher in the HIV+/HSV-2+ compared with the HIV+/HSV-2− women (12 of 30 [40%] versus 4 of 15 [27%], P = .51), and, conversely, the percentage of women with HSV-2 DNA detected in vaginal swabs at enrollment was higher in the HIV+ compared with HIV− (7 of 26 [27%] versus 1 of 12 [8%], P = .38). Clinical HSV-2 recurrences (primarily on the labia or buttocks) were observed in a similar proportion of HIV+ and HIV-1− women (19 of 29 versus 10 of 14, respectively) during the study, but the total number of outbreaks was greater in the HIV+ compared with HIV− women (39 versus 12). Specifically, among the 19 HIV+ women with recurrences, 1 had 4 outbreaks, 5 had 3 outbreaks, 7 had 2 outbreaks, and 6 had 1 outbreak compared with the 10 HIV− participants where 2 had 2 recurrences and 8 had 1 (P = .04) (Table 1).
Differences in Concentrations of Immune Mediators and Antimicrobial Activity
Cervicovaginal lavage concentrations of mediators were compared at enrollment or, for the 4 HIV+/HSV-2+ who had an HSV-2 outbreak at enrollment, using CVL from visit 7. One HIV−/HSV-2+ participant with an outbreak at enrollment did not have a subsequent CVL available for comparison. There was no difference in total protein; however, significant differences in CVL concentrations of IFN-γ (P = .002), TNF-α (P = .03), HBD1 (P = .001), SLPI (P = .01), and lysozyme (P = .03) were observed across the 4 groups (Table 2). To estimate whether differences were associated with HIV, HSV-2, or their interaction, regression models were first fitted to the data after adjusting for age, current smoking, and douching. When no statistically significant interaction was observed, the effects of HIV and HSV-2 were estimated from a model without the interaction term. Higher concentrations of IFN-γ were associated with HIV (P = .006), whereas higher levels of IgG (P = .03) and lower levels of HBD1 (P = .02) were associated with HSV-2 (Table 2). Because a greater proportion of the HIIV+/HSV-2+ women were postmenopausal, a sensitivity analysis excluding those women was also performed. Overall, the results were similar, although TNF-α and SLPI were less significant in this analysis, which may reflect the smaller sample size (Supplementary Table 1).
Comparison of Concentrations of Immune Mediators and Antimicrobial Activity Between Groups
| Proteins and Anti-microbial activity | Group 1 | Group 2 | Group 3 | Group 4 | P Valueb | P Value Adjusted for Age, Smoking and Douchinga | ||
|---|---|---|---|---|---|---|---|---|
| HIV−/HSV-2− | HIV−/HSV-2a | HIVa/HSV-2− | HIVa/HSV-2a | |||||
| Median (IQR) | Median (IQR) | Median (IQR) | Median (IQR) | HIV | HSV | Interaction | ||
| Total Protein | 288 (144) | 384 (234) | 315 (366) | 309 (282) | .71 | 0.86 | 0.39 | 0.52 |
| IL-1ra | 9821.5 (4072.1) | 10 001.0 (3601.4) | 7552.0 (3917.1) | 9505.3 (4894.3) | .76 | 0.99 | 0.35 | 0.86 |
| IL-1α | 54.3 (113.4) | 66.5 (85.6) | 255.3 (423.2) | 82.7 (206.1) | .33 | 0.26 | 0.72 | 0.14 |
| IL-1β | 2.6 (11.8) | 5.1 (47.6) | 6.8 (27.9) | 3.9 (12.9) | .63 | 0.09 | 0.42 | 0.61 |
| IL-6 | 3.8 (10.5) | 3.6 (5.8) | 3.9 (11.5) | 2.2 (4.6) | .42 | 0.77 | 0.84 | 0.99 |
| IL-8 | 270.3 (849.1) | 468.0 (1757.2) | 379.4 (650.2) | 350.3 (993.6) | .77 | 0.98 | 0.83 | 0.50 |
| MIP-1α | 4.5 (5.1) | 5.8 (8.9) | 6.2 (8.2) | 5.7 (9.4) | .99 | 0.58 | 0.90 | 0.90 |
| MIP-1β | 2.3 (3.5) | 2.3 (3.2) | 6.7 (5.4) | 2.3 (3.0) | .66 | 0.41 | 0.87 | 0.64 |
| RANTES | 0.5 (1.3) | 1.2 (4.3) | 2.3 (9.1) | 1.9 (5.8) | .26 | 0.06 | 0.91 | 0.38 |
| IFN-γ | 0.1 (0.5) | 0.8 (2.9) | 1.7 (1.9) | 1.9 (3.1) | .002 | 0.006 | 0.09 | 0.41 |
| TNF-α | 0.1 (0.1) | 0.2 (0.5) | 0.5 (0.8) | 0.3 (0.7) | .03 | 0.16 | 0.15 | 0.69 |
| HBD1 | 3964 (8747) | 1478 (1645) | 1588 (2231) | 497 (981) | .001 | 0.15 | 0.02 | 0.98 |
| HBD2 | 3296 (14 110) | 1444 (6286) | 2031 (8192) | 1669 (5940) | .25 | 0.58 | 0.43 | 0.58 |
| HBD3 | 1420 (1664) | 1050 (4231) | 1886 (4670) | 420 (1147) | .08 | 0.11 | 0.20 | 0.46 |
| SLPI | 377 417 (899 489) | 157 128 (367 621) | 319 307 (505 209) | 173 853 (151 828) | .01 | 0.39 | 0.13 | 0.34 |
| HNP1–3 | 66 349 (156 503) | 102 284 (511 993) | 76 117 (371 280) | 157 342 (348 739) | .78 | 0.55 | 0.85 | 0.44 |
| Lysozyme | 443 (294) | 296 (319) | 270 (495) | 223 (226) | .03 | 0.08 | 0.19 | 0.93 |
| Lactoferrin | 2067 (1827) | 2500 (4308) | 897 (1760) | 1355 (3017) | .71 | 1.00 | 0.68 | 0.83 |
| IgG | 6931 (14 107) | 21 617 (27 283) | 6003 (6057) | 12 731 (20 891) | .16 | 0.91 | 0.03 | 0.75 |
| IgA | 2685 (3089) | 2895 (9375) | 2002 (1595) | 2798 (6029) | .61 | 0.43 | 0.31 | 0.41 |
| Anti-HIV | 23.5 (55.3) | 19.5 (70.0) | 45 (50.8) | 70.6 (35.5) | .004 | 0.12 | 0.13 | 0.32 |
| Anti-HSV | 20.5 (40.0) | 47.0 (20.0) | 19.5 (30.6) | 19.5 (50.5) | .05 | 0.17 | 0.19 | 0,23 |
| Anti-E coli | 30.0 (74.5) | 47.0 (67.0) | 20.0 (33.0) | 31.5 (45.5) | .49 | 0.78 | 0.30 | 0.98 |
Abbreviations: E coli, Escherichia coli; HBD, human beta defensin; HIV, human immunodeficiency virus; HNP, human neutrophil peptide; HSV, herpes simplex virus; IFN, interferon; Ig, immunoglobulin; IL, interleukin; IQR, interquartile range; MIP, macrophage inflammatory protein; SLPI, secretory leukocyte protease inhibitor; TNF, tumor necrosis factor.
NOTE: Concentrations of proteins are median (IQR) in μg/mL for total protein and pg/mL for all others. Antimicrobial activity is the mean percentage inhibition with standard deviations.
aRegression for log-transformed immune mediators with adjustment for age, smoking, and douching and testing main and interaction effects of HIV and HSV-2.
bKruskal-Wallis rank-sum test; bolded P value indicate P < 0.05.
Antimicrobial Activity of Cervicovaginal Lavage
The ability of CVL to inhibit or enhance HIV and HSV-2 infection of cells or growth of E coli when added to cultures was quantified (Figure 1 and Table 2). The mean percentage inhibition of HIV differed across the groups (P = .004; Kruskal-Wallis), was highest in the HIV+/HSV-2+, and correlated only weakly (rho <0.2) with CVL protein or any of the individual mediators. The mean percentage inhibition of HSV-2 was highest in the HIV−/HSV-2+ women across the 4 groups (P = .05) and when compared with the HIV+/HSV-2+ women, suggesting that HIV may be associated with loss of this activity. The anti-HSV-2 activity correlated modestly (rho >0.30) with total protein (r = 0.44), HNP1-3 (r = 0.35), lysozyme (r = 0.47), IgG (r = 0.45), IgA (r = 0.32), and IL-8 (r = 0.41) (P < .00001). There were no differences across the groups in E coli inhibitory activity, which correlated modestly with total protein (r = 0.48), lysozyme (r = 0.34), IgG (r = 0.33), and IgA (r = 0.288) (P < .001) and negatively with Nugent score (r = −0.254; P = .002).
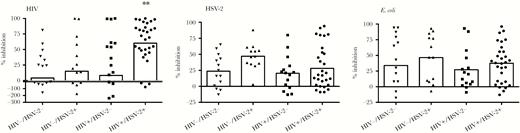
Differences in antimicrobial activity of cervicovaginal lavage (CVL) in human immunodeficiency virus (HIV) and/or herpes simplex virus type 2 (HSV-2) seropositive women. Scatter dot plots showing the percentage inhibition of (A) HIV infection of TZM-bl cells, (B) HSV-2 infection of Vero cells, and (C) Escherichia coli growth in the presence of cervicovaginal lavage fluid relative to cells treated with control buffer. Values greater than 100% are indicative of enhancement of infection. Each individual point indicates results from duplicate wells for a single participant; the bar indicates the mean value for the group. The asterisk indicates P = .0049 comparing anti-HIV activity of CVL in HIV+/HSV-2+ versus HIV−/HSV-2− controls (Kruskal-Wallis with Dunn’s multiple comparisons).
Repeated Measures Over Time
We conducted an analysis of repeated measures over the course of the study for the effects of HIV or HSV-2 on immune mediators and antimicrobial activity and comparing outbreak and non-outbreak visits (Supplementary Table 2). The ICCs were relatively high except for anti-HIV activity, which showed substantial variability (ICC = 0.28). The repeated measure model strengthened the association between HIV and/or HSV-2 on several mucosal markers. After adjusting for age and smoking, higher levels of IFN-γ (P = .001) and RANTES (P = .019) and lower levels of lysozyme (P = .032) and anti-HSV activity (P = .02) were observed in association with HIV, whereas lower levels of HBD-1 were associated with both HIV and HSV-2 (P = .042 and P = .023, respectively). There were no significant differences in non-outbreak versus outbreak visits in the unadjusted or adjusted model.
Human Immunodeficiency Virus/Herpes Simplex Virus Dual Infection Is Associated With a More Diverse Microbiome
A cross-sectional comparison of the vaginal microbiome was conducted using the enrollment swab or, for the 4 HIV+/HSV-2+ and 1 HIV−/HSV-2+ who had an outbreak at enrollment, a swab from Visit 10 (n = 4) or Visit 4 (n = 1). Samples with at least 2500 high-quality reads were included in the analysis (n = 21 HIV+/HSV-2+, n = 12 HIV+/HSV-2−, n = 12 HIV−/HSV-2+, and n = 13 double negative controls) (Figure 2). There were significant differences in alpha diversity (Simpson index) among the 4 groups (P = .0046; Kruskal-Wallis) (Figure 3) and, specifically, when comparing the HIV+/HSV-2+ to HIV−/HSV-2− controls or to the HIV−/HSV-2+ group (P = .02 and P = .03, respectively, post hoc pairwise comparison with false discovery rate adjustment). No difference in beta-diversity was observed.
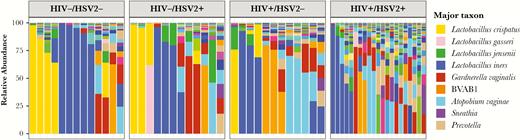
Vaginal microbiome differs in dually infected women. Stacked bar plots showing vaginal microbial community profiles from samples within the 4 groups human immunodeficiency virus (HIV)−/herpes simplex virus type 2− (HSV-2−), HIV−/HSV-2+, HIV+/HSV-2−, and HIV+/HSV-2+ in the cross-sectional cohort. The color legend only shows selected taxons with a total of 197 species plotted. Samples are grouped by the most abundant species, and those within each community group are clustered on bray distances using Ward’s method. The distances were calculated using vegan R package and the figure was prepared using ggplot2.
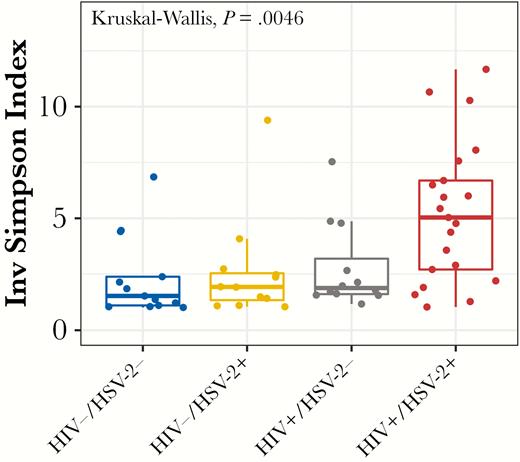
Alpha diversity is significantly higher in human immunodeficiency virus (HIV)+/herpes simplex virus type 2+ (HSV-2+) women. Boxplot showing differences in alpha diversity measures within each group of the cross-sectional cohort. Alpha diversity was measured as the inverse Simpson index, which considers the richness as well as the abundance of species within the sample. The diversity is significantly different among the groups (Kruskal-Wallis, P = .0046), with post hoc pairwise comparisons indicating significantly higher diversity in the HIV+/HSV-2+ group compared with HIV−/HSV-2− and HIV−/HSV-2+ groups (P = .02 and P = .03, respectively, false discovery rate adjustments).
Among 63 bacteria with a relative abundance >10% in at least 2% of samples, there were significant species differences comparing HIV+/HSV-2+ to HIV−/HSV-2− (Figure 4A) and compared with HIV−/HSV-2+ (Figure 4B). Specifically, there was a decrease in L crispatus and, conversely, increases in several bacterial vaginosis (BV)-associated species including Atopobium, Prevotella, Finegoldia, and Clostridiales in HIV+ compared with HIV− women. After adjustment for age, smoking, and douching, a regression model indicated that the decrease in L crispatus and increase in Finegoldia were associated with HIV, whereas the increase in Clostridiaceae.1.OTU17 was associated with HSV-2 (all P = .04) (Supplemental Table 3).
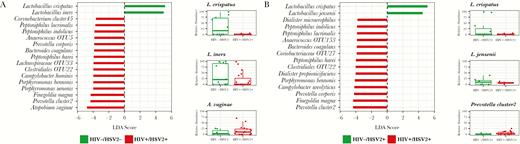
Statistical association analysis using linear discriminant analysis effect size (LefSe). Bacterial species with significantly differential abundance between dually infected human immunodeficiency virus (HIV)+/herpes simplex virus type 2+ (HSV-2+) and HIV−/HSV-2− women (A), and HIV−/HSV-2+ women (B) were identified using LEfSe. Features with linear discriminant analysis (LDA) score greater than 3.0 are shown. The inner boxplots show relative abundance of select species within groups compared by LEfSe.
Repeated analysis demonstrated high ICC for most of the bacteria (Supplemental Table 4) as well as for vaginal pH (ICC = 0.92) and Nugent scores (ICC = 0.76). When the relative predominance of specific species was assessed for its association with HIV and/or HSV, and after adjusting for age and smoking, most of the changes were associated with HIV. Specifically, lower levels of L crispatus cluster and higher levels of BV-associated species were observed. There was little difference comparing outbreak to non-outbreak visits except for lower levels of L jensenii in the outbreak compared with non-outbreak visits (P = .03) (Supplementary Table 4). There were also no significant differences in mediators or microbiota in the HIV+/HSV-2+ women who did nor did not have HSV DNA detected in vaginal swabs (Supplementary Tables 5 and 6).
DISCUSSION
The high prevalence of HSV-2 in sub-Saharan Africa has been suggested to contribute more than any other factor to HIV transmission [28, 29]. In the current study, we explored the impact of HSV-2 on the cervicovaginal mucosa and identified modest increases in select inflammatory cytokines, decreases in antimicrobial proteins, and alterations in the vaginal microbiome in HSV-2+ women with the most significant differences observed comparing dually seropositive to dually seronegative women. These findings support the contention that HIV and HSV-2 coinfection negatively affects the female genital tract mucosal environment.
Several of the findings were predicted by preclinical studies. For example, studies with epithelial or immune cells have shown that HSV-2 triggers release of inflammatory cytokines such as TNF-α [30] and downregulates SLPI, which has inhibitory activity against HIV and HSV [31–34]. Similarly, in a humanized mouse model of persistent HIV-infection (JR-CSF/hu-cycT1 mice), intravaginal HSV-2 infection triggered an increase in inflammatory cells and cytokines, a decrease in SLPI, and an increase in HIV genital tract viral loads [35].
We also quantified the ability of CVL to inhibit E coli growth and to reduce HIV or HSV-2 infection of cells in culture. These assays may reflect the cumulative effects of soluble molecules produced by microbes or human cells, presence of HIV- or HSV-specific antibodies, and antiviral drugs. The mean percentage inhibition of HIV was significantly higher in CVL obtained from HIV+ compared with HIV− women independent of HSV-2 serostatus, but it did not correlate with any of the immune molecules, suggesting that the higher activity likely reflects antiretroviral drugs and/or HIV-specific antibodies. In contrast, the anti-HSV activity of CVL, which correlated in the current and in prior studies with several immune molecules [36], was lower in the HIV+ compared with HIV− women. The lower HSV-2 inhibitory activity could contribute to the increased number of outbreaks observed in HIV+ women. Although the E coli inhibitory activity did not differ between the 4 groups, the overall activity was lower than previously reported in healthy HIV− women and may reflect the finding that only 4 of 13 (30.7%) of the HIV−/HSV-2− had an L crispatus-dominant and none had an L jensenii-dominant microbiome. Prior studies suggest that E coli inhibitory activity is mediated, in part, by molecules secreted by these lactobacilli and is decreased in BV [13, 37, 38].
One of the most striking findings was the difference in vaginal microbial alpha diversity. The greatest differences were observed comparing the dually infected women to dually seronegative controls, suggesting a combined effect of HIV and HSV-2. None of the HIV+/HSV-2+ women had an L crispatus or L jensenii-dominant microbiome. The lack of lactobacillus dominance across the overall cohort may reflect the study population. Combining data from multiple studies indicates that although ~90% of healthy white North American women have vaginal bacterial communities dominated by lactobacilli, this decreases to 60%–65% of US black women and ranges from 37% to 62% of black women in sub-Saharan Africa [12, 26, 39–41]. Dysbiosis in the HIV+/HSV-2+ women may also have contributed to the modest differences in immune molecules. An increase in genital tract inflammatory cytokines and a decrease in SLPI and defensins have been described in patients with BV, although most studies have been conducted in HIV− women [40, 42–44].
Vaginal dysbiosis has also been linked to HIV acquisition and transmission. However, there are few studies addressing the impact of HSV-2 on vaginal microbiome and, to our knowledge, no prior studies on HIV-HSV-2 coinfection. Several studies indicate that HSV-2 is associated with an increased risk of BV and, conversely, that BV is associated with increased HSV-2 shedding [45, 46]. Mechanistically, a more diverse, anaerobic microbiome may be associated with increased local inflammation, recruitment of CD4+ T cells (targets of HIV infection), loss of innate defensins, and a decrease in the epithelial barrier [12]. The specific species linked to the inflammatory response have varied across studies, but they include several identified in the current study [40, 47].
The observed differences in microbiome and in concentrations of select immune mediators in the dually infected compared with HIV+/HSV-2− women did not translate into a statistically significant increase in HIV shedding or PVL, although the percentage of women with HIV detected in CVL was higher in the HSV-2+ compared with HSV-2− women. Similarly, there were no significant differences in HSV-2 shedding at enrollment, but the total number of outbreaks was greater in the HIV+ compared with HIV− participants. These findings likely reflect the inclusion of women with low or fully suppressed HIV PVL on ART. We speculate that, in the absence of ART (or incomplete adherence), HSV-2 coinfection may contribute to HIV shedding.
CONCLUSIONS
Limitations of the current study include the small sample size, infrequent sampling, and relatively short study period. However, results support the premise that HIV and HSV-2 have negative effects on mucosal immunity and highlight the importance of developing strategies to prevent both viral infections. This notion is further underscored by studies demonstrating adverse effects of HSV-2 on peripheral blood immune cell populations and possibly latent HIV viral reservoirs [48].
SUPPLEMENTARY DATA
Supplementary materials are available at The Journal of Infectious Diseases online. Consisting of data provided by the authors to benefit the reader, the posted materials are not copyedited and are the sole responsibility of the authors, so questions or comments should be addressed to the corresponding author.
Notes
Acknowledgments. We thank Jenny Stanwix for assistance with recruitment and the Nucleic Acids Research Facilities at Virginia Commonwealth University for performing the sequencing.
Financial support. This work was funded by the National Institutes of Health (Grants U01 AI035004, R01 AI065309, UL1 TR00193, and P30 AI124414).
Potential conflicts of interest. All authors: No reported conflicts of interest. All authors have submitted the ICMJE Form for Disclosure of Potential Conflicts of Interest.
References
FDA Cleared IMDx HSV-1/2 for Abbott m2000 assay. June 2014;1–18. https://www.accessdata.fda.gov/cdrh_docs/reviews/K140198.pdf.

