


Abstract
Cholera toxin (CT)–induced diarrhea is mediated by cyclic adenosine monophosphate (cAMP)–mediated active Cl– secretion via the cystic fibrosis transmembrane conductance regulator (CFTR). Although the constitutive activation of adenylyl cyclase (AC) in response to CT is due to adenosine diphosphate ribosylation of the small G protein α-subunit activating CFTR with consequent secretory diarrhea, the AC isoform(s) involved remain unknown.
We generated intestinal epithelial cell–specific adenylyl cyclase 6 (AC6) knockout mice to study its role in CT-induced diarrhea.
AC6 messenger RNA levels were the highest of all 9 membrane-bound AC isoforms in mouse intestinal epithelial cells. Intestinal epithelial-specific AC6 knockout mice (AC6loxloxVillinCre) had undetectable AC6 levels in small intestinal and colonic epithelial cells. No significant differences in fluid and food intake, plasma electrolytes, intestinal/colon anatomy and morphology, or fecal water content were observed between genotypes. Nevertheless, CT-induced fluid accumulation in vivo was completely absent in AC6loxloxVillinCre mice, associated with a lack of forskolin- and CT-induced changes in the short-circuit current (ISC) of the intestinal mucosa, impaired cAMP generation in acutely isolated small intestinal epithelial cells, and significantly impaired apical CFTR levels in response to forskolin.
AC6 is a novel target for the treatment of CT-induced diarrhea.
(.)
The second most common cause of death worldwide is infectious diarrhea. In developing countries, >20% of children younger than 5 years of age are affected, resulting in approximately 2.5 million deaths per year [1]. One of the major organisms causing infectious diarrhea is Vibrio cholerae, a bacterium that produces cholera toxin (CT), which consists of 1 A subunit (enzymatic) and 5 B subunits (required for receptor binding). After the entire toxin complex is endocytosed, the A subunit is cleaved from the rest of the toxin [2, 3]. Subsequently the A subunit moves retrograde in the endoplasmic reticulum and is refolded and released into the cytosol, where it induces adenosine diphosphate (ADP) ribosylation of the small G protein α-subunit, with consequent activation of an unknown adenylyl cyclase (AC) subtype. In vivo and ex vivo studies in mice, rabbits, and rats, as well as in vitro studies conducted in a variety of cell types, showed that CT-induced activation of AC(s) persistently increases cellular cyclic adenosine monophosphate (cAMP) levels [4]. Ultimately, this results in membrane targeting, phosphorylation, and activation of the cystic fibrosis transmembrane regulator (CFTR). These AC-mediated events increase the rate of epithelial Cl– secretion, which is followed by water secretion, and is the basis of the severe diarrhea [4]. Supporting this mechanism, CFTR knockout mice are partially resistant to CT-induced diarrhea [5] and small molecule CFTR inhibitors reduce fluid secretion in infectious secretory diarrheas [6].
Nine different membrane-bound AC isoforms (AC1–AC9) have been identified [7, 8]. We have examined in detail AC6 function in the kidney: Its high abundance correlates well to its essential contribution to various aspects of renal function, for example, water [9, 10] and electrolyte transport [11, 12] or acid-base homeostasis [13].
Based on the diverse functions of AC6 throughout the body [14], we speculated that AC6 is also important for intestinal function. To study this in isolation, we generated and characterized intestinal-specific AC6 knockout mice and assessed its phenotype with respect to CT-induced diarrhea. The results indicate that AC6 plays a major role in intestinal epithelial cell cAMP generation, CFTR trafficking, and cAMP-induced changes in short-circuit current (ISC). Importantly, intestinal-specific AC6 knockout mice are resistant to CT-induced diarrhea, indicating that AC6 is a potential new target for its rapid treatment.
MATERIALS AND METHODS
Animals
All animal experimentation was conducted in accordance with the Guide for Care and Use of Laboratory Animals (National Institutes of Health) and was approved by the University of South Florida Institutional Animal Care and Use Committee. By crossing transgenic mice in which the Adcy6 gene is flanked by loxP sites [15] (termed AC6loxlox) with mice expressing Cre recombinase under the regulatory element of the villin gene [16], we generated a novel conditional mouse model where AC6 was constitutively deleted only in intestinal epithelial cells (termed AC6loxloxVillinCre). Wild-type and AC6–/– mice (on a C57BL/6 background) were reproduced by heterozygote breeding [12]. Primer sequences for genotyping both lines have been previously published [10, 17]. Mice had free access to standard rodent diet (Harlan Teklad 2018) and tap water and were housed under a 12-hour:12-hour light:dark cycle. All experiments were performed on 3- to 6-month-old male mice. Mice of different genotypes, except for experiments where fluid and food intake were measured, were co-housed in the same cages within the facility to limit potential influence of gut microflora on observed phenotypes. The intestinal expression of AC6 was determined in “knock-in” mice (AC6–/–EGFP) where enhanced green fluorescent protein (EGFP) is only expressed in AC6-containing cells and thus acts as a surrogate marker of AC6 expression [18]. Labeling of EGFP in paraffin-embedded tissue was performed as previously described [13] using an anti-EGFP antibody (ab6673, Abcam).
Food/Fluid Intake and Blood and Urine Collection/Analysis
Food and fluid intake were determined in regular cages [11, 19]. Blood was collected from the retrobulbar plexus under brief isoflurane anesthesia. Blood chemistry was determined by a blood gas analyzer (OPTIMedical). Fecal water content in freshly defecated stool was calculated as the difference in fresh weight vs dry weight. Fecal dry weight was measured after 24 hours at 80°C.
Sealed Adult Mouse Model
CT- and 8-Br-cAMP–induced [20, 21] diarrhea in mice was performed as described elsewhere. In brief, the anus of mice was occluded with Vetbond (3M) and subsequently mice were gavaged with vehicle (10% sodium bicarbonate [NaHCO3], 0.3% of body weight [BW]), CT (10 µg, Sigma-Aldrich) or 8-Br-cAMP (40 mg/kg BW, Sigma-Aldrich). Mice were euthanized 6 hours after CT or 2 hours after 8-Br-cAMP exposure. Small intestines were removed, weighed, opened to remove the fluid, gently blotted dry, and weighed again. Fluid accumulation ratio was calculated from the ratio of small intestinal weight before fluid removal relative to small intestinal weight after fluid removal.
Morphological and Immunohistochemical Analysis of the Small Intestine and Colon
Small intestines and colons were collected (n = 6/genotype) and measured in length (cm) before flushing fecal contents with ice cold phosphate-buffered saline (PBS) [22, 23]. Tissue was fixed overnight in 4% paraformaldehyde, paraffin embedded, and sectioned at 4–6 μm. Sections were either stained with hematoxylin and eosin, stained for proliferating cell nuclear antigen (1:100; Invitrogen, for proliferation quantification), or stained for cleaved caspase-3 (1:100; Cell Signaling Technology, for apoptosis quantification). Apoptosis and proliferation were determined as described in detail previously [22].
Ussing Chamber Experiments
Mice were euthanized and the terminal ileum approximately 2 cm proximal to the ileocecal junction was removed and opened along the mesenteric border. Under a stereomicroscope, the tunica muscularis was stripped with fine forceps in ice cold Krebs buffer. The mucosa-submucosa preparation was mounted between 2 hemichambers with a 0.3 cm2 aperture (Physiologic Instruments). Chambers were bathed with serosal Krebs-Ringer solution (117 mmol/L sodium chloride [NaCl], 4.7 mmol/L potassium chloride [KCl], 1.2 mmol/L magnesium chloride [MgCl2], 1.2 mmol/L monosodium phosphate [NaH2PO4], 2.5 mmol/L calcium chloride [CaCl2], 25 mmol/L NaHCO3, 11 mmol/L glucose, and 10 µmol/L indomethacin) bubbled with 5% carbon dioxide/95% oxygen (O2) and luminal Krebs buffer solution (136 mmol/L NaCl, 2.6 mmol/L KCl, 1.8 mmol/L CaCl2, 10 mmol/L HEPES, and 11 mmol/L mannitol, pH 7.4) bubbled with 100% O2 in a volume of 4 mL each, and maintained at 37°C using a water-recirculating heating system as previously described [24]. The tissues were short-circuited by a voltage clamp (Physiologic Instruments) at zero potential difference with automatic compensation for solution resistance. ISC was measured continuously, with an increase of ISC indicating luminal-to-serosal current flow (eg, anion secretion). The current was recorded by the DataQ system (Physiologic Instruments). The tissues were stabilized for 30 minutes before either the effects of forskolin (1 µmol/L, serosal) or CT (10 µg/mL, mucosal) were investigated.
Isolation of Intestinal Epithelial Cells
Freshly isolated epithelial cells prepared by calcium (Ca2+) chelation [25] are depleted of markers for connective tissue and smooth muscle [26]. In brief, after euthanasia the small intestine and colon were removed, flushed with ice cold PBS, and everted. One end was ligated, and the everted small intestine and colon were filled with Ca2+-free PBS containing 5 mmol/L ethylenediaminetetraacetic acid. The inverted pieces were put in tubes on a rocking platform at 37°C for 15–20 minutes. The tubes were shaken vigorously to release the epithelial cells. After removal of sacs devoid of epithelial cells, tubes were centrifuged for 2 minutes at 500g to pellet the cells. Subsequently, cells were used for further analysis (as detailed below).
Cell Surface Biotinylation
Small intestine jejunal segments were carefully excised and flushed with ice cold PBS. Segments were everted, ligated at one end, filled with Ringer buffer (127 mmol/L NaCl; 10 mmol/L 4-(2-hydroxyethyl)piperazine-1-ethanesulfonic acid, N-(2-hydroxyethyl)piperazine-N′-(2-ethanesulfonic acid) [HEPES]; 5 mmol/L KCl; 5 mmol/L sodium [Na] pyruvate; 1 mmol/L MgCl2; 5 mmol/L glucose; and 2 mmol/L CaCl2, pH 7.4) and ligated at the other end. Loops were placed in Ringer buffer containing either vehicle, forskolin (1 µmol/L), or 8-Br cAMP (200 µmol/L) for 30 minutes at 37°C. For surface biotinylation, immediately after respective treatments, loops were incubated in ice-cold biotinylation buffer (10 mmol/L triethanolamine, 2 mmol/L CaCl2, and 125 mmol/L NaCl, pH 8.9) containing 1mg/mL EZ-Link Sulfo-NHS-SS-biotin reagent (Life Technologies) for 60 minutes at 4°C. Biotinylated surface proteins were isolated as previously described [27], resolved by sodium dodecyl sulfate–polyacrylamide gel electrophoresis and assessed by immunoblotting. The intracellular proteasome 20S protein was absent from the biotinylated pool, confirming specificity of this fraction for cell surface proteins (not shown).
Immunoblot Analysis
Acutely isolated intestinal epithelial cells were processed for immunoblotting as previously described [26]. Coomassie-stained gels were used to adjust for equal protein loading, with maximal deviations in total protein loading between samples on individual blots ± 10%. Sites of antibody reactivity were detected using enhanced chemiluminescence and signal intensity in specific bands was quantified using Image Studio Lite (Qiagen) densitometry analysis. Antibodies used were AC5/6 (sc-590, Santa Cruz, dilution 1:800), CFTR (ACL-006, Alomone Labs, dilution 1:2500), and anti-actin (A2228, Sigma). For biotin samples, the levels of biotinylated CFTR were normalized to the level of total cellular CFTR in each individual sample.
Reverse-Transcription Quantitative Polymerase Chain Reaction of AC Isoforms and Solute Transporters in Intestinal and Colonic Epithelial Cells
Total RNA from acutely isolated cells was extracted using Trizol reagent (Invitrogen) and reverse-transcription quantitative polymerase chain reaction (RT-qPCR) performed as previously described [28]. Primer sets and efficiency are shown in Supplementary Table 1.
Measurement of cAMP Concentrations in Freshly Isolated Intestinal Epithelial Cells
Enterocyte suspensions were stimulated with forskolin (10 µmol/L; Ascent Scientific), CT (10 µg/mL), or vehicle at 37°C in the presence of 0.5 mmol/L phosphodiesterase inhibitor 3-isobutyl-1-methylxanthine (pretreated for 10 minutes, Sigma-Aldrich). Reactions were terminated after 5 minutes of forskolin stimulation or after 60 minutes for vehicle and CT stimulation by the addition of ice cold 10% TCA (vol/vol). cAMP content was determined by enzyme-linked immunosorbent assay (Direct cAMP ELISA kit, Enzo Life Sciences). Protein concentration was determined using a Pierce protein assay (Thermo Scientific).
Statistical Analysis
Unpaired Student t test or Mann–Whitney U test was performed as appropriate to analyze for statistical differences between groups. One-way analysis of variance (ANOVA) or 2-way repeated-measures ANOVA followed by Dunnett and Tukey multiple comparison tests, respectively, were used to test for significant differences between genotype and experimental conditions. Significance was considered at P < .05.
RESULTS
AC6 Is the Highest Expressed AC Isoform in Intestinal Epithelial Cells
RT-qPCR profiling of acutely isolated small intestinal epithelial cells (IECs) (Figure 1A) or colonic epithelial cells (CECs) (Figure 1B) determined that AC6 is the most abundantly expressed AC isoform. AC6 expression levels were approximately 10- to 1000-fold higher than any of the other AC isoforms, with a variable profile between IECs or CECs. Our unpublished observations indicated that commercial AC6 antibodies are unsuitable for immunolabeling; we thus confirmed that AC6 was only expressed in intestinal epithelial cells by examining AC6 expression patterns using AC6–/–EGFP mice. In these mice, EGFP expression is a surrogate marker of AC6 expression [18]. Immunolabeling for EGFP was undetectable in sections from control mice (Figure 1C), whereas EGFP was strongly expressed in epithelial cells of the small intestine and colon in AC6–/–EGFP mice (Figure 1C).
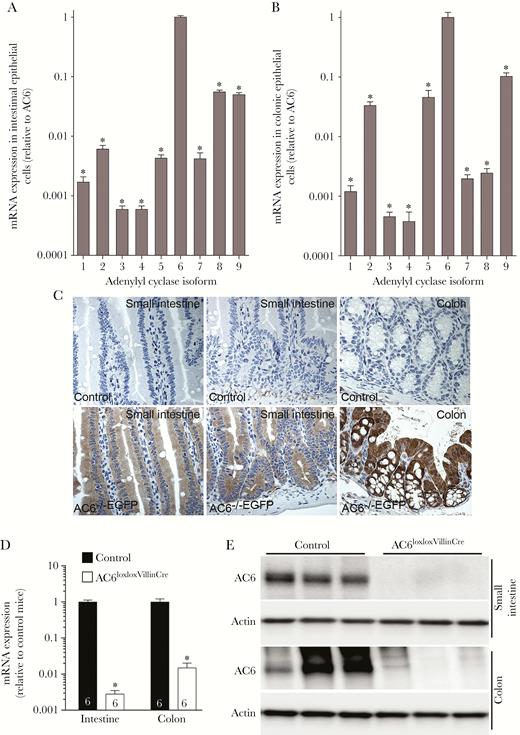
Intestinal epithelial cell–specific adenylyl cyclase 6 (AC6) knockout mice. Messenger RNA (mRNA) expression of AC isoforms (1–9) in epithelial cells isolated from the small intestine (A) or colon (B) of AC6loxlox mice (n = 5). Data were analyzed by 1-way analysis of variance followed by Dunnett multiple comparison test. *P < .0001 relative to AC6. C, Representative immunohistochemistry images from AC6–/–EGFP mouse intestine stained with an anti–enhanced green fluorescent protein (EGFP) antibody (n = 4/genotype). EGFP (surrogate marker of AC6 expression) was observed in all epithelial cells of the small intestine and colon. D, mRNA expression of AC6 in epithelial cells isolated from the intestine or colon of control (AC6loxlox) or AC6loxloxVillinCre mice (numbers refer to ‘n’). Data were analyzed by an unpaired Student t test. *P < .005 relative to control. E, AC6 protein was virtually undetectable in epithelial cells isolated from the small intestine or colon of AC6loxloxVillinCre mice. Data are expressed as mean ± standard error of the mean.
Lack of AC6 in the Intestine Is Not Associated With Physiological Abnormalities
To study the physiological function of intestinal AC6, we generated a novel mouse model where AC6 was selectively deleted from intestinal epithelial cells using Cre recombinase under control of the the villin promoter (AC6loxloxVilllinCre). AC6loxloxVillinCre mice were born at predicted Mendelian frequencies, appeared grossly indistinguishable from control (AC6loxlox) mice, and developed normally. Confirming the model, messenger RNA (mRNA) and protein (Figure 1D and 1E) levels of AC6 in AC6loxloxVilllinCre mice were virtually undetectable in isolated IECs or CECs. Intestinal morphology in AC6loxloxVillinCre mice was largely normal (Supplementary Figure 1), with the overall length of the small intestine and colon (Figure 2A) and individual villus length and crypt depth not significantly different from control mice (Figure 2B). Quantification of epithelial cell proliferation (Figure 2C) and apoptosis (Figure 2D and 2E) was indistinguishable between genotypes. Under baseline conditions, fecal water content was similar between AC6loxloxVillinCre mice and controls (Figure 2F). Further physiological characterization did not show any significant differences in BW; fluid and food intake; plasma Na+, K+, Ca2+, phosphate, and H+ concentrations; or hematocrit (Figure 3A–H). RT-qPCR profiling of isolated IECs or CECs for major transport proteins important for maintaining body electrolyte homeostasis revealed minor differences. In the small intestine, glucose transporter (GLUT) 2, GLUT5, and CFTR levels were significantly lower in AC6loxloxVillinCre relative to control mice (Figure 3I), whereas in the colon levels of the α- and β-subunits of the epithelial sodium channel (ENaC) and CFTR were significantly lower.
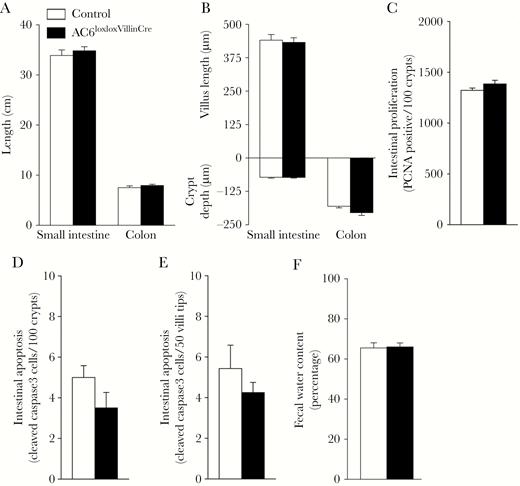
Normal intestinal morphology in the absence of adenylyl cyclase 6 (AC6) in intestinal epithelial cells. A, Length of the small intestine and colon is comparable between genotypes (n = 6/genotype). B, Villus length and crypt depth is not significantly different between genotypes (n = 6/genotype). C–F, Intestinal proliferation and apoptosis were not significantly different between genotypes (n = 6/genotype). G, Fecal water content was comparable between genotypes (n = 6/genotype). Data were analyzed by an unpaired Student t test and are expressed as mean ± standard error of the mean. Abbreviations: AC, adenylyl cyclase; PCNA, proliferating cell nuclear antigen.
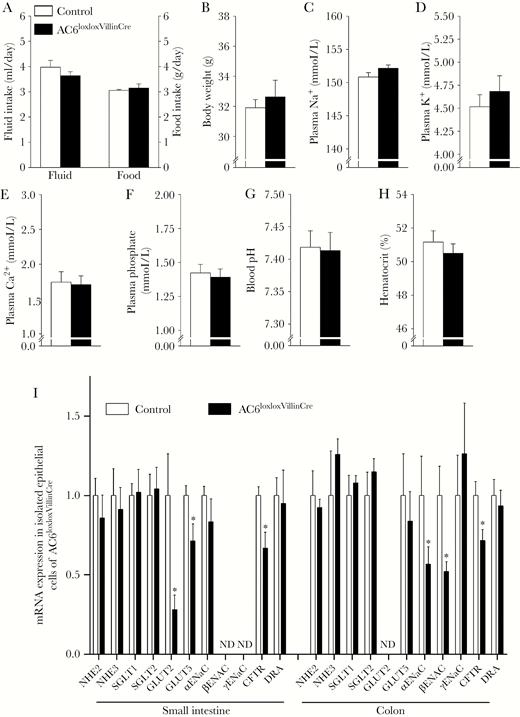
Lack of adenylyl cyclase 6 (AC6) in intestinal epithelial cells is not associated with an overt phenotype. Physiological analysis of control (AC6loxlox) and AC6loxloxVillinCre mice with free access to food and water in regular cages (averaged over a 6-day period). No significant differences between the genotypes were observed for fluid or food intake (A; note the use of 2 y-axes), body weight (B), plasma Na+ (C), plasma K+ (D), plasma Ca2+ (E), plasma phosphate (F), blood pH (G), or hematocrit (H) (n = 6/genotype). I, Messenger RNA (mRNA) expression of various transporters and channels in epithelial cells isolated from the small intestine or colon of control (AC6loxlox) or AC6loxloxVillinCre mice (n = 5/genotype). See Supplementary Table 1 for additional nomenclature details. ND = not detectable. All data were analyzed by unpaired Student t test; *P < .05 relative to control. Data are expressed as mean ± standard error of the mean.
Lack of AC6 Does Not Affect Baseline ISC but Mediates CT-Induced Changes in ISC
Ussing chamber experiments conducted on acutely isolated small intestinal mucosa showed no differences in ISC under baseline conditions (Figure 4A). The nonselective activator of adenylyl cyclases, forskolin, converts intestinal Cl– absorption into secretion [2], which can be measured by changes in ISC. Serosal addition of forskolin to the small intestinal mucosa isolated from control mice caused a rapid increase, followed by sustained elevation in ISC, whereas no response was observed in mucosa isolated from AC6loxloxVillinCre (representative traces in Figure 4B). ISC increased approximately 35 µA/cm2 in response to forskolin in control mice, whereas the response in AC6loxloxVillinCre mice was completely absent (Figure 4C). In similar experiments, ISC was increased in small intestinal mucosa from control mice in response to luminal CT (representative traces in Figure 4D, summary data in Figure 4E). In comparison to forskolin-induced changes in ISC, the effects of CT took on average 1 hour to develop, possibly as a consequence of CT endocytosis and the involved CFTR trafficking events required for CT action. The increased ISC observed in control mice (~40 µA/cm2) in response to CT was completely absent in AC6loxloxVillinCre mice (Figure 4D and 4E). The ISC response observed in AC6loxloxVillinCre was similar to that observed in AC6–/– mice, although the small number of AC6–/– mice examined prevents solid conclusions being drawn from this data.
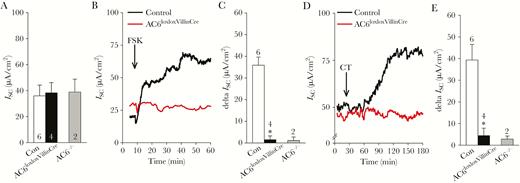
Adenylyl cyclase 6 (AC6) mediates forskolin (FSK) and cholera toxin (CT)–induced changes in short-circuit current (ISC) in intestinal mucosa. A, Ussing chamber experiments on small intestinal mucosa indicated that baseline ISC was not significantly different among control (Con, AC6loxlox) and AC6loxloxVillinCre mice. Data from a limited number of AC6–/– mice were also included as a comparison, but a statistical analysis of this data is excluded due to small number of observations. B, Representative traces of the effects of mucosal FSK (1 µmol/L) on ISC in control and AC6loxloxVillinCre mice. C, Summary of the FSK-induced changes in ISC in control and AC6loxloxVillinCre mice. D, Representative traces of the effects of luminal CT (10 µg/mL) on ISC in control and AC6loxloxVillinCre mice. E, Summary of the CT-induced changes in ISC in control and AC6loxloxVillinCre mice. Numbers associated to individual bars represent sample size “n.” Data were analyzed by unpaired Student t test. *P < .05 vs control. Data are expressed as mean ± standard error of the mean, except for AC6–/– mice (expressed as mean ± standard deviation).
AC6 Mediates In Vivo Fluid Accumulation in Response to CT
The “sealed” adult mouse model [20] was utilized to determine if CT-induced fluid secretion is mediated by AC6 in vivo. In control mice, oral gavage of CT increased the fluid accumulation ratio in the small intestine by approximately 1.5-fold compared to vehicle treatment (Figure 5A). CT-induced fluid accumulation was completely absent from AC6loxloxVillinCre and AC6–/– mice (Figure 5A). In contrast, similar experiments performed using the cell-permeable cAMP analogue 8-Br-cAMP increased small intestinal fluid accumulation in AC6loxloxVillinCre mice to similar levels as present in control mice in response to CT (Figure 5B), indicating that the lack of response to CT in AC6loxloxVillinCre is not due to a generalized dysfunction of the intestinal mucosa or differences in CFTR expression/function.
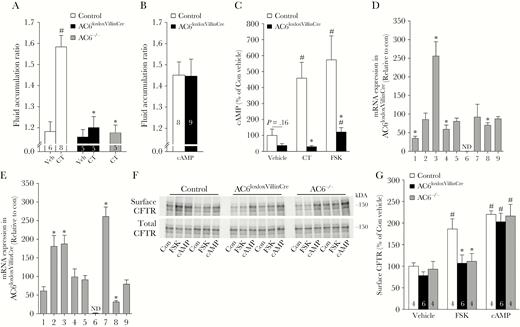
The effects of cholera toxin (CT) in vivo are mediated by adenylyl cyclase 6 (AC6). A, In the adult “sealed” mouse model, CT (10 µg/mouse) induced a significant increase in intestinal fluid accumulation in control (con, AC6loxlox), but not AC6loxloxVillinCre and AC6–/– mice. Data were analyzed by 1-way analysis of variance (ANOVA) followed by Tukey multiple comparison test. #P < .05 CT vs vehicle within genotype. *P < .05 between control and gene-modified mice within a treatment group. B, Fluid accumulation in control and AC6loxloxVillinCre mice could be stimulated to a similar degree using 8-Br–cyclic adenosine monophosphate (cAMP, 40 mg/kg). Data were analyzed by unpaired Student t test. C, In isolated intestinal epithelial cells from control mice (n = 4), forskolin (FSK, 1 µmol/L) or CT (10 µg/mL) significantly increased cAMP levels. Stimulation of cAMP formation by CT was completely absent and the response to FSK was severely attenuated in AC6loxloxVillinCre mice (n = 4). Data were analyzed by 1-way ANOVA followed by Tukey multiple comparison test. #P < .05 treatment vs vehicle within genotype. #P < .05 between control and gene-modified mice within a treatment group. *P < .05 relative to control mice. D, Relative messenger RNA (mRNA) expression levels of adenylyl cyclases in epithelial cells isolated from the intestine or colon (E) of control or AC6loxloxVillinCre mice (n = 5/genotype). ND = not detectable. Data were analyzed by unpaired Student t test. *P < .05 relative to control mice. F, Representative immunoblot of biotinylated (surface) and total cellular cystic fibrosis transmembrane conductance regulator (CFTR) levels in enterocytes isolated from control, AC6loxloxVilinCre, and AC6–/– mice following FSK (1 µmol/L) or 8-Br-cAMP (10 mmol/L) treatment. Each lane represents a sample from an individual mouse and shows the surface CFTR and total CFTR within the same preparation. G, Summary of ex vivo biotinylation studies. CTFR surface levels, relative to total CFTR levels within the same sample, were not different between genotypes upon vehicle application. FSK significantly increased surface CFTR in control but not genetically modified mice, whereas 8-Br-cAMP increased surface CFTR levels in AC6loxloxVillinCre and AC6–/– mice to levels observed in control mice. Numbers associated to individual bars represent sample size “n.” Data were analyzed by 1-way ANOVA followed by Tukey multiple comparison test. #P < .05 treatment vs vehicle within genotype. *P < .05 between control and gene-modified mice within a treatment group. Data are expressed as mean ± standard error of the mean.
AC6 is Essential for CT-Induced Increases in cAMP and CFTR Membrane Accumulation
CT increases intracellular cAMP levels in enterocytes [4]. To address whether the lack of CT-induced increases in ISC or intestinal fluid accumulation in AC6loxloxVillinCre are due to alterations in cAMP levels, the effects of CT or forskolin on acutely isolated IECs was examined. In IECs from control mice, both CT and forskolin significantly (4- to 6-fold) increased cAMP levels (Figure 5C). In contrast, in IECs acutely isolated from AC6loxloxVillinCre mice, CT had no significant effect on cAMP levels, whereas forskolin only a minor effect (Figure 5C). To investigate the basis for this forskolin response the expression levels of other adenylyl cyclase isoforms in AC6loxloxVillinCre mice was measured using RT-qPCR. In IECs of AC6loxloxVillinCre mice, AC1, AC4, and AC8 levels were lower, but AC3 levels were higher compared to control mice (Figure 5D). In CECs from AC6loxloxVillinCre mice, AC8 expression was significantly lower, whereas AC2, AC3, and AC7 levels were significantly higher (Figure 5E). Under normal conditions, the increased cAMP levels due to CT-induced protein kinase A activity increase CFTR phosphorylation with consequent increased Cl– channel open probability and CFTR cell surface stability [29]. To examine the latter condition, small intestinal loops from control, AC6loxloxVillinCre, and AC6–/– mice were biotinylated from the mucosal side ex vivo, and the levels of CFTR in the biotinylated fraction, relative to the total cellular levels of CFTR, were examined. Under baseline conditions, relative CFTR surface expression was not significantly different between genotypes (Figure 5F and 5G). Forskolin increased CFTR levels in the biotinylated pool of control animals approximately 2-fold, whereas it had no significant effects on relative CFTR surface expression in AC6loxloxVillinCre and AC6–/– mice. In contrast, direct activation of cAMP-dependent signaling pathways using 8-Br-cAMP increased relative CFTR surface expression equally in all genotypes (Figure 5F and 5G), indicating that CFTR trafficking is fully functional in the AC6 gene-modified mice.
DISCUSSION
In developed countries, secretory diarrhea is a frequent cause of physician visits and hospitalization, and current therapies such as fluid and electrolyte replacement or antibiotic treatment are often only partially effective in children and/or do not result in short-term cessation of symptoms [30, 31]. Therefore, identifying the underlying mechanisms of secretory diarrhea is essential to developing new strategies for rapid treatment of this condition. One of the major organisms implicated in the pathogenesis of secretory diarrhea is the cholera enterotoxin (CT). The major finding in this study is that in mice, intestinal epithelial cell AC6 activity is an essential component of the mechanism whereby CT causes secretory diarrhea, suggesting that selectively inhibiting AC6 would be a novel and promising avenue for pharmaceutical development to rapidly treat the secretory diarrhea associated with cholera infection.
Of the 9 membrane-bound adenylyl cyclases expressed in mouse intestinal epithelial cells, AC6 was the most abundant, suggesting a major functional relevance. To selectively assess AC6 only in intestinal epithelial cells, we generated a mouse model based on villin promoter-driven cre recombinase expression [16]. In this model AC6 was absent from the small intestine, and virtually undetectable in colon, matching endogenous expression of the villin gene used to drive cre recombinase expression [32]. Furthermore, although villin is expressed in the kidney proximal tubule [33], we saw no consistent evidence for cre recombinase expression in kidneys from our AC6loxloxVillinCre mice (data not shown), consistent with previous studies [16] and highlighting that the villin-driven cre expression is likely sensitive to organ-specific positional effects [32]. In line with AC6 being the major mediator of cAMP production in intestinal epithelial cells, forskolin-induced increases in cAMP were severely attenuated in intestinal epithelial cells isolated from AC6loxloxVillinCre mice. These alterations in cAMP could not be fully compensated for by 2- to 3-fold increases in other adenylyl cyclase isoforms, and are likely responsible for the observed reduction in cAMP-responsive GLUT2, GLUT5, and α/β-ENaC [34]. Despite this, under nonstressed conditions, AC6loxloxVillinCre mice had normal physiology. Therefore, either (i) other signaling pathways must play an important role under baseline conditions, (ii) compensatory signaling pathways such as the Ca2+ pathway could exist to modulate electrolyte transport pathways in the AC6loxloxVillinCre mice, or (iii) the basal levels of cAMP in the AC6loxloxVillinCre mice model are sufficient to maintain normal intestinal ion and water transport. The latter possibility is supported by the relatively normal ISC measurements in isolated mucosa from AC6–/– or AC6loxloxVillinCre mice under baseline conditions.
Fluid secretion by the mammalian intestine following CT involves osmotic water movement into the intestinal lumen subsequent to increased transepithelial Cl– secretion via CFTR [2]. The central finding of this study is that cAMP production via AC6 is essential for this process and is supported by (i) a lack of change in ISC in mucosa isolated from AC6loxloxVillinCre mice subsequent to CT treatment (indicating no net change in ion transport), and (ii) a complete absence of CT-induced fluid accumulation in AC6loxloxVillinCre and AC6–/– mice. Therefore, although other hormones and paracrine signaling molecules have been speculated to be involved in CT-induced effects, for example, serotonin [35] or prostaglandins [36] (partly excluded by our Ussing chamber results performed in the presence of a cyclooxygenase inhibitor), none of them can exert substantial effects in the absence of AC6.
Based on our results, pharmacological inhibition of AC6 by small molecules should be beneficial for rapid relief of CT-induced diarrhea. Although several previous strategies to alleviate the effects of CT have been proposed [37, 38], including inhibition of CFTR using small molecules [6, 39] or neutralization of cholera toxin with nanoparticle decoys [40], these approaches could be limited by potential cellular toxicity, biocompatibility, or cost-ineffective manufacturing. As AC6loxloxVillinCre mice did not present with altered epithelial cell integrity or morphology and whole body deletion of AC6 does not result in a major deleterious phenotype, targeting AC6 may even have distinct advantages to these other approaches for treatment of CT-induced secretory diarrhea. However, development of drugs against membrane-bound ACs has been limited and currently there are no selective membrane-permeable inhibitors of AC6 or clinically useful AC inhibitors in general [7]. Conversely, further work to determine if activation of AC6 may be beneficial to stimulate fluid secretion and treat certain forms of constipation would be informative, but currently specific activators of different AC isoforms are not available.
Supplementary Data
Supplementary materials are available at The Journal of Infectious Diseases online. Consisting of data provided by the authors to benefit the reader, the posted materials are not copyedited and are the sole responsibility of the authors, so questions or comments should be addressed to the corresponding author.
Notes
Author contributions. R. A. F., J. D. R., and T. R. conceived and designed the work. All animal experiments were performed in the laboratory of T. R., R. A. F., S. B. P., J. D. R., S. K. M,, I. K., Y. A., J. D. K., and T. R. contributed to the acquisition, analysis, or interpretation of data for the work. T. R. and R. A. F. drafted the work. All authors approved the final version of the manuscript; agree to be accountable for all aspects of the work in ensuring that questions related to the accuracy or integrity of any part of the work are appropriately investigated and resolved; and confirm that all persons designated as authors qualify for authorship and all those who qualify for authorship are listed.
Financial support. This work was supported by the National Institute of Diabetes and Digestive and Kidney Diseases (grant numbers R01DK110621 to T. R. and R01DK54221 to J. D. K.). Funding (to R. A. F) was also provided by the Lundbeckfonden, the Danish Council for Independent Research, and the Novo Nordisk Fonden. The work was further supported by the U.S. Department of Veterans Affairs 5I01BX001245 to J. D. K.
Potential conflicts of interest. All authors: No reported conflicts of interest. All authors have submitted the ICMJE Form for Disclosure of Potential Conflicts of Interest. Conflicts that the editors consider relevant to the content of the manuscript have been disclosed.
Presented in part: Experimental Biology, Chicago, Illinois, 22–26 April, 2017. Abstract 703.3.

