


Abstract
Viral loads (VLs) frequently are followed during treatment of symptomatic congenital cytomegalovirus disease, but their predictive value is unclear.
Post hoc analysis of 2 antiviral studies was performed. Seventy-three subjects were treated for 6 weeks and 47 subjects were treated for 6 months. Whole blood VL was determined by real-time polymerase chain reaction before and during therapy.
Higher baseline VL was associated with central nervous system involvement (3.82 log, range 1–5.65 vs 3.32 log, range 1–5.36; P = .001), thrombocytopenia (3.68 log, range 1–5.65 vs 3.43 log, range 1–5.36; P = .03), and transaminitis at presentation (3.73 log, range 1–5.60 vs 3.39 log, range 1–5.65; P = .009), but with overlap in the amount of virus detected between groups. In subjects treated for 6 months, lower VL at presentation correlated with better hearing outcomes at 12 months, but VL breakpoints predictive of hearing loss were not identified. Sustained viral suppression during 6 months of therapy correlated with better hearing outcomes at 6, 12, and 24 months (P = .01, P = .0007, P = .04), but a majority without viral suppression still had improved hearing.
In infants with symptomatic congenital cytomegalovirus disease, higher whole blood VL before initiation of antiviral therapy has no clinically meaningful predictive value for long-term outcomes.
Congenital cytomegalovirus (CMV) infection affects 0.6%–0.7% of live births in developed countries [1–3], and it is the most frequent viral cause of neurodevelopmental delay and the leading nongenetic cause of sensorineural hearing loss (SNHL) in children [3–6]. Approximately 10%–15% of infected infants are symptomatic at birth, and 40%–60% of these infants develop long-term neurosensory sequelae [2–4, 6].
The pathogenesis of CMV-related sequelae, and specifically of SNHL, is incompletely understood. Persistent viral replication in the inner ear structures may play a role [7, 8], but testing such a hypothesis is challenging. The largest available series that retrospectively explored the role of CMV detection in the cerebrospinal fluid (CSF) failed to find a correlation between positive CMV CSF polymerase chain reaction (PCR) and long-term hearing and neurological outcomes [9]. Some studies suggested that higher blood viral load in early infancy may be associated with SNHL [8, 10, 11], but other studies have not identified such an association [12, 13]. More importantly, most of these studies report single measurements of viral load rather than longitudinal monitoring.
The Collaborative Antiviral Study Group (CASG) has conducted a series of studies funded by the National Institute of Allergy and Infectious Disease (NIAID) to assess safety and efficacy of valganciclovir (VGCV) for the treatment of symptomatic congenital CMV disease [14, 15]. In these studies, samples of whole blood were prospectively collected for determination of quantitative CMV deoxyribonucleic acid (DNA) load, constituting the largest available dataset of blood viral load in symptomatic CMV-infected infants in the world. In the current study, we hypothesized that a higher viral load would be associated with worse hearing outcomes. To address this, we explored the correlation between blood viral load before treatment, its changes during the treatment period, and clinical findings at both presentation and follow-up. The effect of intravenous ganciclovir (GCV) and oral VGCV on blood viral load changes was also compared.
MATERIALS AND METHODS
Study Population
From 2002 to 2013, 120 subjects were treated in 2 prospective CASG investigations evaluating VGCV in infants with symptomatic congenital CMV disease, with therapy beginning within the first month of life [14, 15]. The first study was a phase I/II pharmacokinetic/pharmacodynamic investigation, which enrolled 24 subjects [14]. Study participants received 6 weeks of antiviral therapy consisting of GCV followed by VGCV. The second study was a phase III randomized, controlled trial of 6 weeks (n = 49) versus 6 months (n = 47) of oral VGCV [15]. The entry criteria for both studies were identical, with all participants having virologically confirmed congenital CMV infection, an age of ≤1 month at initiation of antiviral therapy, and a gestational age of ≥32 weeks. Symptomatic infection was defined as the presence of 1 or more of the following: thrombocytopenia, petechiae, hepatomegaly, splenomegaly, intrauterine growth restriction (IUGR), hepatitis (as denoted by elevated transaminases and/or bilirubin levels), or central nervous system (CNS) involvement (as denoted by 1 or more of microcephaly, neuroimaging abnormalities indicative of CMV infection, chorioretinitis, SNHL, abnormal CSF indices, and/or detection of CMV DNA in CSF).
All 24 participants of the phase I/II study and the 96 randomized subjects of the phase III study (thus, 73 subjects treated for 6 weeks and 47 subjects treated for 6 months) constituted the study population of this post hoc analysis. Blood samples for CMV load were taken at enrollment before administration of antiviral therapy and were defined as baseline samples. Blood samples for CMV load were then taken on study days 7, 14, 28, 42, 56, and study month 6 for participants in both studies. Participants of the phase III study also had CMV load assessment by PCR on study days 70 and 84 and study months 4, 5, and 7. The original studies and this post hoc analysis were approved by the University of Alabama at Birmingham Institutional Review Board.
Audiological and Neurodevelopmental Assessment
Audiological Assessments
Brain-stem auditory evoked response (BSER) was assessed at enrollment, and BSER or visual-reinforcement audiometry was performed at 6, 12, and 24 months. Hearing thresholds were defined as follows: 0–20 decibels (dB) normal hearing; 21–45 dB mild hearing loss; 46–70 dB moderate hearing loss; ≥71 dB severe hearing loss. Classifications of hearing outcome were done both on the best evaluable ear (best-ear assessment) and on total number of evaluable ears (total-ear assessment), as previously described [15].
Neurodevelopmental Assessments
Neurodevelopmental outcomes were assessed by a neuropsychologist at 12 and 24 months by using the Bayley Scales of Infants and Toddler Development, second edition (Bayley-II) for the phase I/II study participants [16] and third edition (Bayley-III) for the phase III study participants [17].
Real-Time Polymerase Chain Reaction
Assessment of CMV load in whole blood was conducted at the CASG Central Laboratory. The CMV primers were selected from the highly conserved immediate early 2 exon 5 region (forward primer, GAG CCC GAC TTT ACC ATC CA; reverse primer, CAG CCG GCG GTA TCG A; and probe, VIC-ACC GCA ACA AGA TMGBNFQ). The real-time PCR assay was performed at the CASG Central Laboratory, as previously described [12]. Viral load was expressed as the number of log10 genome equivalent (ge)/mL. The detection limit of the real-time PCR assay was 100 ge/mL of sample (2 log). To aid the analyses, values below the detection limit were arbitrarily replaced by 10 because it provides a log value of 1.
Data Analyses
Results of the real-time PCR were merged with the data from the 2 previous studies. The association between baseline viral load and clinical and laboratory parameters at presentation was investigated by Wilcoxon two-samples test. The correlation between baseline viral load and neurological outcomes was analyzed separately by month (12 and 24) and treatment group (6-week or 6-month) and the Bayley Scales used (Bayley-II or Bayley-III) using general linear model regression. Hearing outcomes were analyzed on the basis of 2 sets of binary outcomes: (1) improved hearing or maintenance of normal hearing from baseline to follow-up (“Improved/protected”) versus worsened hearing or maintenance of the same degree of hearing loss from baseline to follow-up (“Others”); and (2) worsened hearing from baseline to follow-up (“Worsened”) versus improved hearing or maintenance of the same hearing from baseline to follow-up (“Others”). The association between baseline viral load and hearing outcomes was analyzed separately for the 6-week and the 6-month treatment groups by using a generalized linear model for repeated binary outcomes for the total-ear assessment and by using conventional logistic regression for the best-ear assessment. Positive predictive values (PPV), negative predictive values (NPV), and exact 95% confidence intervals (CIs) in predicting hearing outcomes of different baseline viral loads were calculated.
The association between the blood viral load change over the treatment time and hearing outcomes was analyzed for the 6-month treatment group. Subjects were grouped into 2 categories: (1) subjects with early and sustained viral suppression during therapy; and (2) subjects without early and sustained virological response, including those with no viral load changes over the time or with continuous or intermittent viral load fluctuations. An early virological response was defined as viral suppression to ≤2.5 log by day 14 of therapy. A sustained viral suppression was defined as the maintenance of viral suppression (≤2.5 log) from day 14 through the end of 6 months of therapy. Analysis of viral suppression from day 14 to month 4 of therapy also was performed. The viral load threshold of ≤2.5 log was selected because the limit of detection of the assay was 2 log, and only changes in the viral load >0.5 log were considered to be meaningful. Subjects with an undetectable viral load at baseline were not included into this analysis, because their virological response could not be evaluated. Hearing outcomes were compared between these 2 groups by using Fisher’s exact test for both best ear and total ears. The counts were not sufficient to analyze the total ears accounting for the association in the hearing outcomes between left and right ears for the same subject.
Using a subset of the studies’ dataset, the effect of intravenous GCV and oral VGCV on blood viral load at days 1, 7, and 14 of treatment was compared. The pattern of decline of viral load was analyzed using a general linear model for repeated measures (using an unstructured covariance) that investigates the effect of drug over time on the viral load. In addition, the viral load between the 2 groups at day 1, 7, and 14 was compared separately using the t test.
P < .05 were considered statistically significant, except for the analysis of the Bayley-III neurodevelopmental outcomes. As previously described [15], a Bonferroni adjustment for multiple testing was used for the 7-component Bayley-III analyses, and only P < .0071 (0.05 ÷ 7) were considered statistically significant utilizing this conservative approach. All analyses were done using SAS version 9.4.
RESULTS
Baseline demographics of the 73 subjects treated for 6 weeks and the 47 subjects treated for 6 months included in this post hoc analysis are presented in Table 1. Baseline samples were available for 114 of 120 subjects: 101 of 114 infants (89%) had detectable viremia, whereas 13 of 114 infants (11%) were nonviremic. The median baseline viral load was 3.55 log (range, 1–5.65) (Table 1).
Baseline Demographics of Subjects Included in the Previous Studies and in This Post Hoc Analysis
| Characteristic | Phase I/II Study (n = 24) | Phase III Study (n = 96) | Total (n = 120) |
|---|---|---|---|
| Gender [n (%)] | |||
| Female | 11 (46) | 36 (37) | 47 (39) |
| Male | 13 (54) | 60 (63) | 73 (61) |
| Age at Enrollment (days) | |||
| N | 24 | 96 | 120 |
| Mean ± SE | 19.7 ± 1.8 | 16.7 ± 0.8 | 17.3 ± 0.8 |
| Median | 16.5 | 15.0 | 15.5 |
| Min-Max | 6–31 | 2–30 | 2–31 |
| Race [n (%)] | |||
| African American | 5 (21) | 22 (23) | 27 (23) |
| American Indian/Alaska Native | 0 (0) | 2 (2) | 2 (2) |
| Asian | 0 (0) | 4 (4) | 4 (3) |
| White | 19 (79) | 64 (67) | 83 (69) |
| Other | 0 (0) | 4 (4) | 4 (3) |
| Ethnicity [N (%)] | |||
| Hispanic/Latino | 1 (4) | 25 (26) | 26 (22) |
| Not Hispanic/Latino | 23 (96) | 68 (71) | 91 (76) |
| Unknown | 0 (0) | 3 (3) | 3 (3) |
| Gestational Age by Category [N (%)] | |||
| Preterm (<37) | 12 (50) | 46 (48) | 58 (48) |
| Term (≥37) | 12 (50) | 50 (52) | 62 (52) |
| Gestational Age by Weeks | |||
| N | 24 | 88a | 106 |
| Mean ± SE | 37.4 ± 0.4 | 37.3 ± 0.2 | 37.3 ± 0.2 |
| Median | 37.5 | 37.0 | 37.0 |
| Min-Max | 33.5–41.0 | 32.0–41.0 | 32.0–41.0 |
| Birth Weight (Grams) | |||
| N | 24 | 94b | 118 |
| Mean ± SE | 2473.3 ± 147.1 | 2532.7 ± 60.8 | 2520.6 ± 56.7 |
| Median | 2361.5 | 2425.0 | 2407.5 |
| Min-Max | 1110–4135 | 1190–4238 | 1110–4238 |
| Extent of CMV Diseasec [N (%)] | |||
| Thrombocytopenia | 16 (67) | 72 (75) | 88 (73) |
| Petechiae | 16 (67) | 42 (44) | 58 (48) |
| Hepatomegaly | 11 (46) | 47 (49) | 58 (48) |
| Splenomegaly | 12 (50) | 45 (47) | 57 (48) |
| Intrauterine growth restriction | 8 (33) | 39 (41) | 47 (39) |
| Hepatitis (elevated transaminases or bilirubin) | 14 (58) | 46 (48) | 60 (50) |
| Central nervous system involvement | 17 (71) | 63 (66) | 80 (67) |
| Baseline Blood Viral Load (Log10) | |||
| N | 24 | 90d | 114 |
| Mean ± SE | 3.13 ± 0.13 | 3.57 ± 0.14 | 3.48 ± 0.11 |
| Median | 3.24 | 3.68 | 3.55 |
| Min-Max | 1–3.98 | 1–5.65 | 1–5.65 |
Abbreviations: CMV, cytomegalovirus; Max, maximum; Min, minimum; SE, standard error.
aFor 8 subjects, the gestational age was only indicated as preterm or term.
bFor 2 subjects, the birth weight was not available.
cFor 5 subjects enrolled in the Phase I/II study, symptoms at presentation were not recorded by the study site because the subjects were enrolled on an earlier version of the research protocol.
dFor 6 subjects, baseline sample for viral load was not available.
Baseline Viral Load and Extent of Cytomegalovirus Disease
Data on extent of CMV disease were available for 109 of the 114 subjects. Higher viral load correlated with the presence of CNS involvement (3.82 log, range 1–5.65 vs 3.32 log, range 1–5.36; P = .001), thrombocytopenia (3.68 log, range 1–5.65 vs 3.43 log, range 1–5.36; P = .03), and elevated alanine aminotransferase and/or aspartate aminotransferase (3.73 log, range 1–5.60 vs 3.39 log, range 1–5.65; P = .009) (Figure 1). No significant association was found between the baseline viral load and the presence of petechiae, hepatomegaly, splenomegaly, and abnormal bilirubin values (P = .31, P = .27, P = .30, P = .94, respectively). Data regarding IUGR were available for 95 subjects, and no significant association was found between the baseline viral load and the presence of IUGR (P = .48). An association between the baseline viral load and the number of symptoms at presentation was found, with subjects with more symptoms at presentation having higher baseline viral loads (Table 2).
Median Baseline Viral Load According to the Number of Symptoms at Presentationa
| Number of Symptoms | Blood Viral Load | ||
|---|---|---|---|
| (No. of Subjects, %)b | Median (Log10) | Range (Log10) | P Value |
| 1 symptom (11, 10%) | 3.57 | 1–5.36 | .91 |
| With SNHL (1, 1%) | 3.58 | 3.58–3.58 | |
| Without SNHL (10, 9%) | 3.54 | 1–5.36 | |
| >1 symptom (98, 90%) | 3.56 | 1–5.65 | |
| ≤2 symptoms (27, 25%) | 3.52 | 1–5.35 | .27 |
| >2 symptoms (82, 75%) | 3.61 | 1–5.65 | |
| ≤3 symptoms (52, 48%) | 3.38 | 1–5.65 | .0054 |
| >3 symptoms (57, 52%) | 3.75 | 1–5.65 | |
| ≤4 symptoms (67, 61%) | 3.52 | 1–5.36 | .0151 |
| >4 symptoms (42, 39%) | 3.83 | 1–5.65 | |
| ≤5 symptoms (85, 78%) | 3.55 | 1–5.65 | .0606 |
| >5 symptoms (24, 22%) | 3.83 | 1–5.60 | |
| ≤6 symptoms (102, 94%) | 3.55 | 1–5.65 | .0156 |
| 7 symptoms (7, 6%) | 4.42 | 3.4–5.60 | |
Abbreviations: CMV, cytomegalovirus; SNHL, sensorineural hearing loss.
aThe baseline viral load between groups was compared using the Wilcoxon two-samples test.
bOnly the 109 subjects with available baseline viral load and data on the extent of CMV disease at presentation are included.
![Correlation between baseline viral load in subjects with and without central nervous system (CNS) involvement (P = .0010), thrombocytopenia (P = .0307), elevated alanine aminotransferase (ALT), and/or aspartate aminotransferase ([AST]; P = .0087), analyzed by Wilcoxon two-samples test. IE, immediate early. Note: The box represents the middle 50% of the data; the line in the box represents the median value; the whiskers represent the ranges for the bottom 25% and the top 25% of the data values, excluding outliers.](https://oup.silverchair-cdn.com/oup/backfile/Content_public/Journal/jid/219/9/10.1093_infdis_jiy695/1/m_jiy69501.jpeg?Expires=1750076556&Signature=npTNjlOoMZULhA4XyN-W8TNCAfXeztO2Jm9zGViTI8fipOFAaSPYGuSEBke68c1MqG9S4QuHTpYppiW6vYAhRhNXFebWOTWUWUMlRG5fAm~P3v8KL82laIC3gUNUVZkefcGNcjDurPIFIUa~Tb1Sx-dN5dRQid1tNkYph6dxi~eyZ9vMBTPRsGK~kMQBRrQukmh5I57IqqbL6SYBlZoR0Ny8W8g5R1KqlhLmbqcSSbTYozQvBcqidNBsAsT~SCXCcKuWg55j5KBvXIgWp~jvHYDNsCs0usb6aqu0GqIgYQYn0yNnU7xZLLF0Vi9SyaKaolrTlwGI8bSQ0jaou-5Vwg__&Key-Pair-Id=APKAIE5G5CRDK6RD3PGA)
Correlation between baseline viral load in subjects with and without central nervous system (CNS) involvement (P = .0010), thrombocytopenia (P = .0307), elevated alanine aminotransferase (ALT), and/or aspartate aminotransferase ([AST]; P = .0087), analyzed by Wilcoxon two-samples test. IE, immediate early. Note: The box represents the middle 50% of the data; the line in the box represents the median value; the whiskers represent the ranges for the bottom 25% and the top 25% of the data values, excluding outliers.
Results of qualitative CSF CMV PCR were available for 19 subjects: 6 of 19 (32%) samples tested positive, and 13 of 19 (68%) tested negative (Table 3). No significant association was found between the blood viral load and the detection of CMV DNA in CSF (P = .70). Quantitative CSF CMV PCR results were not available.
Central Nervous System Involvement in Subjects With Available CSF CMV PCR Resultsa
| CNS Involvement (One or More of the Following) | Negative CSF CMV PCR (n = 13) | Positive CSF CMV PCR (n = 6b) | P Value |
|---|---|---|---|
| Microcephaly | 4 (31) | 3 (50) | .6 |
| Radiographic abnormalities | 8 (62) | 5 (83) | .6 |
| Abnormal CSF indices for age | 4 (31) | 4 (67) | .3 |
| Chorioretinitis | 0 | 0 | 1 |
| Sensorineural hearing loss | 2 (15) | 1 (17) | 1 |
| Median blood viral load, range (log) | 3.93, 1–5.03 | 3.52, 2.91–5.65 | .7 |
Abbreviations: CMV, cytomegalovirus; CSF, cerebrospinal fluid; PCR, polymerase chain reaction.
aThe baseline viral load between groups was compared using the Wilcoxon two-samples test; the other parameters were compared using Fisher’s exact test. Data are no. (%) of infants unless otherwise indicated.
bOne subject had positive CSF CMV PCR and abnormal CSF indices; 1 had positive CSF CMV PCR and radiographic abnormalities; the other 4 subjects had multiple findings.
Baseline Viral Load and Hearing Outcomes
In subjects treated for 6 months, a lower baseline viral load was associated with a better hearing outcome at 12 months in both the total-ear (P = .02) and the best-ear assessment (P = .01); the median baseline viral load was 3.56 log for subjects with improved/protected hearing (Improved/protected group) versus 3.93 log for subjects with worsened hearing or maintenance of the same degree of hearing loss at 12 months (Others group). However, clinically meaningful viral load thresholds predictive of SNHL were not identified. The NPV of a baseline viral load ≤3 log was 93% (95% CI, 79–100), but the PPV of a viral load >3 log was only 32% (95% CI, 20–43). Using a breakpoint of ≤4.5 log versus >4.5 log, the NPV was 80% (95% CI, 70–90), but the PPV was only 53% (95% CI, 29–77). No significant association was found between the baseline viral load and the 6- and 24-month hearing outcome in either the best-ear or the total-ear assessments (P = .35 and P = .29 at 6 months; P = .18 and P = .07 at 24 months). When considering worsened hearing versus stable or improved hearing, no significant association was found between the baseline viral load and the hearing function at 6, 12, and 24 months. No significant association was found between the baseline viral load and hearing function at 6, 12, and 24 months for subjects treated for 6 weeks.
Baseline Viral Load and Neurodevelopmental Outcomes
No significant correlation was found between the baseline viral load and the mental developmental index and the motor developmental index of the Bayley-II (P > .05 for both indexes at 12 and 24 months). Likewise, no significant correlation was found between the baseline viral load and the 7 components of the Bayley-III (P > .007 for cognitive composite, receptive communication, expressive communication, language composite, fine motor, gross motor, and motor composite at 12 and 24 months).
Viral Load Changes Under Treatment and Hearing Outcomes
Of the 47 subjects who received 6 months of VGCV therapy, 38 had both serial viral load assessments and hearing outcome data. Hearing outcomes for these 38 subjects were compared between those with and without viral suppression for the 6 months of treatment (Table 4). Although the proportion that had improved or protected hearing (that is, not worsened) by best-ear analysis was numerically higher for those with viral suppression compared with those without viral suppression, the differences were not statistically significant (P = .23, P = .08, P = .29) (Table 4). In the total-ear analysis, subjects with viral suppression for the 6 months of treatment were more likely than subjects without viral suppression to have improved/protected hearing between baseline and the 6- and 12-month assessments (P = .03 and P = .001, respectively) (Table 4), but not between baseline and the 24-month assessment (P = .08). The median baseline viral load was 3.89 log (range, 2.62–4.32) for subjects with viral suppression and 4.06 log (range, 2.73–5.65) for those without viral suppression (P = .07).
Improvement and Protection in Best-Ear and Total-Ear Hearing Between Baseline and Follow-Up in Subjects With Complete Viral Suppression by Day 14 of Therapy Through Month 6, and Subjects Without Complete Viral Suppressiona
| Analysis | No. of Subjects or Ears | Hearing Between Baseline and Follow-up | P Value | |
| Improved/Protected | Others | |||
| 6-Month Best-Ear | ||||
| With complete suppression | 9 | 8 (89) | 1 (11) | .23 |
| Without complete suppression | 26 | 17 (65) | 9 (35) | |
| 6-Month Total-Ear | ||||
| With complete suppression | 17 | 15 (88) | 2 (12) | .0366 |
| Without complete suppression | 50 | 29 (58) | 21 (42) | |
| 12-Month Best-Ear | ||||
| With complete suppression | 9 | 9 (100) | 0 | .08 |
| Without complete suppression | 26 | 18 (69) | 8 (31) | |
| 12-Month Total-Ear | ||||
| With complete suppression | 18 | 18 (100) | 0 | .0017 |
| Without complete suppression | 50 | 32 (64) | 18 (36) | |
| 24-Month Best-Ear | ||||
| With complete suppression | 8 | 8 (100) | 0 | .29 |
| Without complete suppression | 23 | 18 (78) | 5 (22) | |
| 24-Month Total-Ear | ||||
| With complete suppression | 15 | 14 (93) | 1 (7) | .08 |
| Without complete suppression | 43 | 30 (70) | 13 (30) |
aHearing outcomes between the 2 groups were compared using Fisher’s exact test. Data are no. (%) of subjects in the best-ear assessment and no. (%) of ears in the total-ear assessment.
If viral suppression was considered through month 4 of treatment instead of month 6, hearing outcomes between baseline and 6-, 12-, and 24-month follow-up were not significantly different in the 2 groups by best-ear assessment (P = .21, P = .07, P = .28) (Table 5). However, in the total-ear assessment, subjects with viral suppression were more likely to have improved/protected hearing at all follow-up evaluations (P = .01, P = .0007, P = .04) (Table 5). The median baseline viral load was 3.56 log (range, 2.62–4.32) for subjects with viral suppression and 4.13 log (range, 2.73–5.65) for those without viral suppression (P = .04).
Improvement and Protection in Best-Ear and Total-Ear Hearing Between Baseline and Follow-up in Subjects With Complete Viral Suppression by Day 14 of Therapy Through Month 4, and Subjects Without Complete Viral Suppressiona
| Analysis | No. of Subjects or Ears | Hearing Between Baseline and Follow-up | P Value | |
| Improved/Protected | Others | |||
| 6-Month Best-Ear | ||||
| With complete suppression | 10 | 9 (90) | 1 (10) | .21 |
| Without complete suppression | 25 | 16 (64) | 9 (36) | |
| 6-Month Total-Ear | ||||
| With complete suppression | 19 | 17 (89) | 2 (11) | .0098 |
| Without complete suppression | 48 | 27 (56) | 21 (44) | |
| 12-Month Best-Ear | ||||
| With complete suppression | 10 | 10 (100) | 0 | .07 |
| Without complete suppression | 25 | 17 (68) | 8 (32) | |
| 12-Month Total-Ear | ||||
| With complete suppression | 20 | 20 (100) | 0 | .0007 |
| Without complete suppression | 48 | 30 (63) | 18 (38) | |
| 24-Month Best-Ear | ||||
| With complete suppression | 9 | 9 (100) | 0 | .28 |
| Without complete suppression | 22 | 17 (77) | 5 (23) | |
| 24-Month Total-Ear | ||||
| With complete suppression | 17 | 16 (94) | 1 (6) | .0458 |
| Without complete suppression | 41 | 28 (68) | 13 (32) |
aHearing outcomes between the 2 groups were compared using Fisher’s exact test. Data are no. (%) of subjects in the best-ear assessment and no. (%) of ears in the total-ear assessment.
Decline of Viral Load After Initial Administration of Intravenous Ganciclovir and Oral Valganciclovir
Twenty-four subjects receiving intravenous GCV and 78 subjects receiving oral VGCV had viral load data at baseline, 7, and 14 days (Figure 2). Decline in blood viral load was more rapid among subjects receiving oral VGCV, possibly due to a higher baseline in the VGCV group (3.65 log ± 1.28) than the GCV group (3.13 log ± 0.64) (P = .0089). The mean decline of blood viral load between baseline and day 7 was 0.44 log ± 0.55 for subjects receiving intravenous GCV, and it was 0.94 log ± 0.77 for those receiving oral VGCV (P = .0007); the mean decline between baseline and day 14 was 0.59 log ± 0.86 and 1.36 log ± 0.97, respectively (P = .0007).
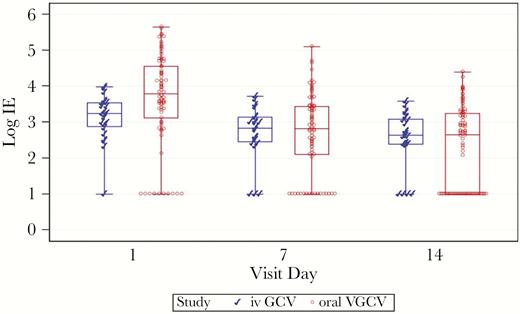
Viral load decline after 7 and 14 days of treatment in subjects receiving intravenous (iv) ganciclovir (GCV) and subjects receiving oral valganciclovir (VGCV). A general linear model for repeated measures was used to analyze the effect of drug, day, and their interaction on the viral load (treatment effect P = .67; day effect P < .001; interaction with treatment and day P = .0021). Note: The box represents the middle 50% of the data; the line in the box represents the median value; the whiskers represent the ranges for the bottom 25% and the top 25% of the data values, excluding outliers.
DISCUSSION
Our current analyses represent the largest available dataset of blood viral load in treated infants with symptomatic congenital CMV infection. The majority of enrolled symptomatic neonates had detectable DNA-emia before initiation of antiviral therapy. However, 11% did not have DNA-emia despite being clinically symptomatic, underscoring the need to evaluate all clinical and laboratory data, in addition to blood PCR, when assessing a baby with congenital CMV infection for extent of disease. In symptomatic neonates, higher blood viral loads correlate with some indicators of active systemic disease, specifically with thrombocytopenia and transaminitis. Higher blood viral loads were also found in subjects with CNS involvement. Although the clinical utility of these research findings is limited by the considerable overlap of blood viral load results between subjects with and without thrombocytopenia, transaminitis, or CNS involvement, blood viral load adds some additional information on which clinicians may assess the severity of CMV disease when caring for individual patients. We were unable to identify a reliable threshold above which the risk of SNHL is increased. Most subjects with a baseline viral load <3 log had improved/protected hearing at follow-up evaluations, resulting in a good NPV; however, the PPV was poor. Even when different threshold values were assessed (eg, log: 3, 4, 4.3, and 4.5; data not shown), a clinically useful PPV could not be identified. Thus, in individual children, the baseline viral load may not be predictive of hearing outcome, as demonstrated in infants with asymptomatic congenital CMV infection [13]. Nonetheless, a low viral load is associated with a higher probability of improved/protected hearing in subjects treated for 6 months, and this finding may be relevant for counseling strategies, as well as being informative to future antiviral study designs. Blood viral load had no predictive value for long-term neurodevelopmental outcomes.
Early viral suppression achieved during the first 14 days of antiviral therapy and then sustained through 4 or 6 months may correlate with a better hearing outcome, as suggested by the higher percentage of subjects with improved/protected hearing from baseline to 6, 12, and 24-month follow-up in the total ear analysis. However, a majority without viral suppression still had improved hearing. Parenteral GCV did not achieve a more rapid decline in blood viral load compared with oral VGCV, suggesting that an “induction period” using intravenous GCV is not necessary. Indeed, the blood viral load decline after administration of oral VGCV was approximately 2 times the blood viral load decline after intravenous GCV administration.
The blood viral load reflects net viral replication rate, which may be influenced by several factors, including timing of in utero infection, the quality and quantity of specific immune responses, and antiviral treatment. In immunocompromised hosts, blood viral load and viral kinetics suggest a correlation with the extent of CMV disease; in these patients, viral load is used to guide initiation and monitoring of antiviral therapy [18–21]. In seeking to determine whether blood viral load could be a reliable biomarker of severity and increased risk of sequelae in congenital CMV infection as well, several relatively small studies have suggested that infants with symptomatic congenital CMV have higher blood viral loads than asymptomatic infants [8, 10, 13]. Some studies have suggested a role of the viral load in predicting late-onset SNHL, with the identification of different viral thresholds above which the risk of SNHL may be increased [10, 11]. However, these studies often have small sample sizes and lack long-term follow-up. Other studies notably have failed to identify an association between viral load and SNHL [12, 13].
In contrast to data in immunocompromised hosts, the present study confirmed that antiviral therapy in congenital CMV does not have a predictable effect on viremia [22, 23]. Although some subjects had a rapid and durable achievement of viral suppression, others only had a slower virological response or none at all. The reasons for this incomplete viral suppression are unclear. It is unlikely that it may be due to medication compliance, because adherence rates were evaluated in the original studies. Likewise, preliminary data suggest that antiviral resistance is also unlikely to be an explanation [24–27]. The lack of consistent suppression of virus in the blood compartment increases the likelihood that other anatomic reservoirs exist in the body where viral suppression may be incomplete, including the CNS and the inner ear. In the present study, higher blood viral load at presentation was associated with CNS involvement, and there is some suggestion that subjects with higher baseline viral load may have more difficulty controlling viral replication. These findings support the hypothesis that the CNS and inner ear are sites of persistent active viral replication. The pathogenesis of CMV-related late-onset SNHL is poorly understood. Studies of the anatomy of human temporal bones [28–30], detection of CMV DNA in the perilymph of some children undergoing cochlear implants for CMV-related SNHL [31–33], and inner ear infection in animal models [34, 35] suggest that SNHL might be an ongoing and progressive event consisting of a combined effect of viral and host inflammatory factors. Such a mechanism is supported by the observed benefit of antiviral treatment on hearing and developmental outcomes in clinical trials [15, 36]. Given that GCV concentrations in CSF after intravenous dosing range from 24% to 70% of those measured simultaneously in plasma [37], it is possible that combination therapy of GCV or VGCV and another antiviral with CNS penetration could produce greater clinical results.
CONCLUSIONS
At the current time, viral load at baseline or during treatment should not be considered as a marker to assess the effectiveness of antiviral therapy in congenital CMV and should not guide treatment decisions, including initiation or termination of therapy. Our viral load results should not be extrapolated for asymptomatic infants and do not directly apply to untreated symptomatic infants, because long-term outcomes are significantly modified by antiviral therapy. These data can instead provide clinicians with some useful information for a better counseling and monitoring of symptomatic treated infants and can assist the development of new research protocols. For example, if subjects who do not obtain viral suppression under treatment are those who remain at risk of sequelae, they could be considered as ideal study subjects for future clinical trials of alternative therapeutic strategies such as combination therapies. The development of new drugs with a good CNS penetration, and their evaluation in combination with VGCV or GCV, is desirable to further reduce the CMV-related morbidity.
Presented in part: IDWeek 2017 (Abstract 947), October 4–8, 2017, San Diego, CA.
Notes
Financial support. This work was funded under contract with the Division of Microbiology and Infectious Diseases of the National Institute of Allergy and Infectious Diseases (Grants N01-AI-30025, N01-AI-65306, N01-AI-15113, N01-AI-62554).
Potential conflicts of interest. P. J. S. received grants from Merck and MedImmune, Inc, and is on the Advisory Board for RSV of AstraZeneca and Sanofi Pasteur, outside the submitted work. S. W. has served as a principal investigator (PI) for hepatitis C and B treatment protocols sponsored by Gilead, subinvestigator for anidulofungin protocol sponsored by Pfizer, subinvestigator for tedizolid protocol sponsored by Merck, subinvestigator for brincidofovir protocol sponsored by Chimerix, and subinvestigator for fidaxomycin protocol sponsored by Astellas, outside the submitted work. R. J. W. is on the Board of Directors of Gilead Sciences. D. W. K. has served as the site PI for studies of respiratory syncytial virus small molecules and vaccines sponsored by Alios and Novavax, outside the submitted work. All authors have submitted the ICMJE Form for Disclosure of Potential Conflicts of Interest. Conflicts that the editors consider relevant to the content of the manuscript have been disclosed.
References
Roche Pharmaceuticals. Ganciclovir [package insert]. https://www.accessdata.fda.gov/drugsatfda_docs/label/2006/019661s030lbl.pdf

