


Abstract
Noroviruses are the leading cause of acute gastroenteritis outbreaks worldwide. Clarifying the viral, host, and environmental factors (epidemiologic triad) associated with severe outcomes can help target public health interventions.
Acute norovirus outbreaks reported to the National Outbreak Reporting System (NORS) in 2009–2016 were linked to laboratory-confirmed norovirus outbreaks reported to CaliciNet. Outbreaks were analyzed for differences in genotype (GII.4 vs non-GII.4), hospitalization, and mortality rates by timing, setting, transmission mode, demographics, clinical symptoms, and health outcomes.
A total of 3747 norovirus outbreaks were matched from NORS and CaliciNet. Multivariable models showed that GII.4 outbreaks (n = 2353) were associated with healthcare settings (odds ratio [OR], 3.94 [95% confidence interval {CI}, 2.99–5.23]), winter months (November–April; 1.55 [95% CI, 1.24–1.93]), and older age of cases (≥50% aged ≥75 years; 1.37 [95% CI, 1.04–1.79]). Severe outcomes were more likely among GII.4 outbreaks (hospitalization rate ratio [RR], 1.54 [95% CI, 1.23–1.96]; mortality RR, 2.77 [95% CI, 1.04–5.78]). Outbreaks in healthcare settings were also associated with higher hospitalization (RR, 3.22 [95% CI, 2.34–4.44]) and mortality rates (RR, 5.65 [95% CI, 1.92–18.70]).
Severe outcomes more frequently occurred in norovirus outbreaks caused by GII.4 and those in healthcare settings. These results should help guide preventive interventions for targeted populations, including vaccine development.
(.)
Noroviruses are the leading cause of epidemic gastroenteritis both in the United States and worldwide [1, 2]. In the United States, noroviruses are the most commonly reported etiology of acute gastroenteritis outbreaks [3, 4]. Person-to-person transmission is the most common route, reported in 66%–77% of norovirus outbreaks, while foodborne transmission accounts for 17%–26% of outbreaks [1, 5].
While most episodes of gastroenteritis caused by norovirus are mild and self-resolving, severe outcomes, including hospitalization and death, can occur. In the United States, endemic norovirus illness is responsible for an estimated 56000–71000 hospitalizations and 570–800 deaths each year [6]. Vulnerable populations such as young children and the institutionalized elderly are at higher risk for these severe outcomes [6, 7].
Human noroviruses are classified into at least 3 genogroups (GI, GII, and GIV) and 29 genotypes [8]. Since the mid-1990s, genogroup II type 4 (GII.4) viruses have been the predominant genotype worldwide [9, 10] including in the United States [5, 11]. New GII.4 variants have emerged every 2–4 years and have often been associated with increased norovirus outbreak activity and more severe health outcomes [12–15]. However, this pattern has not been seen with the last 2 new GII.4 variants (GII.4 New Orleans and GII.4 Sydney) [16, 17].
Despite these observations, it remains challenging to identify which of the myriad host, virus, and setting characteristics (ie, epidemiologic triad) contribute to more severe outcomes during norovirus outbreaks. For example, it is difficult to distinguish whether the higher mortality rate observed with outbreaks occurring in healthcare facilities [18] is the result of an older, vulnerable patient population [19, 20], or the predominance of GII.4 outbreaks in these facilities [21].
A prior multivariable analysis [18] of data from 843 published norovirus outbreaks from 45 countries found that outbreaks caused by GII.4 viruses had hospitalization rates that were 9 times as high, and mortality rates that were 3 times as high, as outbreaks caused by non-GII.4 viruses, after controlling for other factors. However, because this analysis relied on published outbreaks as opposed to systematic surveillance, it may have been susceptible to publication bias and lack of generalizability.
Since 2009, the Centers for Disease Control and Prevention (CDC) has obtained epidemiologic data on norovirus outbreaks from state health departments through the National Outbreak Reporting System (NORS) [1] and laboratory data through CaliciNet [22]. When data are linked from both surveillance systems, norovirus outbreaks reported to NORS and CaliciNet provide robust epidemiologic data specific to norovirus genotypes, helping to define characteristics of outbreaks that result in more severe health outcomes. This understanding can guide targeted interventions to reduce hospitalizations and deaths from norovirus outbreaks, for instance by informing the genotypic formulation and target populations for vaccines in development [23]. Our objectives were to identify settings, transmission routes, seasonality, symptoms, and patient demographics associated with norovirus genotypes, and to quantify the relationships between these characteristics and hospitalizations and deaths from norovirus outbreaks.
METHODS
Data Sources
NORS is a Web-based platform for state, local, and territorial health departments to report waterborne, foodborne, and enteric disease outbreaks of all etiologies, including norovirus, to CDC [1]. CaliciNet, a nationwide electronic surveillance system of local and state public health and regulatory agency laboratories, collects limited epidemiologic information and sequence information from norovirus outbreaks [22]. NORS reports with norovirus as the single suspected or confirmed etiologic agent were linked with CaliciNet reports by unique outbreak identifiers, reporting state, and date of first illness onset (within 14 days) in both systems. These variables are inconsistently included in outbreak reports; thus, not all reports can be linked in both systems. To identify linked outbreaks that lacked matching identifiers, linkage was additionally attempted by matching the state and date of first illness onset (within 14 days) in both systems.
Descriptive Analysis
Matched NORS and CaliciNet outbreak reports were analyzed using the following descriptive variables: norovirus genotype, outbreak setting, transmission mode, number of ill persons, and outbreak duration. Norovirus genotype from CaliciNet was classified as follows: for outbreaks where one genotype makes up >50% of genotypes uploaded, this one genotype is considered the final outbreak genotype; for outbreaks where no one genotype makes up >50% of genotypes uploaded, all genotypes are listed. Outbreak settings were grouped into healthcare, including long-term care facilities as well as hospitals, and nonhealthcare settings (eg, restaurant, school). Transmission modes were dichotomized as foodborne and nonfoodborne (person-to-person, water, environmental contamination). Outbreaks with unknown, missing, or undetermined setting or transmission were excluded from analysis. Seasonality was assessed by differentiating between outbreaks that occurred during November–April (norovirus season), when most norovirus outbreaks occur [24], and those that occurred during May–October. Age, sex, and symptom data are reported in aggregate to NORS and not always available for all outbreaks or all outbreak-associated cases within a given outbreak. For each outbreak, we first calculated the percentage of individuals among those with available data who fell into the following categories: female (vs male), <75 years of age (vs ≥75), reported vomiting, reported diarrhea, reported fever. For our descriptive analyses, we then calculated the median and interquartile range (IQR) for each of these defined variables, stratified by GII.4 vs non-GII.4 outbreaks. Medians were compared using the Mann–Whitney test. Categorical variables were compared using χ2 tests. For regression models, each outbreak was categorized based on the proportions among cases with available information into the following data-driven dichotomous categories: outbreaks where ≥50% (vs <50%) of cases with known ages were ≥75 years old, ≥50% (vs <50%) female, ≥75% (vs <75%) with vomiting, and ≥25% (vs <25%) with fever.
Multivariable Regression Models
Logistic regression models were constructed to determine crude odds ratios (ORs) for the association of reported genotype (GII.4 vs non-GII.4) with the following predictors: outbreak setting, transmission mode, seasonality, age, sex, and symptoms (vomiting and fever). Multivariable logistic regression models were then constructed including all of the above predictors. The model was assessed for collinearity by examining condition indices and variance decomposition proportions, and no collinearity was found. Based on the strong association of genotype with setting, and the fact that the healthcare setting is quite distinct from other settings, we stratified by setting and re-ran the univariate and multivariable models.
To assess severity, hospitalization rates were calculated as the number of persons hospitalized divided by the number of persons with known hospitalization data for each matched outbreak. Outbreaks occurring in hospitals were excluded from models of hospitalization rates. Mortality rates were calculated similarly as the number of deaths divided by the number of persons with known death data. Mortality numerators and denominators are provided to NORS by local investigators, as the number of patients who died as a result of becoming ill during the outbreak and the number of patients for whom this information was known, respectively.
To determine correlates of hospitalization and mortality rates, negative binomial models were constructed, using the number of hospitalizations or deaths in each outbreak as the outcome, and incorporating an offset of the number of individuals in each outbreak for whom each outcome was known. Crude rate ratios (RRs) were first calculated, and then adjusted RRs, for genotype and the other predictors above. In a sensitivity analysis, models were again stratified based on setting. No collinearity was detected in models of hospitalization or mortality.
Ethical Considerations
This analysis was not considered human subjects research; therefore, institutional review board approval was not required.
RESULTS
Genotypes Reported in Linked Outbreaks
During 2009–2016, 15115 suspected or confirmed norovirus outbreaks were reported to NORS, and 7059 confirmed norovirus outbreaks were reported to CaliciNet. Of these, 3747 outbreaks (53.1% of CaliciNet outbreaks and 24.8% of NORS outbreaks) were linked between the 2 systems and comprised the primary dataset for this analysis. GII.4 strains were reported in 2353 (62.8%) of outbreaks; the most commonly reported non-GII.4 genotypes were GI.3 (n = 229 [6.1%]), GII.6 (n = 214 [5.7%]), and GII.2 (n = 172 [4.6%]) (Supplementary Table 1). In our linked dataset, no outbreaks were classified as having been caused by multiple norovirus genotypes.
Characteristics of GII.4 and Non-GII.4 Outbreaks
Of the 2353 outbreaks reporting GII.4 genotypes, 1991 (84.6%) occurred during November–April, compared with 980 of 1394 (70.3%) outbreaks reporting non-GII.4 genotypes occurring in these same 6 months (P < .0001). Person-to-person transmission was the primary mode in 74.3% of GII.4 outbreaks, compared with 60.5% of non-GII.4 outbreaks (P < .001) (Figure 1A). Foodborne transmission was more common in non-GII.4 outbreaks (23.8% vs 14.8% for GII.4 outbreaks, P < .001). The majority (72.2%) of GII.4 outbreaks occurred in long-term care facilities (Figure 1B). In contrast, the settings for non-GII.4 outbreaks were more varied, with 40.4% occurring in long-term care facilities, 23.1% in restaurants, and 14.9% in daycare centers or schools (P < .0001 for the overall comparison of setting by genotype).
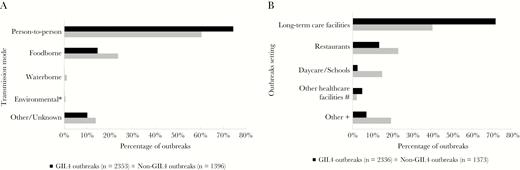
Transmission modes (A) and settings (B) of norovirus outbreaks reported to the National Outbreak Reporting System and CaliciNet, 2009–2016. *χ2P = .18 for difference between genogroup II type 4 (GII.4) and non-GII.4 outbreaks with environmental transmission. For all other transmission modes and for all settings displayed, χ2P < .001. #Other healthcare settings include hospital, dialysis center, and “other healthcare facility.” +Other settings include private residence, prison/jail, office, hotel/motel, religious facility, grocery store, ship/boat, “other.”
GII.4 outbreaks were longer in duration, lasting a median of 9 (IQR, 5–16) days, compared to non-GII.4 outbreaks (median, 6 [IQR, 3–12] days) (P < .0001). GII.4 outbreaks were also larger, with a median of 26 (IQR, 13–44) cases per outbreak, compared to a median of 21 (IQR, 10–41) cases in non-GII.4 outbreaks (P < .0001). In terms of demographics, GII.4 outbreaks had a higher proportion of females (median, 73% vs 54%) and persons aged 75 years or older (median, 60% vs 9%) (P < .0001 for both comparisons) (Supplementary Table 2). GII.4 outbreaks were less likely to cause fever (median, 18% vs 24%, P = .0065) or vomiting (median, 69% vs 79%, P = .0002) in ill persons.
Models of Genotype
Initial univariate analysis found that outbreaks in healthcare settings (odds ratio [OR], 4.53 [95% confidence interval {CI}, 3.92–5.23]), those with a majority of female cases (OR, 1.87 [95% CI, 1.55–2.25]), a majority of cases aged ≥75 years (OR, 3.25 [95% CI, 2.73–3.87]), and outbreaks during norovirus season (OR, 2.33 [95% CI, 1.98–2.73]) were significantly more likely to be associated with GII.4 than with non-GII.4 genotypes (Table 1). Outbreaks with foodborne transmission (OR, 0.55 [95% CI, .47–.66]), vomiting in ≥75% of cases (OR, 0.82 [95% CI, .71–.96]), or fever in ≥25% of cases (OR, 0.63 [95% CI, .54–.73]) were significantly less likely to be caused by GII.4 viruses. In the multivariable model, healthcare settings, age ≥75 years, and occurrence during the norovirus season remained statistically significantly associated with GII.4 genotypes (Figure 2). Importantly, the association between genotype and transmission mode changed direction in the multivariable model, with foodborne transmission being positively associated with GII.4 genotype (OR, 1.81 [95% CI, 1.41–2.33]). This change from the univariate to multivariable model prompted a stratified analysis by setting, which showed that the positive association between GII.4 genotypes and foodborne transmission was observed only in nonhealthcare settings (Supplementary Table 3), while the association was negative or null (after adjustment for case demographics) in healthcare settings. Other associations were not notably different by setting, with the exception of the association of age with GII.4 genotype, which was stronger in the nonhealthcare setting. We also explored the potential impact of year, but found that this did not change the overall associations of transmission mode and genotype.
Univariate Analysis of Characteristics Associated With Norovirus GII.4 and Non-GII.4 Outbreaks Reported to the National Outbreak Reporting System and CaliciNet, 2009–2016
| Frequency, No. (%) | Models of GII.4 | ||||
|---|---|---|---|---|---|
| Characteristic | Non-GII.4 | GII.4 | Odds Ratio | (95% CI) | P Value |
| Outbreak setting and transmission mode | |||||
| Nonhealthcare settings | 789 (57.5) | 537 (23.0) | 1.00 | … | … |
| Healthcare settings | 584 (42.5) | 1799 (77.0) | 4.53 | (3.92–5.23) | <.0001 |
| Nonfoodborne | 1063 (76.1) | 2005 (85.2) | 1.00 | … | … |
| Foodborne | 333 (23.9) | 348 (14.8) | 0.55 | (.47–.66) | <.0001 |
| Case demographics | |||||
| <50% female | 303 (32.7) | 311 (20.6) | 1.00 | … | … |
| ≥50% female | 625 (67.3) | 1199 (79.4) | 1.87 | (1.55–2.25) | <.0001 |
| <50% aged ≥75 y | 757 (75.5) | 783 (48.7) | 1.00 | … | … |
| ≥50% aged ≥75 y | 246 (24.5) | 826 (51.3) | 3.25 | (2.73–3.87) | <.0001 |
| Reported symptoms | |||||
| <75% reported vomiting | 799 (65.7) | 1402 (70.0) | 1.00 | … | … |
| ≥75% reported vomiting | 417 (34.3) | 601 (30.0) | 0.82 | (.71–.96) | .011 |
| <25% reported fever | 716 (58.9) | 1392 (69.5) | 1.00 | … | … |
| ≥25% reported fever | 500 (41.1) | 610 (30.5) | 0.63 | (.54–.73) | <.0001 |
| Seasonality | |||||
| May–October | 415 (29.7) | 362 (15.4) | 1.00 | … | … |
| November–April | 981 (70.3) | 1991 (84.6) | 2.33 | (1.98–2.73) | <.0001 |
Abbreviation: CI, confidence interval; GII.4, genogroup II type 4.
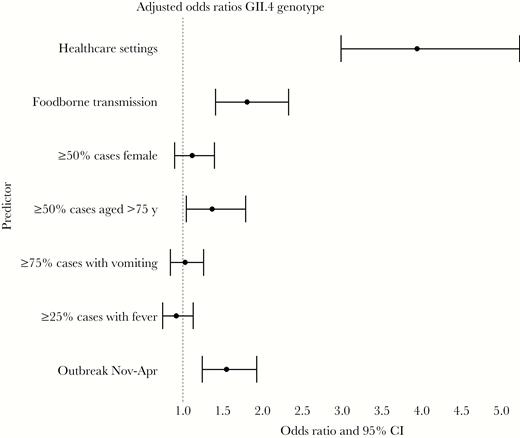
Multivariable analysis of characteristics associated with norovirus genotype genogroup II type 4 (GII.4) vs non-GII.4 genotypes in outbreaks reported to the National Outbreak Reporting System and CaliciNet, 2009–2016. Abbreviation: CI, confidence interval.
Models of Hospitalization Rate
In univariate analyses, hospitalization rates were significantly higher for outbreaks caused by GII.4 genotypes (230 hospitalizations per 10000 cases vs 105 for non-GII.4; RR, 2.04 [95% CI, 1.70–2.46]), those in healthcare settings (232 hospitalizations per 10000 cases vs 85 for non-healthcare; RR, 2.45 [95% CI, 2.01–3.00]), and those with a majority of cases aged ≥75 years (268 hospitalizations per 10000 cases vs 158 for outbreaks with younger cases; RR, 1.64 [95% CI, 1.36–1.98]). Outbreaks with foodborne transmission (166 hospitalizations per 10000 cases vs 188 for nonfoodborne transmission; RR, 0.75 [95% CI, .59–.95]), majority-female cases (206 hospitalizations per 10000 cases vs 176 for majority-male cases; RR, 0.77 [95% CI, .60–.98]), and those occurring during norovirus season (181 hospitalizations per 10000 cases vs 205 for outbreaks in May–October; RR, 0.74 [95% CI, .60–.92]) had significantly lower hospitalization rates (Table 2). In the multivariable model, genotype, setting, sex, and seasonality remained significant (Figure 3A). In a subanalysis of GII.4 strains, GII.4 Den Haag was associated with significantly higher (P < .02) hospitalization rates (482 per 10000 cases) compared with GII.4 Sydney (206 per 10000 cases) or GII.4 New Orleans (250 per 10000 cases).
Univariate Analysis of Characteristics Associated With Hospitalization From Norovirus Outbreaks Reported to the National Outbreak Reporting System and CaliciNet, 2009–2016
| Hospitalization Rate | Models of Hospitalization Rate | |||||
|---|---|---|---|---|---|---|
| Characteristic | Total No. of Cases | No. of Hospitalizations | Rate per 10000 Cases | Rate Ratio | (95% CI) | P Value |
| Outbreak characteristics | ||||||
| Non-GII.4 | 36270 | 380 | 104.8 | 1.00 | … | … |
| GII.4 | 65105 | 1494 | 229.5 | 2.04 | (1.70–2.46) | < .0001 |
| Nonhealthcare settings | 32033 | 271 | 84.6 | 1.00 | … | … |
| Healthcare settings | 68693 | 1596 | 232.3 | 2.45 | (2.01–3.00) | < .0001 |
| Nonfoodborne | 88483 | 1660 | 187.6 | 1.00 | … | … |
| Foodborne | 12892 | 214 | 166.0 | 0.75 | (.59–.95) | .012 |
| Case demographics | ||||||
| <50% female | 12875 | 227 | 176.3 | 1.00 | … | … |
| ≥50% female | 57701 | 1191 | 206.4 | 0.77 | (.60–.98) | .019 |
| <50% aged ≥75 y | 37059 | 585 | 157.9 | 1.00 | … | … |
| ≥50% aged ≥75 y | 35314 | 945 | 267.6 | 1.64 | (1.36–1.98) | < .0001 |
| Reported symptoms | ||||||
| <75% reported vomiting | 65567 | 1218 | 185.8 | 1.00 | … | … |
| ≥75% reported vomiting | 28624 | 546 | 190.7 | 1.07 | (.89–1.29) | .43 |
| <25% reported fever | 65226 | 1251 | 191.8 | 1.00 | … | … |
| ≥25% reported fever | 28924 | 513 | 177.4 | 0.93 | (.77–1.11) | .38 |
| Seasonality | ||||||
| May–October | 16138 | 331 | 205.1 | 1.00 | … | … |
| November–April | 85237 | 1543 | 181.0 | 0.74 | (.60–.92) | .003 |
Abbreviation: CI, confidence interval; GII.4, genogroup II type 4.
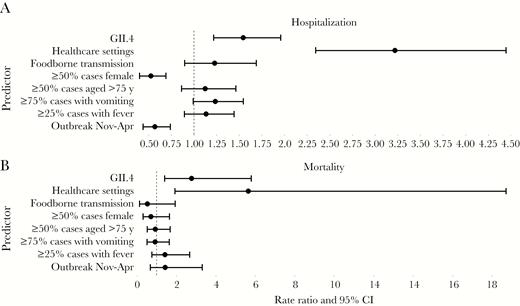
Rate ratios from multivariable analysis of characteristics associated with hospitalization (A) and mortality (B) from norovirus outbreaks reported to the National Outbreak Reporting System and CaliciNet, 2009–2016. Abbreviation: CI, confidence interval.
Models of Mortality Rate
In univariate analyses, outbreaks caused by GII.4 (26 deaths per 10000 cases vs 12 for non-GII.4; RR, 2.36 [95% CI, 1.58–3.56]), those that occurred in healthcare settings (30 deaths per 10000 cases vs 2 for nonhealthcare settings; RR, 14.50 [95% CI, 7.00–35.32]), those with a majority of cases aged ≥75 years (31 deaths per 10000 cases vs 12 for outbreaks with younger cases; RR, 2.59 [95% CI, 1.73–3.93]), and norovirus season outbreaks (23 deaths per 10000 cases vs 11 for outbreaks occurring May–October; RR, 2.11 [95% CI, 1.24–3.74]) were associated with significantly higher mortality rates. Outbreaks with foodborne transmission (3 deaths per 10000 cases vs 23 for nonfoodborne transmission; RR, 0.11 [95% CI, .03–.28]) and outbreaks with vomiting reported by ≥75% of cases (14 deaths per 10000 cases vs 24 for outbreaks with less reported vomiting; RR, 0.54 [95% CI, .35–.83]) were associated with significantly lower mortality rates (Table 3). In the multivariable model, only GII.4 outbreaks and healthcare-setting outbreaks remained significant (Figure 3B). In a subanalysis of GII.4 strains, GII.4 Den Haag was associated with significantly higher (P < .01) mortality rates (48 deaths per 10000 cases) as compared to GII.4 Sydney (24 deaths per 10000 cases) or GII.4 New Orleans (27 deaths per 10000 cases).
Univariate Analysis of Characteristics Associated With Mortality From Norovirus Outbreaks Reported to the National Outbreak Reporting System and CaliciNet, 2009–2016
| Mortality Rate | Models of Mortality Rate | |||||
|---|---|---|---|---|---|---|
| Characteristic | Total No. of Cases | No. of Deaths | Rate per 10000 Cases | Rate Ratio | (95% CI) | P Value |
| Outbreak characteristics | ||||||
| Non-GII.4 | 39401 | 47 | 11.9 | 1.00 | … | … |
| GII.4 | 68971 | 177 | 25.7 | 2.36 | (1.58–3.56) | <.0001 |
| Nonhealthcare settings | 34179 | 7 | 2.0 | 1.00 | … | … |
| Healthcare settings | 73534 | 217 | 29.5 | 14.50 | (7.00–35.32) | <.0001 |
| Nonfoodborne | 94549 | 220 | 23.3 | 1.00 | … | … |
| Foodborne | 13823 | 4 | 2.9 | 0.11 | (.03–.28) | <.0001 |
| Case demographics | ||||||
| <50% female | 13884 | 13 | 9.4 | 1.00 | … | … |
| ≥50% female | 60596 | 106 | 17.5 | 1.59 | (.81–3.32) | .17 |
| <50% aged ≥75 y | 39964 | 47 | 11.8 | 1.00 | … | … |
| ≥ 50% aged ≥75 y | 36447 | 111 | 30.5 | 2.59 | (1.73–3.93) | <.0001 |
| Reported symptoms | ||||||
| <75% reported vomiting | 70020 | 170 | 24.3 | 1.00 | … | … |
| ≥75% reported vomiting | 30430 | 42 | 13.8 | 0.54 | (.35–.83) | .005 |
| <25% reported fever | 69576 | 160 | 23.0 | 1.00 | … | … |
| ≥25% reported fever | 30833 | 52 | 16.9 | 0.77 | (.51–1.16) | .21 |
| Seasonality | ||||||
| May–October | 17823 | 20 | 11.2 | 1.00 | … | … |
| November–April | 90549 | 204 | 22.5 | 2.11 | (1.24–3.74) | .007 |
Abbreviation: CI, confidence interval; GII.4, genogroup II type 4.
DISCUSSION
This analysis leverages data from 2 complementary surveillance systems to provide a comprehensive description of norovirus outbreaks from both the laboratory and epidemiologic perspectives. The matched outbreaks in this analysis represent approximately one-quarter of all NORS norovirus outbreak reports, and more than one-half of all CaliciNet outbreak reports from 2009 through 2016. The seasonal distribution of norovirus genotypes in this matched subset is similar to an analysis of the full CaliciNet database [25], and transmission modes of norovirus outbreaks were likewise similar to an analysis of the full NORS database [5], indicating that our results are reasonably representative of all norovirus outbreaks captured in those surveillance systems. Using our linked dataset, we were able to identify several descriptive factors that are associated with norovirus genotype, outbreak hospitalization rates, and outbreak mortality rates.
Notably, we found that GII.4 norovirus outbreaks occurred more frequently in healthcare facilities, affected an older age group, and were more likely to occur during the typical norovirus season (November–April). In nonhealthcare settings, GII.4 norovirus outbreaks were significantly more likely to be associated with foodborne transmission, whereas no effect was seen in healthcare facilities. In terms of severe outcomes, outbreaks caused by GII.4 genotypes and occurring in healthcare facilities had higher rates of hospitalization and death. While outbreaks with a high proportion of female cases and outbreaks occurring during the norovirus season were significantly associated with lower hospitalization rates, these characteristics were not significantly associated with mortality rates in multivariable models. However, the analyses of mortality rate may be limited by lower power due to low numbers of deaths in some strata.
Several key findings are consistent with prior studies of the epidemiology of norovirus outbreaks. The associations of GII.4 genotypes with outbreak setting and transmission route have also been observed in prior analyses of outbreaks occurring in 1994–2006 [26], 2009–2013 [11], some prospective studies [27], and systematic reviews [18, 28]. GII.4 was the most commonly reported cause of outbreaks. Further, GII.4 outbreaks were longer in duration and resulted in more severe illnesses, which may be a result of prolonged viral shedding [29] or escape from prior immunity caused by novel strains [30].
The results of our regression models offer some insight in differentiating the interrelated characteristics of genotype, transmission route, setting, and host in impacting severity of norovirus outbreaks. While univariate models of genotype show that foodborne transmission is inversely associated with GII.4 genotype, this relationship unexpectedly reverses in the multivariate model. Stratifying the analysis by setting helps explain this change, as the positive association between foodborne transmission and GII.4 genotype appears to be driven fully by outbreaks occurring in nonhealthcare settings; among outbreaks occurring in healthcare settings, the association is negative or null once adjusted for other outbreak characteristics (eg, demographics). These results are somewhat surprising given previous findings of an association between foodborne transmission and non-GII.4 outbreaks [11]; however, the analysis, done by Vega et al, did not stratify by setting, and both our study and theirs noted a small number of foodborne outbreaks in the healthcare setting. Further, the Vega et al study included all norovirus outbreaks reported to CaliciNet from 2009 to 2013, whereas our study spanned from 2009 to 2016 and included only CaliciNet norovirus outbreaks that were able to be linked to their corresponding report in NORS. While our dataset had a small number of outbreaks in nonhealthcare settings in 2009, we found the associations with foodborne transmission and GII.4 to be qualitatively similar in all other years. An important caveat to our results is the low number of foodborne outbreaks in healthcare settings, which may have limited our power to detect associations or reflect biases in reporting that would have affected our results.
With respect to severe outcomes, our multivariable models show that GII.4 genotype and healthcare settings are independently associated with both higher hospitalization and mortality rates. The association of healthcare settings with hospitalizations and mortality is perhaps unsurprising, given the likely comorbidities of individuals in healthcare settings [6, 7]. However, somewhat unexpectedly, older age and symptoms of fever and vomiting were not consistently significantly associated with these outcomes in multivariable models, though point estimates of incidence rate ratios were >1 for hospitalization. It may be that there was not enough variation in outbreak demographics to show statistical significance. Perhaps surprisingly, outbreaks occurring in November–April had lower hospitalization rates after controlling for other factors, despite the fact that most outbreaks occur during this time period, especially GII.4 outbreaks. It could be that outbreaks occurring “out-of-season” are different qualitatively, even within genotypes. Alternatively, perhaps these lower hospitalization rates reflect competing syndromes during the winter season, such as acute respiratory infections (eg, influenza), which may also disproportionately affect vulnerable populations such as young children and the elderly. Analyses stratified by setting also showed a significant effect of GII.4 on hospitalization and mortality rates (data not shown). These results suggest that GII.4 genotypes cause more severe illness than non-GII.4 genotypes, regardless of the types of symptoms manifested or the location of the outbreak. Our results also further confirm the increased likelihood of severe outcomes in healthcare settings.
The association of GII.4 genotype with higher hospitalization rate adds to the mixed body of evidence of increased clinical severity caused by emergent GII.4 strains. A time-series analysis by Lopman et al showed increased rates of gastroenteritis hospitalizations in 2006–2007 coinciding with the emergence of GII.4 Den Haag, although the etiologic attribution to norovirus in this model was indirect [31]. Conversely, there was no increase in hospitalization rates in 5 states participating in a norovirus sentinel surveillance network during the emergence of GII.4 Sydney in 2012–2013 [16]. The association of GII.4 genotype with higher mortality was seen in a systematic literature review [18], and increased norovirus-associated mortality has been estimated to occur during seasons in which pandemic GII.4 variants emerged (ie, 2001–2002 and 2006–2007) [32]. It may be that some strains are more virulent than others. In a subanalysis of our data, we found that GII.4 Den Haag was associated with significantly higher rates of mortality and morbidity compared with GII.4 New Orleans or GII.4 Sydney; however, it should be noted that GII.4 Den Haag was reported in fewer outbreaks, and data were too sparse to control for other factors.
Our analysis is subject to several limitations. Both NORS and CaliciNet are surveillance systems for reporting outbreaks; therefore, these results may not be generalizable to endemic norovirus disease. Furthermore, both systems are voluntary with a minimal set of required data, resulting in incomplete reporting on demographic, symptom, and outcome variables. There may be bias toward reporting outbreaks that are larger in size, longer in duration, or those associated with more severe outcomes, and reporting and coding practices may differ by state. Additionally, our ability to characterize the host is limited to the collection of aggregated data on age and sex. Other host characteristics, such as comorbidities and genetic predisposition, would be helpful in further clarifying the contribution of host factors to clinical outcomes. Last, given the relatively low numbers of reported deaths, our power may have been limited in analyses of mortality, particularly in multivariable analyses.
Despite these limitations, this analysis is unique in its size (3747 outbreaks) and comprehensiveness of included laboratory and epidemiologic data. The results offer valuable insights into the interrelationships among the epidemiologic triad of norovirus genotype, outbreak setting, and host demographics that contribute to the severe outcomes of hospitalization and death. To reduce hospitalizations and mortality from norovirus outbreaks, GII.4 viruses should be included in norovirus vaccines in development [33], and individuals in healthcare settings should be considered as potential targets. Furthermore, providers and public health officials should be vigilant for the possibility of more severe outcomes when a novel GII.4 variant emerges.
Supplementary Data
Supplementary materials are available at The Journal of Infectious Diseases online. Consisting of data provided by the authors to benefit the reader, the posted materials are not copyedited and are the sole responsibility of the authors, so questions or comments should be addressed to the corresponding author.
Notes
Disclaimer. The findings and conclusions in this report are those of the authors and do not necessarily represent the official position of the CDC.
Financial support. This study was supported in part by appointment to the Research Participation Program at the CDC (to Z. M.) administered by the Oak Ridge Institute for Science and Education through an interagency agreement between the US Department of Energy and the CDC. This study was supported in part by the National Institute of Food and agriculture, US Department of Agriculture, under award number 2011-68003-30395.
Potential conflicts of interest. All authors: No reported conflicts of interest. All authors have submitted the ICMJE Form for Disclosure of Potential Conflicts of Interest. Conflicts that the editors consider relevant to the content of the manuscript have been disclosed.
References
Author notes
R. M. B. and M. P. S. contributed equally to this work.

