


Abstract
The burden of human coronavirus (HCoV)-associated respiratory tract infections (RTIs) in hospitalized children is poorly defined. We studied the occurrence and hospitalization rates of HCoV over 9 years.
Children from Sør-Trøndelag County, Norway, hospitalized with RTIs and asymptomatic controls, were prospectively enrolled from 2006 to 2015. Nasopharyngeal aspirates were analyzed with semiquantitative polymerase chain reaction (PCR) tests for HCoV subtypes OC43, 229E, NL63, and HKU1, and 13 other respiratory pathogens.
HCoV was present in 9.1% (313/3458) of all RTI episodes: 46.6% OC43, 32.3% NL63, 16.0% HKU1, and 5.8% 229E. Hospitalization rates for HCoV-positive children with lower RTIs were 1.5 and 2.8 per 1000 <5 and <1 years of age, respectively. The detection rate among controls was 10.2% (38/373). Codetections occurred in 68.1% of the patients and 68.4% of the controls. In a logistic regression analysis, high HCoV genomic loads (cycle threshold <28 in PCR analysis) were associated with RTIs (odds ratio = 3.12, P = .016) adjusted for relevant factors.
HCoVs occurred in 1 of 10 hospitalized children with RTIs and asymptomatic controls. A high HCoV genomic load was associated with RTI. HCoVs are associated with a substantial burden of RTIs in need of hospitalization.
Human coronaviruses (HCoV) are commonly detected in nasopharyngeal aspirates (NPAs) from children with respiratory tract infections (RTIs). They were first described in the 1960s as agents of the common cold [1–3]. Recently, HCoV has received renewed interest, due to both more sensitive diagnostic methods and increased attention to HCoV after the SARS outbreak in 2002, resulting in the identification of new HCoV subtypes [4–7].
Six species of HCoV infect humans: OC43, 229E, SARS, NL63, HKU1, and MERS. While SARS and MERS are feared for their potential for severe illness and pandemics [8], the other subtypes have traditionally been associated with milder upper RTIs (URTIs). In children, however, HCoV may also cause lower respiratory tract infections (LRTIs) in need of hospitalization [9–12], but only a few population-based reports have precisely estimated the risk of HCoV-associated hospitalizations [13–16].
OC43, NL63, 229E, and HKU1 are distributed worldwide [17–19], and their detection frequency varies [15, 19–21]. Some studies found similar [21–23], or even lower [24], detection rates of HCoV among hospitalized children compared to controls. In addition, long-term studies of HCoV are rare and most previous studies lack the inclusion of asymptomatic controls. Hence, the significance of HCoV detections in children with LRTIs, the seasonality, and the overall burden of HCoV in hospitalized children remains poorly defined.
To address this lack of information, we used data from a 9-year prospective population-based survey of children admitted to St Olavs Hospital in Norway. Our primary aim was to determine the occurrence of HCoV detections in children hospitalized with RTI and the hospitalization incidence rates for HCoV-associated LRTIs in children. To help evaluate the role of HCoV in RTIs, we compared the presence and genomic loads of HCoVs between hospitalized children with RTIs and an asymptomatic control group.
METHODS
Study Setting
The study was conducted at the Children’s Department at St Olavs Hospital in Trondheim, Norway. The Department of Pediatrics is the sole pediatric reference center for approximately 59000 children in Sør-Trøndelag County.
Study Population
From November 2006 to July 2015 we conducted a prospective surveillance study, enrolling all children admitted to the Children’s Department at St Olavs Hospital with symptoms and signs of RTIs. Most patients were enrolled during their stay at the hospital, and some were retrospectively included after hospital discharge. Children hospitalized <24 hours were further defined as outpatients.
Exclusion criteria were: (1) age over 16 years, (2) hospital-acquired RTIs, including newborns not discharged from the hospital, (3) ongoing cytostatic and/or immune-suppressive treatment, and (4) a non-RTI primary infectious diagnosis. The same child could be included more than once with different RTI episodes.
Children admitted to elective surgery from 2007 to 2015 were recruited monthly as the control group. Their caregivers were asked to confirm that they were asymptomatic for RTIs the previous 2 weeks. In addition, children undergoing ear, nose, or throat surgery were not included in the control group.
Caregivers and older children (>12 years) received both oral and written information about the study during their stay at the hospital. Written consent to participate was collected from most caregivers. Invitation letters were sent to the children and their caregivers after discharge if nasopharyngeal aspirates (NPAs) had been taken for clinical purposes but they had not been asked to participate in the study due to practical challenges. No response after 2 weeks was regarded as passive consent.
Clinical Investigation and Disease Classifications
All children with RTI were examined, diagnosed, and treated by physicians in accordance with the hospital’s routines. A physician or member of the study group recorded relevant study information before discharge. For children included after discharge, the data were collected from medical records. Participants were divided in 2 main groups: URTIs and LRTIs. URTIs included a diagnosis of rhinosinusitis, pharyngitis, tonsillitis, otitis media, and acute laryngitis without signs of LRTIs. A LRTI was defined as the presence of dyspnea, signs of lower airway obstruction (wheezing, retractions), and/or a chest roentgenogram with positive results such as infiltrates, atelectasis, and/or air trapping [25].
Laboratory Methods
NPAs were routinely collected from all children, and placed into a universal virus transport medium without antibiotics. A total of 94% of all NPAs were sampled during the first 2 days of hospitalization. Clinical laboratory technicians also performed in-house TaqMan real-time polymerase chain reaction (RT-PCR) tests to detect respiratory pathogens [9]. We analyzed for 4 subtypes of HCoV: OC43, NL63, 229E, and HKU1. Thirteen other viruses were also routinely tested for: human adenovirus (HAdV), human bocavirus (HBoV), human enterovirus (HEV), human parechovirus (HPeV), human metapneumovirus (HMPV), influenza virus A and B (FLUA/B), parainfluenza virus (PIV) types 1–4, respiratory syncytial virus (RSV), and human rhinovirus (HRV). Semiquantitative results were reported based on the cycle threshold value (Ct value), with a high genomic load defined as a Ct value <28, a medium load defined as a Ct value of 28 to <35, and a low load defined as a Ct value 35–40. Lastly, a Ct value >40 was regarded as a negative test.
Epidemiologic Year and Incidence Calculations
We defined an epidemiologic year from the beginning of August to the end of July in the following year. The annual hospitalization (incidence) rates were estimated based on: (1) HCoV detection rates for children hospitalized ≥24 hours with a LRTI from our survey, (2) statistics on a LRTI diagnosis in need of hospitalization from the hospital’s Patient Administrative System (PAS), and (3) population data for Sør-Trøndelag County provided by Statistics Norway. In the PAS, a LRTI was defined as a main diagnosis (ICD-10 code) of pneumonia (J10.0, J11.0, J12.0–J12.9, and J13-J15), bronchitis (J20), bronchiolitis (J21), unspecified LRTI (J22), and/or asthma exacerbation (J45–J46). We were not able to exclude children hospitalized <24 hours in the PAS.
Statistical Analysis
Data were described with mean, median, interquartile range, or percentages, as appropriate. Categorical data were analyzed with a Pearson X2 test or a Fisher exact test, and reported with odds ratios (OR). Continuous and not normally distributed data (age) were tested with a Mann-Whitney U test.
To determine the relationship between HCoV and RTIs, we conducted unadjusted analyses on relevant predefined variables, including genomic load, season, codetection of severe RTI-causing viruses, age, gender, and high-risk condition such as chronic disease and/or premature birth. A multivariate logistic regression was performed on the significant variables extracted from the unadjusted analyses to help determine the independent association of each variable with RTIs. The strength of the associations was reported with ORs and 95% confidence intervals.
For all tests, a P value < .05 was considered statistically significant, and all analyses were performed using IBM SPSS Statistics 24 or SigmaPlot 14.0 software.
Ethics
The study was approved by the Regional Committees for Medical and Health Research Ethics Central in 2006 (No: 4.2006.2289) and 2012 (No: 2012.1042).
RESULTS
Occurrence of Human Coronaviruses
During a 9-year period from November 2006 to July 2015, we included 3458 episodes of RTIs in hospitalized children and 373 controls. HCoVs were detected in 9.1% (313 of 3458) of the episodes in the patient group, and were the fifth most common viruses after HRV (58.2%), RSV (29.3%), HEV (11.3%), and PIV type 1–4 (9.1%). A total of 39.3% (123 of 313) of the children with a positive HCoV infection were outpatients.
The detection rate of HCoV in the control group was 10.2% (38 of 373), and HCoVs were the fourth most commonly detected viruses after HRV (46.9%), HEV (24.7%), and PIV type 1–4 (10.7%).
Characteristics of Patients and Controls
The prevalence of HCoV was equal in the two groups, although detection rates of HCoVs in cases and controls differed when stratified by age (Supplementary Table 1). Children with RTIs were younger (P = .001) and more likely to have a high-risk condition such as chronic diseases and/or premature birth (P = .036) (Table 1).
Characteristics of Children with Respiratory Tract Infections and Asymptomatic Controls With Human Coronavirus Detection
| Children With HCoV, No. (%)a | ||||
|---|---|---|---|---|
| Characteristics | Patients (n = 313) | Controls (n = 38) | ||
| Age, median (IQR), mo | 14.8 | (4.9–27.3) | 41.8 | (27.0–68.2) |
| Age group | ||||
| <6 mo | 89 | (28.4) | 1 | (2.6) |
| 6–11 mo | 45 | (14.4) | 2 | (5.3) |
| 12–23 mo | 89 | (28.4) | 4 | (10.5) |
| 24–59 mo | 63 | (20.1) | 17 | (44.7) |
| ≥60 mo | 27 | (8.6) | 14 | (36.8) |
| Female | 123 | (39.3) | 4 | (10.5) |
| High-risk condition | 90c | (29.2) | 5 | (13.2) |
| Premature birth (gestational age <36 wk) | 52d | (17.0) | 4 | (10.5) |
| ≥1 Chronic diseaseb | 58 | (18.5) | 2 | (5.3) |
| Season | ||||
| Aug–Oct | 12 | (3.8) | 4 | (10.5) |
| Nov–Jan | 173 | (55.3) | 17 | (44.7) |
| Feb–Apr | 105 | (33.5) | 14 | (36.8) |
| May–Jul | 23 | (7.3) | 3 | (7.9) |
| RTI | ||||
| LRTI | 44 | (14.1) | ||
| Combined LRTI and URTI | 165 | (52.7) | ||
| URTI | 104 | (33.2) | ||
Abbreviations: Ct, cycle threshold; HCoV, human coronaviruses; IQR, interquartile range; LRTI, lower respiratory tract infection; URTI, upper respiratory tract infection.
aData represent No. (%) of children unless otherwise specified.
bChronic disease: heart disease, neurologic disease, and/or pulmonary disease.
cMissing data in 5 patients.
dMissing data in 8 patients.
Among the HCoV-positive patients, 46.6% (146 of 313) were positive for OC43, 32.3% (101 of 313) for NL63, 16.0% (50 of 313) for HKU1, and 5.8% (18 of 313) for 229E. Two children were infected with both NL63 and 229E.
In the control group, 31.6% (12 of 38) were positive for OC43, 36.8% (14 of 38) for NL63, 18.4% (7 of 38) for HKU1, and 15.8% (6 of 38) for 229E. One control was positive for both NL63 and 229E.
Seasonal and Annual Variations in HCoV in Hospitalized Patients
HCoV was detected among patients in all 9 years. The average detection rate was 34.8 per season, with a range from 18 in 2013/2014 to 60 in 2006/2007 (Figure 1).
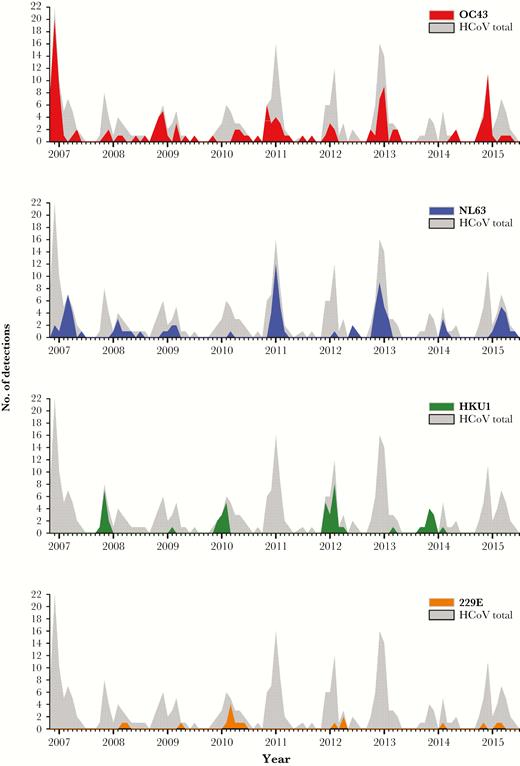
Number of detections per month of human coronavirus (HCoV) subtypes in nasopharyngeal aspirates from children hospitalized with respiratory tract infections from November 2006 to July 2015. Gray shade represents the total number of HCoV detections and colored area represent HCoV subtypes.
Overall, the majority of HCoV detections (71.9%) occurred during the period from November through March, with an average of 51 detections each month. From April to October, the average monthly detection rate was 8.3. During the study period, the highest number of detections per month were in December, and there was only 1 detection in August.
The detection pattern of HCoVs varied with subtypes and seasons. OC43 was the most frequently detected HCoV, and we found a high number of OC43 detections every second season. This was also true for NL63, with the exception of the 2008/2009 season. In high-detection seasons (excluding 2008/2009), the average rate was 26 detections per year for OC43 and 20 for NL63. In low-detection years, the average detection rate was 6 detections per year for OC43 and 4 for NL63 (excluding 2008/2009).
During the 9-year period, OC43 was detected in all months of the year, but not in every month in all years. This was not true for NL63, which was never detected from August through October. OC43 was detected before NL63 in each season.
HKU1 appeared with high numbers every second season, when detection rates for OC43 and NL63 were low. In the high-detection seasons, HKU1 had an average detection rate of 12 per season, and 88% of HKU1 detections appeared in the months from November to February.
229E was seldom detected, with an average of only 3 detections per year.
Codetections Among Patients and Controls
Among HCoV-positive patients, 31.9% had a single HCoV infection, 41.9% had 2 viruses (including those with both OC43 and 229E), and 26.2% had ≥3 viruses detected (Table 2). For the control group, the corresponding figures were 31.6% with a single HCoV detection, 15.8% with 2 viruses detected, and 52.6% with ≥3 viruses detected (Supplementary Table 2). Hence, it was not more likely for a single HCoV to be detected in the patient group compared to the control group (OR = 1.02, P = .96).
Virus Detections and Codetected Viruses in Human Coronaviruses (HCoV)-Positive Nasopharyngeal Aspirates from Children with Respiratory Tract Infections From 2006 to 2015
| HCoV Detections, Total and Subtypes, No. (%) | |||||
|---|---|---|---|---|---|
| Total HCoV (N = 313) | OC43 (n = 146) | NL63 (n = 101) | HKU1 (n = 50) | 229E (n = 18) | |
| Respiratory viruses | |||||
| Rhinovirus | 78 (25.0) | 35 (24.0) | 21 (20.8) | 16 (32.0) | 7 (38.9) |
| Respiratory syncytical virus | 73 (23.4) | 33 (22.7) | 28 (27.8) | 10 (20.0) | 2 (11.2) |
| Enterovirus | 52 (16.7) | 23 (15.8) | 14 (13.9) | 12 (24.0) | 4 (22.3) |
| Human bocavirus | 35 (11.2) | 17 (11.7) | 10 (10.0) | 6 (12.0) | 2 (11.2) |
| Parainfluenza virus types 1–4 | 31 (10.0) | 12 (8.3) | 9 (9.0) | 7 (14.0) | 3 (16.7) |
| Human parechovirus | 22 (7.1) | 9 (6.2) | 7 (7.0) | 5 (10.0) | 1 (5.6) |
| Adenovirus | 20 (6.4) | 13 (9.0) | 4 (4.0) | 2 (4.0) | 1 (5.6) |
| Human metapneumovirus | 15 (4.8) | 6 (4.2) | 2 (2.0) | 6 (12.0) | 1 (5.6) |
| Influenzavirus A/B | 8 (2.6) | 3 (2.1) | 5 (5.0) | ||
| No. of detections | |||||
| Single HCoV detection | 100 (32) | 50 (34.3) | 32 (31.7) | 12 (24.0) | 6 (33.4) |
| HCoV + 1 codetection | 132 (42.2) | 60 (41.1) | 45 (44.6) | 22 (44.0) | 6 (33.4) |
| HCoV + ≥2 codetections | 81 (25.9) | 36 (24.7) | 24 (23.8) | 16 (32.0) | 6 (33.4) |
The most common codetections in the patient group were HRV (24.9%), RSV (23.3%), and HEV (16.6%) (Table 2). In total, 36.7% had codetection of viruses known to cause severe RTIs in need of hospitalization (RSV, HMPV, PIV type 1–3, and FLUA/B). In the control group, the most common codetected viruses were HRV (42.1%), HEV (34.2%), and PIF 1–4 (21.1%), while the detection of viruses known to cause severe RTIs were rare in this group (Supplementary Table 2). Hospitalized children with RTI and HCoV detection were more likely to have a codetection with a severe RTI-causing virus (RSV, HMPV, PIV type 1–3, and FLUA/B) than the control group (OR = 3.4, P < .004).
Comparison of HCoV Genomic Loads Between Patients With RTIs and Asymptomatic Controls
A total of 43.5% of the children with RTIs had a high HCoV genomic load, 30.7% had a medium load, and 25.9% had a low load. For the controls, the corresponding numbers were 21.1%, 36.8%, and 42.1%, respectively.
HCoV-positive children with RTIs more often had a high genomic load compared to asymptomatic controls (OR = 2.59, P = .010) (Table 3). Among children with RTIs, a high genomic load was detected in 67.0% with a single HCoV detection, 24.3% with codetections of severe RTI-causing viruses, and 41.8% with codetections of other viruses (P < .001). Patients with a sole HCoV detection were more likely to have a high genomic load of HCoV compared to patients with codetections of severe RTI-causing viruses (OR = 6.3, P < .001). In contrast, there were no significant differences in genomic load between controls with single detections and controls with codetections (OR = 1.11, P = .722).
Relationship Between HCoV and RTI, Comparing Children With RTI (n = 313) and Asymptomatic Controls (n = 38)
| Univariate analysis | Adjusted analysis | |||||
|---|---|---|---|---|---|---|
| OR | (95% CI) | P value | OR | (95% CI) | P value | |
| HCoV viral load | ||||||
| Ct value <28 | 2.59 | (1.21–5.54) | .010 | 3.12 | (1.24–7.86) | .016 |
| Ct value >28 (reference) | ||||||
| Season | ||||||
| Aug–Oct | 0.39 | (0.08–2.04) | NS | |||
| Nov–Jan | 1.33 | (0.36–4.88) | NS | |||
| Feb–Apr | 0.98 | (0.26–3.68) | NS | |||
| May–Jul (reference) | ||||||
| Codetection severe virusa | 3.43 | (1.37–8.56) | .004 | 3.35 | (1.14–9.85) | .028 |
| Age | ||||||
| 0–2 y | 16.52 | (6.13–44.5) | <.001 | 15.32 | (5.15–45.5) | <.001 |
| 2–5 y | 1.92 | (0.83–4.45) | NS | 1.59 | (0.60–4.17) | NS |
| > 5 y (reference) | ||||||
| Female | 5.50 | (1.91–15.9) | <.001 | 4.62 | (1.49–14.3) | .008 |
| High-risk conditionb | 2.50 | (1.01–6.21) | .036 | 4.61 | (1.58–13.5) | .005 |
Variables with P value < .05 in the univariate analysis were included in the multivariate analysis.
Abbreviations: CI, confidence interval; Ct, cycle threshold; HCoV, human coronaviruses; NS, nonsignificant; OR, odds ratios; RTI, respiratory tract infection.
aIncludes respiratory syncytial virus, human metapneumovirus, influenza virus type A and B, and parainfluenza virus types 1–3.
bHigh-risk condition: heart disease, neurologic disease, and pulmonary disease.
The Relationship Between HCoV and RTIs
We investigated the relationship between HCoV detection and RTIs in consideration of other factors in a multiple regression model. A high genomic load of HCoV was independently associated with RTIs (OR = 3.12, P = .016), and adjusted for the codetection of severe RTI-causing viruses, age, gender, and high-risk conditions (Table 3).
Hospitalization Rates
A total of 60.7% (190 of 313) of the HCoV-positive children with RTIs were hospitalized for more than 24 hours. In this group, 73.7% were diagnosed with a LRTI. From November 2006 to December 2015, the average yearly hospitalization rate of children with HCoV and LRTIs was 1.5 per 1000 children younger than 5 years, and 2.8 per 1000 children younger than 1 year (Table 4). The yearly hospitalization rates ranged from 0.5 to 3.2 per 1000 children younger than 5 years and 0.9 to 5.5 per 1000 children younger than 1 year (Table 4).
Hospitalizationa Incidence Rates in Children With LRTI and HCoV Detection, by Age and Season
| Hospitalization per 1000 Children with LRTI, by Age | |||||
|---|---|---|---|---|---|
| Season | 0–11 mo | 12–23 mo | 24–59 mo | 5–16 y | 0–59 mo |
| 2006–2007 | 5.5 | 3.6 | 1.0 | 0.1 | 2.5 |
| 2007–2008 | 1.8 | 0.2 | 0.5 | ||
| 2008–2009 | 2.7 | 2.8 | 0.2 | 1.2 | |
| 2009–2010 | 1.7 | 2.0 | 0.1 | 0.8 | |
| 2010–2011 | 1.7 | 2.5 | 0.6 | 0.1 | 1.1 |
| 2011–2012 | 1.5 | 4.3 | 0.2 | 1.3 | |
| 2012–2013 | 4.6 | 3.9 | 1.3 | 0.1 | 2.4 |
| 2013–2014 | 0.9 | 0.5 | 0.5 | 0.6 | |
| 2014–2015 | 4.9 | 4.8 | 2.4 | 0.1 | 3.2 |
| Mean (95% CI) | 2.8 (1.7– 3.9) | 2.7 (1.7–3.7) | 0.7 (0.2–1.2) | 0.1 (0.0–0.1) | 1.5 (0.9–2.1) |
Abbreviations: CI, confidence interval; HCoV, human coronaviruses; LRTI, lower respiratory tract infection.
aChildren hospitalized ≥24 hours.
It is difficult to determine the real burden of HCoV due to influencing factors such as codetections and genomic loads estimations. We therefore also calculated separate hospitalization rates for the detection of OC43 or NL63, including single infections and the detection of high genomic loads (Supplementary Table 3). For children younger than 5 years, approximately one-third of the OC43 and NL63 detections had a high genomic load, with one-fifth single infections. Thus, the hospitalization rate for children younger than 5 years with a high genomic load of OC43 was 3.0 per 10000, and 1.6 for a high genomic load of NL63.
DISCUSSION
Main Findings
HCoV occurred in approximately 1 of 10 hospitalized children with RTIs and controls during the 9-year period. The 4 investigated HCoV subtypes had different detection rates and different seasonal distributions. Although more than two-thirds in both groups were codetected with other viruses, our data support that HCoV leads to a substantial burden of RTIs in need of hospitalization. The average hospitalization rate of children with LRTIs and HCoV detection was 1.5 per 1000 children <5 years old, and 2.8 per 1000 children <1 year old.
Seasonal Variations of HCoV Subtypes
Almost half of all HCoV detections were OC43 and one-third were NL63, whereas HKU1 and 229E appeared infrequently . All HCoV subtypes were primarily detected in winter, from November through March, with some detections throughout the year. Our data verify findings from studies in both the US and Europe, which report the highest detection rates in the winter and spring seasons [10, 17, 18, 26–29]. Others have reported that in Asia, HCoV may peak during all seasons of the year [19, 22, 30, 31]. Consequently, the seasonal circulation of HCoVs is possibly dissimilar in temperate and tropical regions [30].
In our study, OC43 and NL63 appeared in winter epidemics with clear biennial peaks, whereas HKU1 appeared in alternating winter outbreaks with low OC43 and NL63 activity. HKU1 was rarely detected outside outbreaks, and 229E only appeared sporadically. Dijkman et al diagnosed HCoV infections by serology, and observed a similar pattern [20]. On this basis, the authors hypothesized that cross-reacting antibodies may be induced during OC43 and NL63 infections, thereby explaining why outbreaks of other HCoV subtypes seldom occur at the same time, and the lower detection rates of HKU1 and 229E [20].
The Relation Between HCoV and RTIs in Need of Hospitalization
Using PCR, the average detection rate of HCoV in hospitalized children with RTIs in the present study was 9.1%, varying with a factor of 3.3 between seasons. Previous studies of a shorter duration have reported HCoV detection rates with larger variations from 1% to 15% [15, 19–21]. We also found that the control group had a detection rate of similar magnitude (10.2%), as has been reported before [21, 23]. This finding may question whether HCoVs are the causal pathogen of RTIs when HCoVs are detected in nasopharyngeal aspirates. Another prominent finding was the high viral codetection rates in more than two-thirds of the infected children, as well as in the controls. Previously, somewhat lower codetection rates have been reported [10, 17, 18, 22, 30], but our finding might simply reflect the high number of virus types analyzed in our study. In the current study, children with RTIs were more likely to have a codetection of RSV and other viruses known for their potential to cause severe RTIs, whereas controls more often had a codetection of less-pathogenic viruses. This finding might also question whether HCoV caused the RTIs in this study. However, we made 3 observations on the basis of genomic loads estimations, which support that HCoV causes RTIs among hospitalized children. First, assuming that a high genomic load more than a low genomic load usually indicates an active infection, we found that children with RTIs were more likely to have a high HCoV genomic load than the controls. Second, children with a single HCoV infection were more likely to have a higher genomic load (67%) compared to those with a codetection of rhinovirus and other less-pathogenic viruses (41.8%), and those with codetections of RSV and other viruses with the potential to cause severe RTIs (24.3%). van der Hoek et al have published similar findings for HCoV subtype NL63 [16]. Finally, a high genomic load of HCoV was independently associated with RTIs in multiple logistic regression analyses, adjusted for severe viral codetections and other confounder variables.
In the control group, HCoV genomic load did not differ between those with single and codetections. On the basis of this observation, we suggest that detections of low levels of nucleic acids from HCoV in the controls are more likely to be traces from previous infections rather than an expression of ongoing asymptomatic infections, for which we would have expected higher HCoV loads to be present. Unfortunately, serologic analyses were not available and cultures are not helpful, as HCoV does not grow in conventional cell lines.
Hospitalization Rates of Children With HCoV and LRTIs
The average hospitalization rate of children with LRTIs and HCoV detection was 1.5 per 1000 children <5 years old. Children <1 year had a higher rate of 2.8 per 1000 children. These figures may be an overestimation due to the possible contribution of RSV and other codetected viruses, but because the exact causal contribution of each codetected virus is difficult to ascertain, we decided to report incidence rates based on the total number of HCoV-positive samples. Our incidence rates were calculated only for LRTIs, because URTIs are underreported in our hospital patient administrative system. Previously, only a few studies have reported hospitalization rates in HCoV-infected children, and these data are difficult to compare with ours [13–16]. On the basis of calculations in our dataset, we have recently published a somewhat higher hospitalization rate for HMPV compared to HCoV (1.9 LRTIs per 1000 children <5 years old), and RSV appeared 7 times more often (10.5 LRTIs per 1000 children <5 years old) [25].
To give a more precise estimation of the burden of HCoV, we also reported on the LRTI hospitalization rates for detections with high genomic loads and single detections of OC43 and NL63. However, these figures may be underestimations because the presence of other viruses or a low HCoV load cannot exclude a possible causal contribution by HCoVs. For children younger than 5 years, the hospitalization rates for a high genomic load of OC43 and NL63 infections were 3.0 and 1.6 per 10000 children, respectively. In a comparable study over 5 consecutive years, van der Hoek et al reported a somewhat higher hospitalization rate for NL63 (2.2 per 10000 children <3 years old), even when they defined a NL63 infection as a single NL63 detection with high genomic loads (>10000 copies/mL in nasopharyngeal aspirate) [16].
Limitations
The strengths of the present study are the population basis and prospective enrollment of children with infections from the same county in Norway over a 9-year period. It is also an advantage that during the entire study period we have used the same PCR tests for a high number of virus types, and the use of semiquantitative genomic loads estimations. Although the cross-sectional design is not optimal, the inclusion of asymptomatic controls allowed us to study causal relations between HCoV and infection. The nasal swabs from the control group were sampled during anesthesia, which might have resulted in higher viral detection rates. Age and gender differed among cases and controls, but was controlled for in the analyses.
CONCLUSION
Our 9-year population-based study shows that the HCoV subtypes OC43, NL63, 229E, and HKU1 appear in hospitalized Norwegian children with characteristic outbreak patterns, primarily in the winter. Although detection rates were equal between children with RTIs and controls, our data support that HCoVs contribute to respiratory tract infections in hospitalized children.
Supplementary Data
Supplementary materials are available at The Journal of Infectious Diseases online. Consisting of data provided by the authors to benefit the reader, the posted materials are not copyedited and are the sole responsibility of the authors, so questions or comments should be addressed to the corresponding author.
Notes
Acknowledgments. We acknowledge the contributions of Dr Anne-Gro Wesenberg Rognlien, Oslo University Hospital, Oslo, Norway, research nurses Ragnhild Widerø, Stine Saus, Wenche Håhjem, Barbro Medås, Siv Anita Myhre, and Dr Per Eirik Hæreid†, all at the Department of Pediatrics, and the biomedical scientists at the Department of Medical Microbiology, St Olavs University Hospital.
Disclaimer. The financing institutions had no role in the design or conduct of the study, in the collection, management, analysis or interpretation of the data; or in the preparation of the manuscript. All findings are the result of independent contributions of the authors. The decision to publish the data was made solely by the authors, who are fully responsible for all contents of the manuscript.
Financial support. This work was supported by the Central Norway Regional Health Authority (grant number 96987/2008); Trondheim University Hospital (grant number 13/8985-119); and the Student Research Program at the Norwegian University of Science and Technology.
Potential conflicts of interest. All authors: No reported conflicts of interest. All authors have submitted the ICMJE Form for Disclosure of Potential Conflicts of Interest. Conflicts that the editors consider relevant to the content of the manuscript have been disclosed.
Presented in part: European Society for Clinical Virology meeting, September 2017, Stresa, Italy (poster).

