


Abstract
We propose an outcome indicator, the percentage of newly diagnosed persons achieving viral suppression within 3 months of diagnosis, to be included in the US National HIV/AIDS Strategy to monitor the progress in human immunodeficiency virus (HIV) care among persons newly diagnosed with HIV. Using HIV registry data, we reported that the percentage in New York City increased from 9% in 2007 to 37% in 2016. We recommend that the Centers for Disease Control and Prevention and local health agencies use this new indicator to monitor the progress in HIV care among persons newly diagnosed with HIV in the United States.
(.)
Antiretroviral therapy (ART) can significantly improve the length and quality of life of persons living with HIV (PLWH) [1, 2]. Observational studies and randomized controlled trials have long shown the treatment benefits of ART for persons with a low CD4 cell count [3, 4]. Lately, randomized controlled trials among persons with a CD4 count >500 cells/μL demonstrated that those randomized to receive ART immediately had significantly lower morbidity and mortality, compared to those randomized to receive ART only when their CD4 count was <350 cells/μL [5, 6]. Based on these results, the US Department of Health and Human Services (DHHS) in 2012 updated its guidelines to recommend immediate initiation of ART for all PLWH.
ART also reduces the risk of HIV transmission by reducing the viral load of PLWH. Studies have shown that lower plasma HIV viral load is associated with lower risk of transmission [7, 8]. In January 2008, the Swiss Federal Commission for HIV/AIDS made a statement that “an HIV-infected person on ART with completely suppressed viremia (“effective ART”) is not sexually infectious, ie, cannot transmit HIV through sexual contact” [9].
For persons newly diagnosed with HIV, prompt ART initiation is essential in reducing morbidity and mortality and decreasing risk of transmitting HIV to their sexual partners. To maximize the benefits of ART, in 2016, San Francisco implemented the RAPID (Rapid ART Program Initiative for HIV Diagnoses) program and New York City (NYC) implemented the JumpstART program to provide immediate ART upon HIV diagnosis [10].
The US National HIV/AIDS Strategy (NHAS) lists 2 indicators to monitor the progress in HIV care among PLWH, including 1 process indicator, the percentage of persons with diagnosed HIV infection who are retained in HIV medical care, with a target of 90% by 2020, and 1 outcome indicator, the percentage of persons with diagnosed HIV infection who are virally suppressed, with a target of 80% by 2020. However, to monitor persons newly diagnosed with HIV, there is only 1 process indicator, the percentage of newly diagnosed persons linked to HIV medical care within 1 month of diagnosis, with a target of 85% by 2020.
Outcome indicators reflect the impact of a healthcare service or an intervention on the health status of the population, and are often treated as the “gold standard” in measuring quality of care. Previous studies have shown that persons newly diagnosed with HIV achieve better health outcomes when they are timely linked to HIV medical care and receive early treatment [5, 10]. Therefore, in addition to the process indicator, we propose a new outcome indicator, the percentage of newly diagnosed persons achieving viral suppression within 3 months of diagnosis, to be included in the NHAS to monitor HIV care among persons newly diagnosed with HIV. In this article, we use this new indicator to report the progress made in NYC from 2007 to 2016.
METHODS
Data Source
The data source was the NYC HIV surveillance registry. As of 31 December 2017, the registry contained a cumulative total of >240000 cases and >10 million laboratory tests.
Study Design and Study Population
We conducted a retrospective cohort study among persons newly diagnosed with HIV in NYC between 1 January 2007 and 31 December 2016, and reported to the NYC Department of Health and Mental Hygiene (DOHMH) by 30 September 2017 (N = 32775). We removed persons who were first diagnosed through routine HIV testing of autopsies performed by the Office of the Chief Medical Examiner (n = 388), were <13 years of age (n = 67), and were not NYC residents (n = 4397). To minimize misclassification of new diagnoses, we further excluded persons who had an undetectable viral load within 7 days of HIV diagnosis (n = 403). These inclusion and exclusion criteria resulted in a final analytic population of 27520 persons. The study population was followed up for 3 months after HIV diagnosis. The outcome of interest, achieving viral suppression within 3 months of diagnosis, was defined as ever having a viral load measurement <200 copies/mL in the first 3 months of diagnosis [11].
Statistical Analysis
We first report the overall trends in both process and outcome indicators, the percentage of newly diagnosed persons linked to HIV medical care within 1 month of diagnosis, and the percentage of newly diagnosed persons achieving viral suppression within 3 months of diagnosis in NYC, 2007–2016. Because this is a cohort study design, the percentage of newly diagnosed persons achieving viral suppression within 3 months of diagnosis equals the cumulative incidence of persons who ever achieved viral suppression within 3 months of diagnosis. We then describe the percentages by sex, race/ethnicity, age, and HIV transmission risk factor.
RESULTS
A total of 27520 new diagnoses were included in the analysis. The annual number of new diagnoses decreased by 46%, from 3649 in 2007 to 1977 in 2016. The process indicator, the percentage of newly diagnosed persons linked to HIV medical care within 1 month of diagnosis, increased steadily from 56% in 2007 to 79% in 2017; the outcome indicator, the percentage of newly diagnosed persons achieving viral suppression within 3 months of diagnosis, increased from 9% in 2007 to 37% in 2016 (Figure 1). The increase in viral suppression among newly diagnosed persons accelerated from the initial 2007–2011 period (average annual increase of 1.0 percentage point) to the 2012–2016 period (average annual increase of 5.3 percentage points).
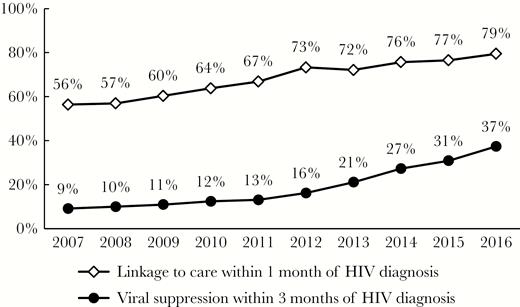
Percentages of newly diagnosed persons linked to care within 1 month and achieving viral suppression within 3 months of human immunodeficiency virus (HIV) diagnosis in New York City, 2007–2016.
Table 1 shows the percentage of newly diagnosed persons achieving viral suppression within 3 months of diagnosis in NYC, 2007–2016. Males were less likely to achieve viral suppression than females in 2007 (7.6% vs 13.3%) but had a larger increase during the study period and reached a level almost equivalent to females by 2016 (37.0% vs 38.9%). Blacks and Hispanics had higher percentages than whites in the 2007–2009 period, but lower percentages in the 2013–2015 period. In 2016, the percentages were similar among whites and Hispanics (40.0% and 39.5%, respectively), and higher among those 2 groups than for blacks (33.6%).
Percentage of Newly Diagnosed Persons Achieving Viral Suppression Within 3 Months of Human Immunodeficiency Virus Diagnosis in New York City, 2007–2016
| Characteristic | 2007 | 2008 | 2009 | 2010 | 2011 | ||||||||||
|---|---|---|---|---|---|---|---|---|---|---|---|---|---|---|---|
| No.a | no.b | no./No., % | No.a | no.b | no./No., % | No.a | no.b | no./No., % | No.a | no.b | no./No., % | No.a | no.b | no./No., % | |
| Total | 3649 | 332 | 9.1 | 3515 | 349 | 9.9 | 3210 | 351 | 10.9 | 2918 | 361 | 12.4 | 2797 | 365 | 13.0 |
| Sex | |||||||||||||||
| Male | 2684 | 204 | 7.6 | 2657 | 242 | 9.1 | 2437 | 221 | 9.1 | 2255 | 252 | 11.2 | 2166 | 248 | 11.4 |
| Female | 965 | 128 | 13.3 | 858 | 107 | 12.5 | 773 | 130 | 16.8 | 663 | 109 | 16.4 | 631 | 117 | 18.5 |
| Race/ethnicity | |||||||||||||||
| Black | 1775 | 170 | 9.6 | 1724 | 173 | 10.0 | 1540 | 183 | 11.9 | 1373 | 163 | 11.9 | 1265 | 161 | 12.7 |
| Hispanic | 1161 | 113 | 9.7 | 1117 | 117 | 10.5 | 1044 | 110 | 10.5 | 935 | 118 | 12.6 | 935 | 130 | 13.9 |
| White | 582 | 39 | 6.7 | 544 | 45 | 8.3 | 507 | 39 | 7.7 | 517 | 66 | 12.8 | 499 | 58 | 11.6 |
| Other/unknown | 131 | 10 | 7.6 | 130 | 14 | 10.8 | 119 | 19 | 16.0 | 93 | 14 | 15.1 | 98 | 16 | 16.3 |
| Age at diagnosis | |||||||||||||||
| 13–24 | 633 | 38 | 6.0 | 667 | 47 | 7.0 | 611 | 54 | 8.8 | 611 | 61 | 10.0 | 581 | 58 | 10.0 |
| 25–44 | 2013 | 165 | 8.2 | 1916 | 192 | 10.0 | 1748 | 189 | 10.8 | 1505 | 195 | 13.0 | 1499 | 195 | 13.0 |
| 45–64 | 912 | 117 | 12.8 | 872 | 105 | 12.0 | 779 | 98 | 12.6 | 741 | 92 | 12.4 | 661 | 104 | 15.7 |
| ≥65 | 91 | 12 | 13.2 | 60 | 5 | 8.3 | 72 | 10 | 13.9 | 61 | 13 | 21.3 | 56 | 8 | 14.3 |
| Transmission risk | |||||||||||||||
| MSM | 1532 | 99 | 6.5 | 1605 | 118 | 7.4 | 1468 | 111 | 7.6 | 1449 | 157 | 10.8 | 1477 | 157 | 10.6 |
| IDU | 223 | 25 | 11.2 | 180 | 18 | 10.0 | 134 | 17 | 12.7 | 105 | 10 | 9.5 | 95 | 16 | 16.8 |
| MSM-IDU | 69 | 1 | 1.4 | 62 | 6 | 9.7 | 44 | 2 | 4.5 | 57 | 9 | 15.8 | 51 | 5 | 9.8 |
| Heterosexual | 964 | 120 | 12.4 | 831 | 101 | 12.2 | 788 | 137 | 17.4 | 674 | 112 | 16.6 | 654 | 116 | 17.7 |
| Other/unknown | 861 | 87 | 10.1 | 837 | 106 | 12.7 | 776 | 84 | 10.8 | 633 | 73 | 11.5 | 520 | 71 | 13.7 |
| 2012 | 2013 | 2014 | 2015 | 2016 | |||||||||||
| No.a | no.b | no./No., % | No.a | no.b | no./No., % | No.a | no.b | no./No., % | No.a | no.b | no./No., % | No.a | no.b | no./No., % | |
| Total | 2556 | 413 | 16.2 | 2406 | 507 | 21.1 | 2333 | 636 | 27.3 | 2159 | 666 | 30.8 | 1977 | 739 | 37.4 |
| Sex | |||||||||||||||
| Male | 2012 | 294 | 14.6 | 1918 | 371 | 19.3 | 1868 | 495 | 26.5 | 1774 | 563 | 31.7 | 1566 | 579 | 37.0 |
| Female | 544 | 119 | 21.9 | 488 | 136 | 27.9 | 465 | 141 | 30.3 | 385 | 103 | 26.8 | 411 | 160 | 38.9 |
| Race/ethnicity | |||||||||||||||
| Black | 1126 | 198 | 17.6 | 986 | 191 | 19.4 | 1017 | 266 | 26.2 | 892 | 245 | 27.5 | 851 | 286 | 33.6 |
| Hispanic | 864 | 122 | 14.1 | 872 | 182 | 20.9 | 770 | 199 | 25.8 | 812 | 261 | 32.1 | 699 | 276 | 39.5 |
| White | 458 | 73 | 15.9 | 398 | 94 | 23.6 | 409 | 137 | 33.5 | 330 | 120 | 36.4 | 275 | 110 | 40.0 |
| Other/unknown | 108 | 20 | 18.5 | 150 | 40 | 26.7 | 137 | 34 | 24.8 | 125 | 40 | 32.0 | 152 | 67 | 44.1 |
| Age at diagnosis | |||||||||||||||
| 13–24 | 547 | 68 | 12.4 | 521 | 85 | 16.3 | 455 | 95 | 20.9 | 395 | 107 | 27.1 | 345 | 121 | 35.1 |
| 25–44 | 1358 | 228 | 16.8 | 1293 | 271 | 21.0 | 1279 | 355 | 27.8 | 1187 | 374 | 31.5 | 1125 | 419 | 37.2 |
| 45–64 | 597 | 107 | 17.9 | 530 | 134 | 25.3 | 532 | 164 | 30.8 | 517 | 163 | 31.5 | 471 | 178 | 37.8 |
| ≥65 | 54 | 10 | 18.5 | 62 | 17 | 27.4 | 67 | 22 | 32.8 | 60 | 22 | 36.7 | 36 | 21 | 58.3 |
| Transmission risk | |||||||||||||||
| MSM | 1410 | 202 | 14.3 | 1431 | 289 | 20.2 | 1407 | 395 | 28.1 | 1302 | 440 | 33.8 | 1150 | 451 | 39.2 |
| IDU | 72 | 12 | 16.7 | 51 | 8 | 15.7 | 47 | 9 | 19.1 | 43 | 13 | 30.2 | 27 | 8 | 29.6 |
| MSM-IDU | 48 | 5 | 10.4 | 42 | 2 | 4.8 | 37 | 7 | 18.9 | 32 | 5 | 15.6 | 26 | 5 | 19.2 |
| Heterosexual | 555 | 124 | 22.3 | 495 | 133 | 26.9 | 467 | 145 | 31.0 | 384 | 114 | 29.7 | 382 | 151 | 39.5 |
| Other/unknown | 471 | 70 | 14.9 | 387 | 75 | 19.4 | 375 | 80 | 21.3 | 398 | 94 | 23.6 | 392 | 124 | 31.6 |
Abbreviations: IDU, injection drug user; MSM, men who have sex with men.
aNo. represents the total number of HIV diagnoses.
bno. represents the number of HIV diagnoses ever achieving viral suppression (<200 copies/mL) within 3 months of diagnosis.
When comparing age groups, persons aged ≥65 years formed the smallest group and had the highest percentage of suppression (13.2% in 2007 and 58.3% in 2016). Other age groups had lower percentages, and the gaps between age groups and those aged ≥65 years narrowed from 2007 (6.0% among persons aged 13–24 years, 8.2% among 25–44 years, and 12.8% among 45–64 years) to 2016 (35.1%, 37.2%, and 37.8%, respectively).
The number of new diagnoses among the injection drug user (IDU) and men who have sex with men and inject drugs (MSM-IDU) risk groups decreased dramatically over the 2007–2016 period (88% and 62% decrease, respectively). The percentages achieving viral suppression within 3 months of diagnosis among IDUs and MSM-IDU remained low by 2016 (29.6% and 19.2%, respectively), while the MSM and heterosexual transmission risk groups had the highest suppression percentages (39.2% and 39.5%, respectively).
DISCUSSION
Currently, the NHAS has 1 process indicator but no outcome indicator for persons newly diagnosed with HIV. We propose an outcome indicator, the percentage of newly diagnosed persons achieving viral suppression within 3 months of diagnosis, to be included in the NHAS. Using HIV surveillance data, we reported the progress made in NYC. During the 10-year analysis period, we observed a dramatic improvement such that the percentage increased from 9% in 2007 to 37% in 2016. This increase reflects the improvement in timely linkage of newly diagnosed persons to care, the 2011 change in treatment recommendations to offer ART to any person living with HIV regardless of CD4 count, and the availability of more potent medications in recent years that result in quicker time to viral suppression [12]. Immediate initiation of ART after diagnosis, such as the RAPID and JumpstART programs, can be successfully and safely implemented and should be promoted.
Despite the overall improvement during this period, there were disparities by race/ethnicity. Compared to whites, blacks and Hispanics were equally likely or even more likely to achieve viral suppression within 3 months of diagnosis during 2007–2012, but less likely after 2012, except for 2016, when Hispanics and whites were equally likely. The higher proportion of blacks and Hispanics achieving viral suppression in earlier years could be explained by differences in ART prescription. During 2007–2011, the treatment guidelines recommended ART for persons with a CD4 count <500 cells/μL. Because more blacks and Hispanics than whites had a CD4 count <500 cells/μL at diagnosis, they were more likely to be prescribed ART after diagnosis and hence more likely to achieve viral suppression. In December 2011, NYC DOHMH released recommendations to offer ART to all persons living with diagnosed HIV, which could explain the subsequent sharp rise in the percentage of persons achieving viral suppression among whites. The lower percentage of newly diagnosed persons achieving viral suppression among blacks and Hispanics in recent years is likely the result of disparities at various stages of the HIV care continuum including lower rates of retention in care, prescription of ART, and ART adherence. To improve viral suppression among blacks and Hispanics, we need to address individual, clinical, and structural barriers to engagement in HIV care including barriers to ART adherence, and identify effective interventions with better understanding of their challenges, including lower level of trust in the provider/medical establishment, medical and social comorbidities, and suboptimal health literacy [13, 14].
Using HIV surveillance data to measure the new indicator has 2 limitations. First, the HIV registry does not have ART prescription information. Without ART information, we may not fully understand the mechanisms by which newly diagnosed persons were able or unable to achieve viral suppression within 3 months of diagnosis. However, viral suppression is the ultimate goal of HIV care [15], and HIV surveillance gives us the advantage of using population-based data to monitor the progress in achieving this goal. ART prescription data are important, but they could be obtained from claims databases or special surveys.
Second, the new indicator depends on the viral load testing patterns in the first 3 months of diagnosis, and the current method may produce an underestimate if the DHHS viral load monitoring guidelines are not followed. For example, a person who had a detectable viral load within 1 month of diagnosis, an undetectable viral load at 4 months, and no viral load tests in between would be counted as not achieving viral suppression within 3 months of diagnosis, although he might have achieved viral suppression before the 3-month mark. Despite this limitation, we would still advocate the current method, because (1) it is simple; (2) there is not a consensus in determining the timing of viral suppression between a detectable and an undetectable viral load; (3) the guidelines recommend viral load testing within 2–4 weeks after treatment initiation, and at 4- to 8-week intervals afterward until the level falls below the limit of detection, and we believe that the number of patients with a large time gap between viral load tests in the first few months is small and therefore the underestimation caused by the current method should be minimal; and (4) following the DHHS viral load monitoring guidelines can be seen as part of the evaluation for this new outcome indicator. In 2007, the proportion of patients with new diagnoses in NYC who had 0, 1, 2, and ≥3 viral load tests in the first 3 months of diagnosis was 34.7%, 33.6%, 22.2%, and 9.5%, respectively; in 2016, the proportion was 12.6%, 29.0%, 35.9%, and 22.5%, respectively.
Currently, the NHAS uses 1 process indicator, the percentage of newly diagnosed persons linked to HIV medical care within 1 month of diagnosis, to monitor HIV care among persons newly diagnosed with HIV. We propose an outcome indicator, the percentage of newly diagnosed persons achieving viral suppression within 3 months of diagnosis, and recommend that the Centers for Disease Control and Prevention and local health agencies use this new indicator along with the existing process indicator to monitor the progress in HIV care among persons newly diagnosed with HIV in the United States.
Notes
Acknowledgments. The authors thank Drs Kent Sepkowitz, Oni Blackstock, and James Hadler for their review and comments on an earlier version of the manuscript.
Financial support. This work was supported in part by the National Center for HIV/AIDS, Viral Hepatitis, STD, and TB Prevention, Centers for Disease Control and Prevention (cooperative agreement 5U62PS003993-04).
Potential conflicts of interest. Authors certify no potential conflicts of interest. All authors have submitted the ICMJE Form for Disclosure of Potential Conflicts of Interest. Conflicts that the editors consider relevant to the content of the manuscript have been disclosed.

