


Abstract
Identification of bacteria in human vaginal specimens is commonly performed using 16S ribosomal RNA (rRNA) gene sequences. However, studies utilize different 16S primer sets, sequence databases, and parameters for sample and database clustering. Our goal was to assess the ability of these methods to detect common species of vaginal bacteria.
We performed an in silico analysis of 16S rRNA gene primer sets, targeting different hypervariable regions. Using vaginal samples from women with bacterial vaginosis, we sequenced 16S genes using the V1–V3, V3–V4, and V4 primer sets. For analysis, we used an extended Greengenes database including 16S gene sequences from vaginal bacteria not already present. We compared results with those obtained using the SILVA 16S database. Using multiple database and sample clustering parameters, each primer set’s ability to detect common vaginal bacteria at the species level was determined. We also compared these methods to the use of DADA2 for denoising and clustering of sequence reads.
V4 sequence reads clustered at 99% identity and using the 99% clustered, extended Greengenes database provided optimal species-level identification of vaginal bacteria.
This study is a first step toward standardizing methods for 16S rRNA gene sequencing and bioinformatics analysis of vaginal microbiome data.
Over the past decade, cultivation-independent molecular methods using 16S ribosomal RNA (rRNA) gene primers have facilitated identification of bacterial species in the vaginal microbiota [1–3]. More recently, the use of high-throughput sequencing such as 454 sequencing and the Illumina MiSeq platform have generated large numbers of sequences (“reads”) from specimens [4, 5]. This has allowed characterization of the vaginal microbiota in healthy, reproductive-aged women [3], pregnant women [6], human immunodeficiency virus–infected women [7], and women with bacterial vaginosis (BV) [8]. It has also facilitated comparison of the genital microbiota between sexual partners [9–11]. Molecular methods are particularly advantageous because of their ability to detect fastidious bacteria that have not been isolated by culture [12].
Despite these advances, there remains a critical need to understand the impact that methods for 16S rRNA gene sequencing and bioinformatics analysis have on study results [13, 14]. This was a topic of emphasis at the BV Expert Consultation Meeting [14]. For example, it is currently not clear which 16S rRNA gene primer sets provide the best discriminatory power for species-level resolution of the vaginal microbiota. Previous vaginal microbiome studies have sequenced various regions of the 16S rRNA gene, including the V1–V2 [3, 15], V1–V3 [16–20], V3–V4 [21–23], V4 [8, 24, 25], and V4–V6 [9, 26] hypervariable regions. Using these methods to obtain species-level resolution of the vaginal microbiota is important. For example, some Lactobacillus species contribute to optimal vaginal health (ie, Lactobacillus crispatus) while others (ie, Lactobacillus iners) are present in women with normal vaginal flora and with BV [27].
Neither the data generation platforms nor the analytic methods used in vaginal microbiome research have reached the level of refinement necessary for translational applications or systemic meta-analyses [13]. One factor that may influence resolution of the analysis is the choice of the curated database of 16S sequences used for taxon identification; Greengenes [28] and SILVA [29] are examples of 16S rRNA gene databases used for analysis. Greengenes has been frequently used with QIIME (Quantitative Insights Into Microbial Ecology), an open-source pipeline for microbiome analysis [30]. Greengenes is available in 3 different versions where the curated 16S sequences are clustered at 100%, 99%, or 97% sequence identity. While many studies use the 97% clustered database as the default, there is no systematic assessment of the optimal clustering cutoff for species-level identification of vaginal bacteria. Clustering of sample reads obtained from sequencing of 16S rRNA genes based on sequence identity is also commonly performed prior to assignment of each cluster to a specific operational taxonomic unit (OTU) [30].
Understanding the comparability of research methods for 16S rRNA gene sequencing and analysis is an important step in advancing the field of vaginal microbiome research. Our primary objective was to perform an in silico analysis and experimental evaluation of 16S rRNA gene primer sets, targeting different hypervariable regions of the 16S gene, to determine which provides the best species-level resolution of the vaginal microbiota. Secondary objectives were to optimize computational parameters to maximize resolution of the analytical pipeline used for detection of vaginal bacterial species; extend and optimize the Greengenes database to better support detection of vaginal bacteria; and explore the use of more recent methods (ie, DADA2) for denoising and clustering of sequence reads, as well as use of an alternative 16S database, SILVA.
METHODS
In Silico Analysis
Simulated amplicons were derived from a set of 283 known vaginal microorganisms’ 16S sequences (Supplementary Table 1) [8, 11] using the pcr_match software from the Primer Match tool suite (https://edwardslab.bmcb.georgetown.edu/software/PrimerMatch.html). We used 3 universal primer sets representing the V1–V3, V3–V4, and V4 hypervariable regions, and 2 primer sets from previous vaginal microbiome studies [17, 23] for the V1–V3 and V3–V4 hypervariable regions, allowing for 2 mismatches (not including ambiguous bases) to generate amplicons (Table 1). These primers are most commonly used in vaginal microbiome studies [8, 16–25]. We tested this method allowing 0–4 mismatches for each primer set and determined 2 mismatches to be optimal for detection of the maximal number of site-specific amplicons (Supplementary Table 2). We performed in silico analysis to examine the ability of each primer set to detect known vaginal bacteria. We assigned the simulated amplicons generated by pcr_match to OTUs. We then classified the resulting OTUs using the ribosomal database project (RDP) classifier [31] included in the QIIME package by comparing reads against an extended version of the Greengenes database containing additional 16S sequences from vaginal bacteria missing in Greengenes version gg_13_5 (Supplementary Table 3).
Experimental Evaluation of 16S rRNA Gene Primer Sets
Stored vaginal specimens from 10 women participating in a prospective vaginal microbiome study [24] were used for experimental evaluation of 16S rRNA gene primer sets. Eight of the specimens were collected from women with BV (Nugent score 7–10); 2 were collected from women with normal vaginal flora (Nugent score 0–3). The specimens were sent to the Research and Testing Laboratory (RTL) in Lubbock, Texas (http://www.rtlgenomics.com/) for sequencing. These specimens were sequenced on the Illumina MiSeq platform for the 16S rRNA hypervariable regions V1–V3 (300-bp paired end reads, generating a 550-bp amplicon following merging of forward and reverse reads), V3–V4 (250-bp paired end reads, generating a 465-bp amplicon following merging of reads), and V4 (250-bp paired end reads, generating a 250-bp amplicon following merging of reads) (Table 1). To provide a limited assessment of variability that can occur across sequencing facilities, the V4 region was also sequenced at the University of Alabama at Birmingham (UAB) Heflin Center for Genomic Science using the Illumina MiSeq platform, generating 250-bp reads using the same V4 primer sets. The resulting sequences were analyzed using the QWRAP pipeline [5], a pipeline designed to automate the basic QIIME analysis of microbiome data.
16S Ribosomal RNA Gene Primers
| Region | Source | Primer Set Designation | Sequence |
|---|---|---|---|
| V1–V3 | Commonly used universal | 28F [33] 519R [34] | 5ʹ-GAGTTTGATCNTGGCTCAG-3ʹ 5ʹ-GTNTCACNGCGGCKKGCTG-3ʹ |
| Vaginal microbiome study | Fwd-P1 Fwd-P2 Rev1B [17] | 5ʹ-GTTYGATYMTGGCTYAG-3ʹ5ʹ-RTTTGATCYTGGTTCAG-3ʹ 5ʹ-ATTACCGCGGCTGCTGG-3ʹ | |
| V3–V4 | Commonly used universal | 357wF [35] 785R [35] | 5ʹ-CCTACGGGNGGCWGCAG-3ʹ 5ʹ-GACTACHVGGGTWTCTAAT-3ʹ |
| Vaginal microbiome study | 319F 806R [23] | 5ʹ- CTCCTACGGGAGGCAGCAGT-3ʹ 5ʹ- GGACTACNVGGGTWTCTAAT-3ʹ | |
| V4 | Commonly used universal | 515F [36] 806R [36] | 5ʹ-GTGCCAGCMGCCGCGGTAA-3ʹ 5ʹ-GGACTACHVGGGTWTCTAAT-3ʹ |
Bioinformatics Analysis
For analysis using the QWRAP pipeline, read quality from DNA extracted from the vaginal specimens was examined. Any reads with an average Phred score <20 were filtered out. Forward and reverse reads were merged into a single file that was trimmed to remove low-quality ends [5]. To determine the optimal parameters for analysis of the vaginal microbiome, the filtered sample reads were analyzed using 3 different versions of the extended Greengenes database with sequences clustered at 97%, 99%, or 100% sequence identity. Similarly, for each sample, the reads were clustered based on sequence identity at 97%, 99%, or 100%. Sequences with a sequence identity at or above the threshold were clustered into a single OTU whereas sequences below the threshold were grouped into unique OTUs. Taxonomic assignments of OTUs were made using the RDP classifier [31]. Further analyses of OTUs were performed as previously described [5].
DADA2 Analysis
To examine the effects of moving from an OTU-based method such as QIIME to a non-OTU-based method, patient sequences were clustered using DADA2 (version 1.2.0) [32]. DADA2 is an open-source pipeline that filters out sequences of low abundance that might arise due to polymerase chain reaction (PCR) or sequencing errors and assigns taxonomies to the remaining reads. This method allows for distinct reads with as few as 1 nucleotide difference to be clustered into separate nodes that might otherwise be clustered into a single OTU using an OTU-based approach [32]. The UAB sequenced samples were filtered using DADA2’s fastqPairedFilter function to truncate reads whenever a base with a quality score of ≤2 was observed. Bimeras were removed via removeBimeraDenovo. Taxonomic assignments were made using the RDP classifier. We repeated this analysis using the SILVA (release 132) database for comparison [29].
This study was approved by the UAB Institutional Review Board (protocol number F131127001). All sequence reads generated for and described have been deposited in the National Center for Biotechnology Information Sequence Read Archive under BioProject PRJNA392434.
RESULTS
In Silico Analysis
To determine the ability of different PCR primer sets to detect vaginal microbiota species using an in silico evaluation, we used pcr_match software from the Primer Match tool suite to generate simulated amplicons from 283 known vaginal microbiota sequences (Supplementary Table 1) and several 16S rRNA gene primer sets (Table 1). Primers chosen amplified the V1–V3, V3–V4, or V4 hypervariable regions of the 16S rRNA gene. We compared universal primer sets commonly used to amplify these regions [33–36] to alternate primer sets specifically designed for vaginal microbiome studies [17, 23]. Using universal primers, the V1–V3 primers generated amplicons from 22 of these sequences, the V3–V4 primers generated 233 amplicons, and the V4 primer generated 274 amplicons (Figure 1). For each of the primer sets, the resulting amplicons were assigned a taxonomy from the extended Greengenes database using the RDP classifier [31]. All 22 (100%) of the V1–V3 amplicons, 230 (98.7%) of the V3–V4 amplicons, and 268 (97.8%) of the V4 amplicons were assigned a species-level identification (Figure 1). Using V1–V3 and V3–V4 vaginal-specific primer sets (Table 1), we observed an increase in the V1–V3 primers’ ability to generate a species-level identification (22 to 110), but a slight decrease in the V3–V4 primers’ ability to generate a species-level identification (230 to 198) (Figure 1). After comparing the results of the universal primers to the vaginal specific primers, we focused on the universal primers for further analysis.
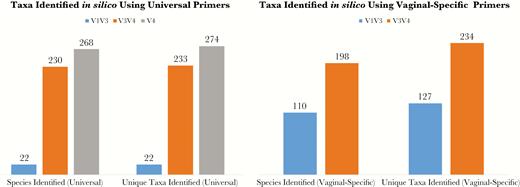
Identification of species and unique taxa for simulated amplicons in silico. Simulated amplicons were generated using pcr_match using both universal primer sets (left panel) and primer sets taken from previous vaginal microbiome studies (right panel). The simulated amplicons were assigned a taxonomy using QIIME’s built-in ribosomal database project classifier. The number of species-level operational taxonomic units (species identified) and the total number of unique taxa present (unique taxa identified) for each primer set are indicated.
Ability of the Extended Greengenes Database to Detect BV-Associated Bacteria
To identify vaginal bacterial species of interest that were not represented in Greengenes, 2 databases of 16S sequences from microorganisms known to be present in the human vaginal microbiome [8, 11] were compared against the most recently available version of the Greengenes database (gg_13_5), clustered at 100% using BLASTn (Nucleotide Basic Local Alignment Search Tool). A total of 207 full-length 16S sequences that did not share a 100% match with any 16S sequence already present in Greengenes were added to the database (Supplementary Table 3). Notably, several common BV-associated bacteria (BVAB) with high specificity for BV [37], including Gardnerella vaginalis, BVAB1, BVAB2, Mageeibacillus indolicus (BVAB3), Sneathia amnii, Prevotella bivia, and Atopobium vaginae, were not represented in Greengenes.
We assigned the simulated amplicons generated by pcr_match to OTUs and then classified the resulting OTUs using the RDP classifier. The extended Greengenes database was able to detect a greater number of common BVAB compared to the default database (Table 2). The unmodified 97% clustered Greengenes database was only able to detect 3 of the common BV-associated bacteria, and all 3 of the taxonomy-identified OTUs were listed in the database as unnamed species. In contrast, the expanded Greengenes database, using the same 97% clustering parameters for both sequence and database clustering, was able to detect all of the named species for these common BVAB. The expanded Greengenes database was also able to detect several major lactobacilli in the vaginal microbiota [27], including L. crispatus, L. gasseri, L. jensenii, and L. vaginalis at 97% database and 97% sample clustering. These species were not detected using the default Greengenes database (Table 3). Lactobacillus coleohominis and L. iners were detected irrespective of database used or clustering parameters, whereas detection of Lactobacillus helveticus and Lactobacillus reuteri was variable depending on clustering parameters.
Detection of Common Bacterial Vaginosis–Associated Bacteria Using Different Combinations of Sample Sequence Similarity and Greengenes Database Clustering Parameters
| BVAB | Extended Greengenes Database Clustering | Default Greengenes Databasec | ||||||||
|---|---|---|---|---|---|---|---|---|---|---|
| 100%a | 99% | 97% | ||||||||
| Sample Clustering | ||||||||||
| 100%b | 99% | 97% | 100%b | 99% | 97% | 100%b | 99% | 97% | ||
| Bacteria Detected?d | ||||||||||
| Atopobium, unnamed species | – | – | – | – | – | – | – | – | + | + |
| Atopobium vaginae | + | + | + | + | + | + | + | + | + | – |
| BVAB1 | – | – | – | + | + | + | + | + | + | – |
| BVAB2 | + | + | + | + | + | + | + | + | + | – |
| BVAB3 (Mageeibacillus indolicus) | + | + | + | + | + | + | + | + | + | – |
| Gardnerella, unnamed species | + | + | + | – | – | – | – | – | – | + |
| Gardnerella vaginalis | – | – | – | + | + | + | + | + | + | – |
| Megasphaera type 1 | + | + | + | + | + | + | + | + | + | – |
| Sneathia, unnamed species | + | + | – | + | + | – | + | + | – | + |
| Sneathia amnii | + | + | + | + | + | + | + | + | + | – |
Abbreviation: BVAB, bacterial vaginosis–associated bacteria.
a100% database clustering indicates that the Greengenes database was clustered based on 100% sequence identity.
b100% sample clustering indicates that sample sequence reads were clustered based on 100% sequence identity.
c97% sample clustering and 97% database clustering.
d”+” indicates the bacterium was detected; “–” indicates the bacterium was not detected.
Detection of Common Vaginal Lactobacillus Species Using Different Sample/Greengenes Database Clustering Combinations
| Lactobacillus Species | Extended Greengenes Database Clustering | Default Greengenes Databasec | ||||||||
|---|---|---|---|---|---|---|---|---|---|---|
| 100%a | 99% | 97% | ||||||||
| Sample Clustering | ||||||||||
| 100%b | 99% | 97% | 100%b | 99% | 97% | 100%b | 99% | 97% | ||
| Bacteria Detected?d | ||||||||||
| Unnamed species | – | + | – | – | – | – | – | – | – | + |
| L. coleohominis | + | + | + | + | + | + | + | + | + | + |
| L. crispatus | + | + | – | + | + | + | + | + | + | – |
| L. gasseri | – | + | + | – | + | + | – | + | + | – |
| L. helveticus | + | – | – | – | – | – | – | – | – | – |
| L. iners | + | + | + | + | + | + | + | + | + | + |
| L. jensenii | – | – | – | + | + | + | + | + | + | – |
| L. reuteri | + | + | + | + | + | + | – | – | – | + |
| L. vaginalis | – | – | – | – | – | – | + | + | + | – |
a100% database clustering indicates that the Greengenes database was clustered based on 100% sequence identity.
b100% sample clustering indicates that sample sequence reads were clustered based on 100% sequence identity.
c97% sample clustering and 97% database clustering.
d”+” indicates the bacterium was detected; “–” indicates the bacterium was not detected.
Sequencing of Vaginal Specimens
The 10 vaginal specimens were sequenced at the RTL using all 3 universal primer sets. The V1–V3 region produced an average of 38680 reads per sample, the V3–V4 region produced an average of 59558 reads per sample, and the V4 region produced an average of 38048 reads per sample. Concomitant sequencing of the V4 region at UAB produced an average of 49119 reads per sample. This was slightly higher than the average number of reads per sample when the V4 region was sequenced at the RTL, demonstrating site-to-site variability. The samples were then analyzed using QIIME [30] and the QWRAP analysis pipeline [5] to determine the total number of unique taxa and number of unique species present in each sample (Figure 2A). The V4 primers consistently detected greater numbers of unique taxa and species than did the V1–V3 or V3–V4 primers. This was despite the fact that, for the RTL samples, the V4 primer produced the fewest number of total reads. However, the increased number of reads from the UAB-sequenced samples supported identification of a greater number of vaginal bacterial species than for the RTL samples (Figure 2A).
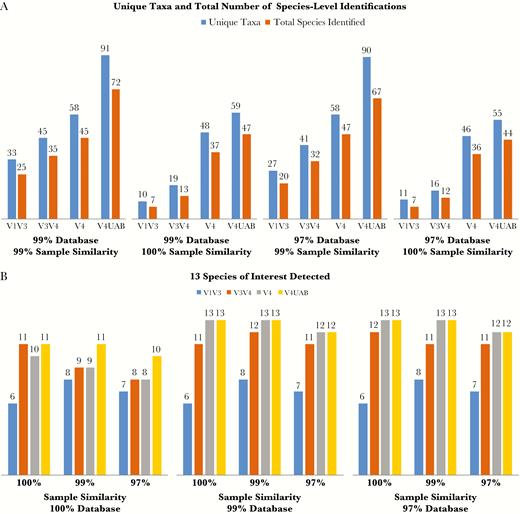
A, Identification of vaginal-associated species in patient samples. Ten samples were sequenced at the Research and Testing Laboratory in Lubbock, Texas, using 3 different universal primer sets (V1–V3; V3–V4; V4). The samples were also sequenced at the University of Alabama at Birmingham (UAB) using the same V4 primers (V4 UAB). The resulting operational taxonomic unit tables were compared for the number of unique taxonomic identifications assigned, represented in blue, and the number of identifications that could be resolved to the species level, represented in orange. Samples were analyzed using multiple database and sample read clustering parameters. B, Number of benchmark vaginal species detected from among the following: Atopobium vaginae, bacterial vaginosis–associated bacteria (BVAB) 1, BVAB3, Gardnerella vaginalis, Lactobacillus crispatus, Lactobacillus iners, Megasphaera type 1, Megasphaera type 2, Prevotella amnii, Prevotella melaninogenica, Prevotella timonensis, Sneathia amnii, and an unnamed Sneathia species. The ability to detect these species was compared for all combinations of sample and database clustering for all 4 sequencing runs.
Evaluation of Database and Sample Clustering Parameters
Traditionally, microbiome analysis programs are configured to use variable levels of sequence clustering, where sequence reads are clustered into OTUs based on a prespecified level of sequence identity. For example, 2 sequences that share 98% sequence identity would be included in the same OTU if using a 97% cutoff was used, but would be separated into 2 distinct OTUs if either a 99% or 100% cutoff was used. This same procedure is used to cluster the sequences present in the 16S sequence database. To examine the effect that use of different clustering parameters had on detection of taxa, the number of unique taxa and number of total species identified was determined for each specimen using the extended Greengenes database clustered at either 99% or 97% identity, and sample reads clustered at either 100% or 99% sequence identity (Figure 2A). (Results for 97% sample clustering and 100% database clustering are not shown due to their inability to detect all vaginal species of interest). Database clustering at either 99% or 97% along with 99% sample clustering provided optimal detection of unique taxa and species.
To further evaluate optimal clustering conditions for both the extended Greengenes database and sample sequence reads, 13 vaginal bacteria of interest (ie, common BVAB and vaginal lactobacilli) [37] were selected. These consisted of A. vaginae, BVAB1, M. indolicus (BVAB3), G. vaginalis, L. crispatus, L. iners, Megasphaera type 1, Megasphaera type 2, Prevotella amnii, Prevotella melaninogenica, Prevotella timonensis, S. amnii, and an unnamed Sneathia species (Figure 2B). With the exception of the 100% database clustering, these specific microorganisms comprised approximately 90% of the total organisms in the majority of the samples, regardless of the clustering methods used. While other vaginal bacteria, including BVAB2, were detected, they did not comprise a significant percentage of the reads. Examining all combinations of database clustering, only the 99% or 97% clustered database was able to identify all 13 vaginal bacterial species of interest. As expected with the 99% or 97% clustered database, only the 100% and 99% sample clustering analyses were able to identify all 13 species, but only when the V4 region primers were used. Due to the higher number of reads, the ability to detect higher numbers of unique taxa and species, and the ability to detect all 13 vaginal bacteria of interest, we used the UAB V4 sequence reads in all subsequent analyses.
To examine the relative abundance of vaginal bacterial species present, we generated bar charts displaying the taxonomic distribution of these taxa in each sample (Figure 3). As expected, using 100% database clustering greatly diminished the number of unique taxa identified. The 99% database/99% sample combination yielded the greatest number of unique taxa while the 97% database/99% sample combination was more capable of identifying Sneathia to the species level.
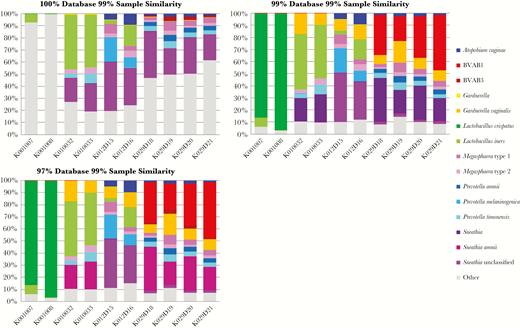
Comparison of taxonomic identification using different database clustering parameters for 15 taxon-identified operational taxonomic units (OTUs) representing 90% of the total observed taxa for most of the vaginal samples. The numbers for each taxon within each sample represent the percentage of the total number of reads of all OTUs combined for that sample. Samples K001007 and K001008 are from women with normal vaginal flora (Nugent score 0–3). All other samples are from patients with BV (Nugent score 7–10). Abbreviation: BVAB, bacterial vaginosis–associated bacteria.
Comparison of QIIME-Based Sample Clustering to DADA2
To compare a non-OTU-based method of sample clustering (DADA2) [32] to OTU-based clustering using QIIME [30], UAB V4 sequence reads were analyzed with DADA2 using default parameters. Taxonomy was assigned to the DADA2 output using both the 99% and 97% clustered, extended Greengenes database. For both versions of the database, the results using DADA2 were highly similar to the results from the use of QIIME 99% when comparing equivalent database clustering parameters (Figure 4). The concordance of these results demonstrates that by optimizing sample clustering parameters for the QIIME-based pipeline, results equivalent to using DADA2 can be obtained.
Comparison of the Extended Greengenes Database to SILVA
We compared results using the extended Greengenes database to the SILVA database. Supplementary Figure 1 displays the bar plots of taxon relative abundance calculated in the same manner as Figure 4, except that the SILVA database was now used for taxonomic assignment. No significant differences were observed between Greengenes and SILVA, other than an inability to distinguish between Megasphaera type 1 and Megasphaera type 2 and differences in the ability to resolve Sneathia at the genus and species level using SILVA.
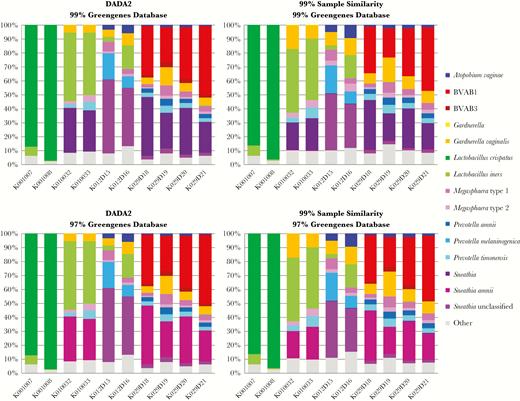
Comparison of DADA2 vs operational taxonomic unit (OTU) clustering on species identification. Using the same 15 taxa analyzed for Figure 3, the samples were processed using DADA2 (left 2 panels) at 2 different levels of database clustering using the extended Greengenes database. These results are compared with the results from QIIME-based sample clustering (right 2 panels). The numbers for each taxon within each sample represent the percentage of the total number of reads of all OTUs combined for that sample. Samples K001007 and K001008 are from women with normal vaginal flora (Nugent score 0–3). All other samples are from patients with bacterial vaginosis (Nugent score 7–10). Abbreviation: BVAB, bacterial vaginosis–associated bacteria.
To more specifically highlight differences between the detection of genera and species using different clustering methods and databases, we tracked changes in the taxon identified between each condition (Supplementary Table 4). We observed differences in the naming of some taxa between the extended Greengenes database and SILVA (ie, BVAB3 in the extended Greengenes database and Fastidiosipila unnamed in SILVA). We also noted that OTUs identified as P. timonensis using Greengenes were misidentified as Prevotella Chlamydia trachomatis in SILVA.
DISCUSSION
The study of microbial communities is a rapidly evolving field. As bacteria are identified, it is important to update taxonomic analysis tools to avoid missing microorganisms. While a great deal of attention is given to the selection of primer sets and which hypervariable regions are sequenced, it is equally important to consider the comprehensiveness of the database being used to assign a taxonomy. As shown by this study, we would not have been able to identify G. vaginalis, BVAB1, BVAB2, BVAB3 (M. indolicus), S. amnii, P. bivia, or A. vaginae without the extended Greengenes database in comparison to the default Greengenes database. Use of the more recently updated SILVA database correctly identified some of these taxa at the species level, but not all.
For all vaginal specimens examined, coupling the universal V4 primer set with 99% database/99% sample clustering was the most effective method for maximizing the number of taxa identified and provided species-level resolution for most OTUs. However, shifting from 99% to 100% database clustering resulted in a substantial reduction in species-level identification. This change resulted in sequence reads being matched to 16S rRNA sequences in the database multiple times for closely related species, thus providing no ability for the RDP classifier to identify the correct match. Thus, sequences could only be matched at the genus level, represented in Figure 3 by the extensive matches to “other” taxa. Similarly, 99% was the optimal cutoff for sample clustering, as the 97% cutoff failed to detect all 13 species of interest (Figure 2B). Using the optimum 99% database/99% sample clustering parameters with the extended Greengenes database, we were able to identify all common lactobacilli and BVAB of interest to the species level in the vaginal specimens sequenced.
Notably, very few species were able to be identified using the V1–V3 region with universal primers in this study. This is in contrast to a prior study that used a V1–V3 database curated for the vaginal microbiota [16]. This curated database was able to classify >95% of sequence reads to the species level using a 97% clustering threshold. It is possible that if our V1–V3 reads were mapped against this curated database instead of the Greengenes database, better classification of vaginal bacteria to the species level would be obtained.
This study has several limitations. First, as DNA from the vaginal specimens was extracted and sequenced at both the RTL and UAB, we cannot differentiate whether differences seen in the V4 sequencing results between sites were due to the DNA extraction method or to the sequencing method. Second, there is now an updated version of the Greengenes database (gg_13_8) with additional taxonomic classifications. However, this version does not provide 100% or 99% database clustering, so we were not able to perform the analyses reported here with this version. Furthermore, gg_13_8 does not contain all of the sequences associated with the vaginal microbiome that we added to our extended database. Additionally, in some circumstances, 16S sequencing may not be sufficient to discriminate between species of the same genus. However, this was rarely noted for common BV-associated bacteria in this study. Finally, we used clinical specimens for our analysis. As a result, the true composition of the communities in the vaginal specimens is not known. We chose this strategy over use of mock community specimens, because we felt that obtaining robust and reproducible results from vaginal specimens that contain the full complement of patient-derived material would more accurately reflect future research efforts.
Despite these limitations, our findings illustrate a number of factors that play a role in the analysis of vaginal microbiome data. An important next step would be to compare taxa and relative abundance of vaginal microorganisms across multiple research laboratories from a standardized set of specimens and mock communities.
In conclusion, the completeness of the database used for vaginal microbiome analysis remains a critical factor for accurate identification of the microorganisms in a community, as is the choice of PCR primer sets. In addition, the choice of database and sample sequence clustering parameters also impact results. Prior studies have used different primer sets to amplify the 16S rRNA gene, sequenced different regions of the 16S rRNA gene, and used different approaches to analyze sequence data. These results are a first step in standardizing methods for sequencing and analysis of vaginal microbiome data. This is especially important for future studies investigating the vaginal microbiome as it relates to the pathogenesis of BV and other vaginal infections such as trichomoniasis, as both have adverse health outcomes for women [38–42].
Supplementary Data
Supplementary materials are available at The Journal of Infectious Diseases online. Consisting of data provided by the authors to benefit the reader, the posted materials are not copyedited and are the sole responsibility of the authors, so questions or comments should be addressed to the corresponding author.
Notes
Acknowledgments. The authors thank the Research and Testing Laboratory in Lubbock, Texas, for their assistance in sequencing the vaginal specimens used in this study. This study was supported by the UAB Center for Clinical and Translational Science (grant number UL1TR001417 from the National Center for Advancing Translational Sciences to the University of Alabama at Birmingham Center for Clinical and Translational Science) and by the National Institute of Allergy and Infectious Diseases (grant number K23AI106957 to C. A. M.).
Potential conflicts of interest. D. H. M. is on the advisory boards of BioFire Diagnostics, Inc, and GlaxoSmithKline. C. A. M. has been a consultant for Lupin Pharmaceuticals. All other authors report no potential conflicts of interest. All authors have submitted the ICMJE Form for Disclosure of Potential Conflicts of Interest. Conflicts that the editors consider relevant to the content of the manuscript have been disclosed.
References
Author notes
BusPatrol America, Salt Lake City, Utah

