


Abstract
Differences in T-cell phenotype, particularly the expression of markers of T-cell homeostasis, have been observed in fatal and nonfatal Ebola virus disease (EVD). However, the relationship between these markers with T-cell function and virus clearance during EVD is poorly understood. To gain biological insight into the role of T cells during EVD, combined transcriptomics and T-cell receptor sequencing was used to profile blood samples from fatal and nonfatal EVD patients from the recent West African EVD epidemic. Fatal EVD was characterized by strong T-cell activation and increased abundance of T-cell inhibitory molecules. However, the early T-cell response was oligoclonal and did not result in viral clearance. In contrast, survivors mounted highly diverse T-cell responses, maintained low levels of T-cell inhibitors, and cleared Ebola virus. Our findings highlight the importance of T-cell immunity in surviving EVD and strengthen the foundation for further research on targeting of the dendritic cell-T cell interface for postexposure immunotherapy.
Ebola virus disease (EVD) is a severe viral syndrome caused by infection with filoviruses of the genus Ebolavirus. Since late 2013, Ebola virus (species Zaire ebolavirus [EBOV]) has caused 3 outbreaks in West and Central Africa, the former being responsible for more than 28000 cases and 11000 human deaths [1, 2].
The pathophysiology of EVD is complex and involves virus dissemination to multiple organs, high levels of proinflammatory cytokines, and profound dysregulation of the host immune response. Recent studies, particularly during the West African epidemic, suggested that T-cell immunity is an important component of the host immune response during acute EVD. In survivors, activated T cells are found early during infection, and this activation is sustained even after virus clearance [3]. Long-lasting memory T cells have been also found in survivors of filovirus infection years after recovery [4]. This indicates that survivors mount effector responses that contract, thereafter leading to formation of memory T-cell clones. In contrast, fatal EVD has been associated with a number of factors: (1) the lack of formation of virus-specific T cells; and (2) the sustained upregulation of T-cell inhibitory molecules such as programmed cell death 1 (PD-1) and cytotoxic T lymphocyte-associated protein 4 (CTLA-4) in both conventional and γδ-T cells [5–7]. To date, however, neither the molecular events leading to defects in T-cell homeostasis nor the consequences of these defects on T-cell immunity are well understood.
The importance of T cells for recovery from EVD could be related to the fact that most humans exposed to EBOV are immunologically naive, namely, they do not have pre-existing antibody immunity against the virus [8, 9]. In this scenario, it is also important to consider the involvement of antigen-presenting cells (APCs), particularly dendritic cells (DCs). Dendritic cells play an important role bridging innate and adaptive immune responses because they are the only APCs capable of activating epitope-specific T cells from the naive pool. As chief sensors of invading pathogens in both peripheral and lymphoid tissues, DCs need to recognize the intruder via pathogen- recognition receptors, migrate to the secondary lymphoid organs, and encounter and prime cognate T cells [10].
In this study, leftover diagnostic samples from the EVD epidemic in Guinea were used to perform a focused transcriptomics-based analysis of gene expression signatures that would discriminate between fatal and nonfatal human EVD. The findings indicate that despite strong T-cell activation, fatal EVD was associated with low T-cell receptor (TCR) diversity and lack of control of virus replication. In contrast, survival was characterized by high clonal diversity, low levels of T-cell checkpoint inhibitors, and virus clearance. These observations underscore the importance of T-cell immunity for EVD survival and warrant further investigations on T cell-targeted postexposure medical countermeasures.
METHODS
Ethics Statement
Samples from acute (polymerase chain reaction [PCR] positive) EVD patients included in this study were collected at the European Mobile laboratory diagnostics unit attached to the Ebola Treatment Center in Coyah. All patients were under the care of medical teams deployed by the Cuban government. Patients with malaria coinfection were excluded from the study. The National Committee of Ethics in Medical Research of Guinea as well as the Ethics Committee of the Medical Association of Hamburg approved the use of diagnostic leftover samples and corresponding patient data for this study (permit nos. 11/CNERS/14 and PV4910). Because the samples had been collected as part of the public health response to contain the outbreak in Guinea, informed consent was not obtained from patients.
Patients and Samples
All samples were obtained from EVD patients that were diagnosed at 2 Ebola Treatment Centers in Guinea (Guéckédou or Coyah). Diagnosis for EBOV was done on blood samples in ethylenediaminetetraacetic acid (EDTA) tubes using the RealStar Zaire Ebolavirus RT-PCR Kit 1.0 (Altona Diagnostics) by the European Mobile Laboratory. A fraction of leftover diagnosis whole blood was frozen and shipped to the biosafety level 4 laboratory in Hamburg. Ribonucleic acid (RNA) and genomic deoxyribonucleic acid (DNA) were isolated from whole blood samples of the patients using TRIzol Reagent and according to the manufacturer’s instructions. Deoxyribonucleic acid samples were subsequently used for TCR sequencing. Ribonucleic acid samples were used for NanoString analysis. The description of patients and samples included in each of the figures of this study is presented in Supplementary Table 1.
T-Cell Receptor Amplification
T-cell receptor sequences were obtained by amplifying the TCR β complementarity-determining region 3 (CDR3) loci from samples of genomic DNA. The TCR library was generated via Multiplex PCR using 45 forward primers each specific to a functional TCR Vβ segment and 13 reverse primers each specific to a TCR Jβ segment. Forward and reverse primers were pooled separately to a final stock of 10 μM each. Multiplex PCR amplification was performed in a first step with the use of a 1:5 mix of primers without and with overhang adapters, which were the specific target of primers in a second PCR amplification. The QIAGEN multiplex PCR kit was used in a final volume of 25 μL including 1 μL of DNA template and 2.5 μL of Q solution. The PCR cycle was initiated by a 15-minute step of activation of the HotStartTaq DNA Polymerase at 95°C. Next, denaturation at 94°C for 30 seconds was followed by annealing for 90 seconds at 69°C, with touchdown PCR of 1°C reduction of the temperature for the first 10 cycles. After extension at 72°C for 90 seconds, 40 cycles (10 cycles for touchdown + 30 cycles) of denaturation, annealing, and extension followed. A final extension at 72°C was performed for 10 minutes. A second PCR step was performed to include Nextera XT dual indices as well as Illumina sequencing adapters. The QIAGEN multiplex PCR was used once again in a final volume of 25 μL including 5 μL of DNA template and 2.5 μL of each primer. The PCR cycle was initiated with an activation step of 15 minutes at 95°C followed by 15 cycles of denaturation for 30 seconds at 95°C, annealing for 30 seconds at 55°C, and extension for 30 seconds at 72°C. A final extension at 72°C was performed for 5 minutes. The PCR products were purified after each PCR run with the use of Agencourt AMPure XP reagent and following the manufacturer’s instructions. The PCR products were mixed with 1.8× volume of beads for the recovery of amplicons of approximately 200 base pairs (bp).
Library Preparation and Sequencing
Each sample was quantified using Qubit, and the size distribution was assessed using the Agilent Bioanalyzer 2100 with the DNA 1000 kit. Samples were pooled in equal amounts to obtain the final library. For sequencing of the TCR amplicons the Illumina MiSeq chemistry V3 was used, and a paired end 300-cycle run was performed following the manufacturer’s instructions. The pooled and denatured library was diluted to a final concentration of 12 pM, and a PhiX control of 5% spike-in was used.
Bioinformatical Analysis of Sequencing Results
First, sequence read quality was determined using PRINSEQ-lite and PRINSEQ-graphs (version 0.20.4) or FastQC (version 0.11.5). Next, paired sequence reads were interleaved and filtered for quality with seq_crumbs (https://bioinf.comav.upv.es/seq_crumbs/). Read pairs with a minimum quality score of 25 were merged over their overlapping sequences to obtain complete sequences using FLASH (version 1.2.9). MiXCR (version 1.8.1) was used to align the obtained sequences to reference V, D, and J genes of TCRs to identify the genes present in the samples. Then, identical CDR3 sequences were identified and grouped in clonotypes. All of this information was finally exported into a tab-delimited and understandable text file. Afterwards, the R package tcR was used for advanced data analysis on the files obtained from MiXCR.
Statistical Analysis
Associations between TCR diversity and outcome, threshold cycle (Ct) value, and others were determined using Mann-Whitney test. The levels of significance are interpreted as follows: not significant P > .05, *P ≤ .05, **P ≤ .01, ***P ≤ .001, and ****P ≤ .0001. Association between TCR diversity or hyperexpansion, defined as percentage of hyperexpanded clones, and days postexposure were determined by linear regression, and deviation from zero was considered as significant if P > .05. tcR diversity was estimated using the inverse simpson index as an indicator of diversity. tcR package was applied to describe the TCR clonal space by calculation of the percentage of rare (0 < X ≤ 1e-05), small (1e-05 < X ≤ 1e-04), medium (1e-04 < X ≤ 0.001), large (0.001 < X ≤ 0.01), and hyperexpanded (0.01 < X ≤ 1) clones per sample.
Prefiltering of Ribonucleic Acid Samples for NanoString
Extracted RNA samples were tested for quality and amount of RNA using the Agilent Bioanalyzer 2100 with the RNA Nano 6000 kit. Only samples that passed 2 of the 3 quality checks were considered for NanoString analysis. The filtering parameters included (1) a minimum concentration of 10 ng/μL or detectable RNA with the RNA Nano 6000 kit, (2) greater than 50% of the RNA with size greater than 200 bp, and (3) an RNA integrity number (RIN) score greater than 2. Due to the targeted nature of NanoString, lower quality RNA is acceptable in the assay.
NanoString
An nCounter NanoString XT Codeset was developed to target genes of interest. A total of 200 ng of input RNA was used. If 200 ng of input RNA was not possible in 5 μL of sample, then 5 μL of sample was added. Samples were hybridized at 65°C for 24 hours. After hybridization, samples were prepped using the nCounter MAX Analysis System prep station. After prep, cartridges were placed at 4°C until reading with a minimum of 3 days between prep and reading of cartridges. Reading of cartridges was performed on the nCounter MAX Analysis System digital analyzer. All samples were run in duplicate on separate cartridges to acquire technical replicates.
Analysis of NanoString Data
Raw counts files were loaded in the nSolver Advance Analysis Software version 3.0 to compile counts tables and perform cartridge quality control checks. Quality control checks included a minimum field of view count of 75 (expected is 270), a check for binding density between 0.5 and 2.25, determination of positive control linearity with a minimum linear relationship of 0.95, and a minimum limit of detection for the lowest input positive control (0.5 fM) of 2 standard deviations above the negative controls. Data were then exported as a .csv file for further analysis.
Counts Files Were Then Read Into “R”
Normalization of the counts was performed as follows. The positive control normalization was performed to account for variance across lanes. The geometric mean of the positive control values for each lane was determined. Then, an average value for these geometric means was calculated. A positive control normalization value was calculated for each lane by dividing the average across the lanes by the geometric mean for each lane. This was then used as a multiplier for the gene counts in the lanes. Next, normalization for the input amount of RNA for the different samples was determined. Three potential housekeeping genes were included. To determine the best housekeeping gene, a global background threshold was determined. This was determined by taking the mean and 2 standard deviations of all the negative control values across all the lanes. Then, filtering of the 3 housekeeping genes was performed by determining whether in all the samples, the housekeeping count values were greater than the global background. The 2 remaining genes were then tested for stabilization across the samples using the Normfinder function in R. RPL37A was determined to have the lowest variance value (0.4) across the samples and was used for input control. For the normalization, a process similar to that of the positive controls was used. A mean of the counts across the lanes was determined, and a scaling factor was calculated by dividing the mean across the lanes by the counts of RPL37A within the sample. Then, the positive control normalized counts were multiplied by this value to account for input control.
Samples Were Filtered to Remove Unreliable Data
Samples that had abnormally high positive control or housekeeping normalization values (>5) were removed because this signifies a significant low quality of reads. Next, samples that were left without a technical replicate were filtered out because there was no way to validate the reads. Finally, the fit value for the technical replicates was determined by calculating a linear fit of the replicates to each other using the lm function in R. If the pairs had an R2 value less than 0.9, they were removed. The remaining samples were collapsed across the replicates using the mean expression values. Validation of the NanoString was done by comparing the counts values to the Ct value, which resulted in high and significant (P < .05) correlation.
Gene Expression Analysis
Principal component analysis (PCA) was performed using the prcomp function in R. Clustering of samples and genes was performed with the hclust function in R using a correlation value instead of raw expression to determine patterns of expression versus raw expression values. Differential gene expression was performed using the lm function in R with a P cutoff of .05. Heatmap generation for gene expression was performed on scaled data to show a z-score of expression for each gene. This was done using the scale function in R. Finally, relationship to TCR and Ct data was done using the cor.test function in R to determine whether the gene expression had a significant correlation to either the TCR diversity or the Ct value. Plots were generated in R using ggplot2 or ComplexHeatmaps or in GraphPad/Prism.
RESULTS
Cross-Sectional Analysis of Ebola Virus Disease Transcriptomic Signatures
The expression of a discrete set of mRNAs related to T-cell function, DC function, infection sensing, and apoptosis or proliferation was evaluated. To rule out effects related to timing of sample collection, a cross-sectional analysis of samples spanning 4–49 days after the self-reported onset of symptoms was performed. In this analysis, RNA samples obtained from leftover EDTA blood samples used in diagnostics that had passed 2 quality checks were used in NanoString analysis (see Methods). The NanoString gene set included genes involved in activation and inhibition of T-cell and DC function as well as genes involved in pathogen sensing and innate immunity and in apoptosis or proliferation (Supplementary Table 2). To allow unbiased data interrogation, a PCA was applied to the NanoString gene expression data. Strikingly, expression levels of T cell-related and DC-related genes grouped the samples from EVD fatalities and survivors into 2 defined clusters (Figure 1A and B). Conversely, no sample clustering was observed when the PCA analysis was done with genes related to pathogen sensing or apoptosis or proliferation (Figure 1C and D). These results suggested that the DC-T cell interface played a major role in host immune responses to EBOV infection and EVD survival.
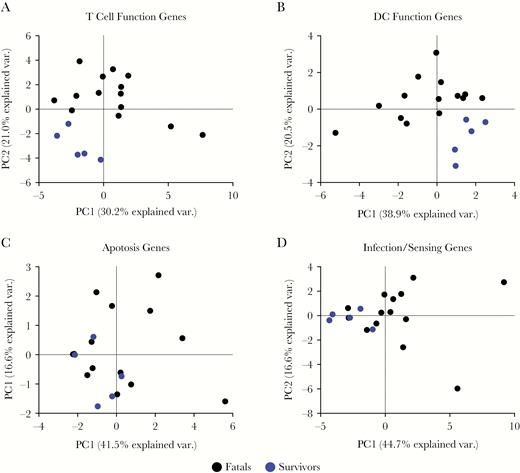
Principal component analysis (PCA) of the NanoString gene expression data. (A) Sample clustering shown for the first 2 principal components (PC) with PC1 on the x-axis and PC2 on the y-axis for T-cell related genes. Ebola virus disease (EVD) fatalities are shown in black and EVD survivors are shown in blue with each point representing an individual sample. (B) Similar plot for dendritic cell (DC)-function genes (C) for apoptosis and (D) for infection or sensing. Fatals (n = 14 samples), survivors (n = 5 samples).
Overall, the heatmap data of all samples indicated increased abundance of genes involved in T-cell immunity such as T-bet, RANTES, CD40L (CD154), and CD28 in samples from surviving patients compared with nonsurvivors. These results are consistent with the notion that during EVD, patients mount robust and sustained T-cell immune responses [3, 5]. In samples obtained from fatal EVD cases, we observed a higher expression of genes related with T-cell exhaustion and homeostasis control, including CTLA-4, retinoic acid, Eomes, PD-L1, and Foxp3 (Supplementary Figure 1).
Biomarkers of Fatal and Nonfatal Ebola Virus Disease
We expanded the sample set of EVD survivors to identify individual parameters in the cross-sectional analysis that showed significant differences between fatal and nonfatal EVD (Supplementary Figure 2A). As expected, the expression levels of EBOV RNA, as determined by NanoString analysis, were significantly higher in samples from fatal EVD compared with survivor samples (Figure 2A). This finding reinforced the idea that the viral load is a bona fide biomarker of EVD outcome as previously reported [11–13]. It is interesting to note that in the cross-sectional analysis, samples from fatal EVD patients showed significantly higher levels of expression of granzyme B and perforin, 2 molecules produced during degranulation of CD8 T cells and natural killer (NK) cells that mediate apoptosis in target cells [14] (Figure 2B). These results suggested a strong activation of cytotoxic responses in fatal EVD patients.
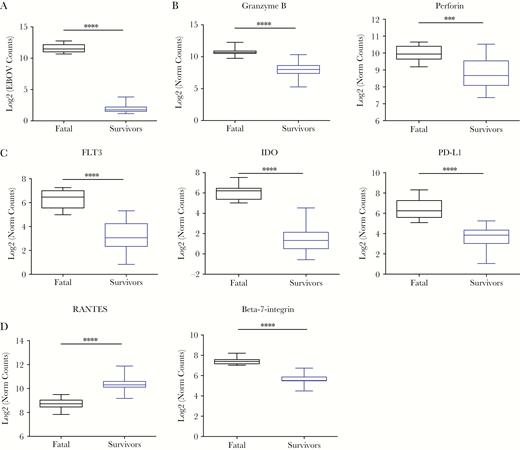
Box plots of differentially expressed genes within the NanoString codeset. (A) Ebola virus (EBOV)-ribonucleic acid log2 of normalized gene counts (y-axis) between EBOV disease (EVD) fatalities (black) and EVD survivors (blue). (B) Similar plots for degranulation markers granzyme B and perforin, (C) Fms-related tyrosine kinase 3 (FLT3) and indoleamine 2,3-dioxygenase (IDO), and programmed cell death (PD)-L1, and (C) RANTES and β7-integrin. Asterisks represent significance cutoffs: **P ≤ .01, ***P ≤ .001, ****P ≤ .0001. Fatals (n = 10 samples), survivors (n = 20 samples).
In comparison with those from survivors, samples from fatal EVD patients also showed an increased abundance of 2 important transcripts related with DC function, namely, the cytokine Fms-related tyrosine kinase 3 (FLT-3), an important driver of hematopoiesis and, in particular, of DC differentiation [15] and indoleamine 2,3-dioxygenase (IDO) (Figure 2C). Indoleamine 2,3-dioxygenase is induced by type I and II interferons (IFN-I and IFN-II) and converts mature DCs into tolerogenic DCs, thereby protecting tissues from immune damage [16]. Moreover, samples from fatal EVD patients showed significantly higher abundanced of the PD-1 ligand molecule PD-L1 (Figure 2C). The expression of this molecule together with IDO suggests a homeostatic effort to control T-cell activation and is consistent with the high expression of T-cell immune checkpoint molecules observed in the T cells of fatal EVD patients [5, 6].
It is interesting to note that differences were observed in genes related to recruitment of T cells to sites of infection as well as T-cell homing. Samples from survivors showed higher expression levels of chemokine (C-C motif) ligand 5 (CCL5/RANTES), which mediates recruitment of T cells to sites of infection [17, 18]. However, samples from fatal patients showed higher expression of the mucosal homing factor β7-integrin, which is involved in the recruitment of lymphocytes to the gut mucosa [19, 20] (Figure 2D). These data suggested strong T-cell activation in fatal EVD and different homing profile than that seen in survivors. Nevertheless, this strong T-cell activation profile observed in fatal EVD was not associated with control of virus replication (Figure 2A).
Gene Expression Dynamics Over the Course of Ebola Virus Disease
To determine the relationship between differential gene expression and disease status, the changes in gene expression over time were assessed in fatal and nonfatal EVD samples. The set of samples included in this analysis spanned days 1 to 18 post-onset and included 5 fatal patients with 10 total samples and 5 survivors with 20 total samples (Supplementary Figure 2A).
Analysis of gene expression over time in fatalities indicated increased abundance in EBOV RNA copy number and significant decrease of PD-L1, RANTES, and the RANTES receptor CCR4 messenger RNAs (mRNAs) (Supplementary Figure 2B). Similarly, survivors showed decrease of PD-L1, FLT-3, CCR3, β7-integrin, and perforin mRNAs over the course of recovery. This decrease of mRNA abundance was correlated with virus clearance, because EBOV RNA copy numbers also decreased over time (Figure 3A and Supplementary Figure 2B). To better understand this dynamic, the trends of transcripts involved in T-cell homeostasis, activation, and homing were compared in fatal and nonfatal EVD samples over time. As expected, the levels of expression of T-cell inhibitory molecules PD-1 and CTLA-4, as well as the PD-1 receptor PD-L1, were higher in samples from fatal cases. Over the course of fatal EVD, a sharp decrease of PD-1 and PD-L1 transcripts was observed, reflecting perhaps late efforts to control T-cell homeostasis. Survivors also showed moderate decrease of PD-1 and PD-L1 over time in concomitance with virus clearance (Figure 3A and B). In agreement with the cross-sectional data, samples from fatal cases had higher levels of transcripts related to T-cell activation, for example the transcription factors T-bet and Eomes, and the T-cell costimulatory molecule CD154 (CD40L) (Figure 3C). Eomes transcripts also decreased in survivor samples over time, whereas in the case of T-bet and CD154, the observed trend was towards upregulation.
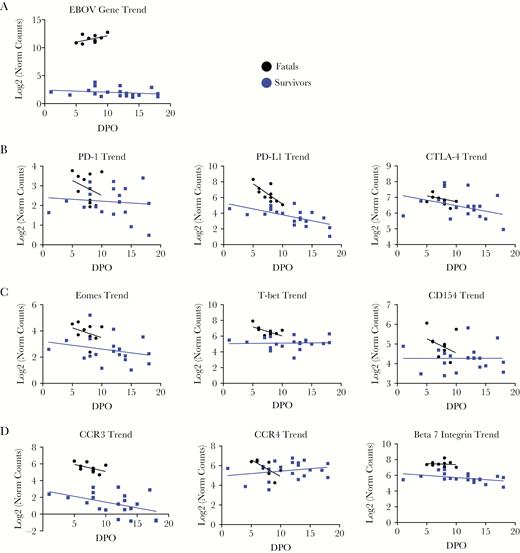
Trends in the expression of genes involved in T-cell homeostasis (A), activation (B), and homing (C), as well as in the expression of Ebola virus (EBOV)-ribonucleic acid (D) (log2 of normalized counts on y-axis), are shown over the course of EBOV disease (x-axis) for fatalities (black) and survivors (blue). Fatals (n = 10 samples), survivors (n = 20 samples). Abbreviations: CTLA-4, cytotoxic T lymphocyte-associated protein 4; DPO, days postonset (self-reported); PD, programmed cell death.
Finally, samples from fatal and nonfatal EVD showed differences in the expression levels of 3 important molecules involved in lymphocyte homing, namely, CCR3, CCR4, and β7-integrin. The levels of CCR3, which are involved in lymphocyte homing to the respiratory mucosa [21], were higher in samples from fatal patients and decreased over time in both fatal and nonfatal EVD. In contrast, both types of samples showed similar levels of CCR4, which directs lymphocyte homing primarily to the skin [22], although with opposite trends. Although in fatal EVD the levels of CCR4 decreased over time, we observed a moderate increase in samples from survivors (Figure 3D). As described for CCR3, the abundance of β7-integrin, which is related to gut homing, was significantly higher in samples from fatal patients and remained at high levels during disease. In survivors, the overall levels of expression were lower and decreased moderately over time.
Taken together, the observed trends indicated moderate T-cell activation in surviving individuals and a trend towards lymphocyte homing to the epithelia. In contrast, in fatal EVD, the high levels of T-cell activation observed were associated with upregulation of T-cell coinhibitory molecules and did not correlate with virus clearance. In these samples, homing signatures were for the respiratory and gut mucosa, perhaps reflecting an association between disease severity and EBOV replication at these body sites.
T-Cell Receptor Diversity and Clonal Expansion in Human Ebola Virus Disease
The gene expression data strongly suggested that differences in T-cell responses marked, at least to some extent, the immunological differences between EVD survivors and fatalities. Unfortunately, the quality of the samples from the Guinean epidemic did not allow functional experiments; therefore, we needed to establish additional measures to gain insight into the role of T cells during EVD. To this end, the kinetics of T-cell diversity and clonal expansion over the course of infection was determined in fatal and nonfatal EVD samples via TCR sequencing. Sequencing of the CDR3 of the TCR-β chain allowed us to determine the number of different clonotypes (T-cell clones) in fatal and nonfatal EVD and to evaluate clonal expansion and TCR diversity.
T-cell receptor diversity was assessed in a cross-sectional analysis of 30 samples of individual patients (14 survivors and 16 fatalities). Survivors showed higher TCR diversity than fatalities, suggesting that EVD survival is associated with the establishment of a polyclonal T-cell response (Figure 4A and B). Indeed, over the course of disease, TCR diversity was low at early time points in fatal patients and increased towards the end, which suggested that in these patients’ T-cell expansion occurs late and as a consequence of high viral burden. Survivors showed exactly the opposite trend, with high early TCR diversity and reduced diversity over time, suggesting a return to homeostasis after virus clearance (Figure 4C).
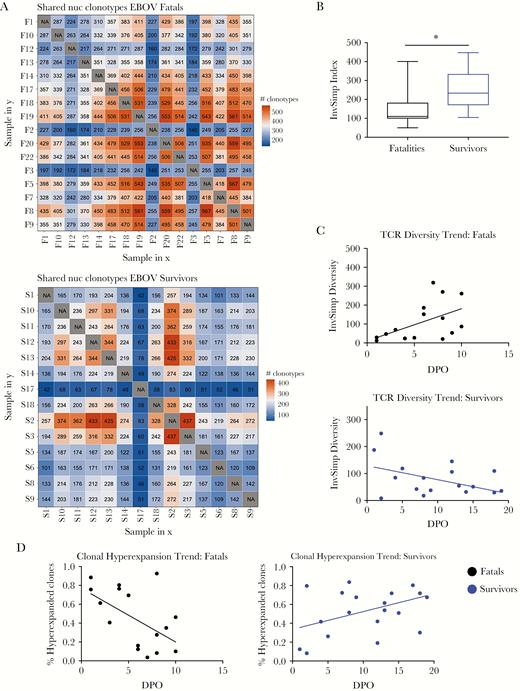
T-cell receptor (TCR) diversity in human Ebola virus disease (EVD). (A) The heatmap represents the number of shared clonotypes among patients who succumbed (top) or survived (bottom) to EVD. Orange represents a large number of shared clonotypes, and blue represents few shared clonotypes. (B) The inverse Simpson index is represented as an indicator of TCR diversity in both fatalities (black) and survivors (blue). (C) Dynamics in the TCR diversity are shown over the course of EVD for fatalities (top) and survivors (bottom). (D) Dynamics of clonal hyperexpansion are shown over the course of EVD for fatalities (left) and survivors (right). (A and B) Fatals (n = 16 patients), survivors (n = 14 patients). (C and D) Fatals (n = 16 samples from 4 patients), survivors (n = 19 samples from 3 patients). Abbreviation: DPO, days postonset (self-reported).
T-cell oligoclonality may be due to several reasons including loss of thymic output, repertoire holes due to aging, or expansion of clones biased towards defined V genes [23, 24]. The patient cohort included fatal cases with a median age of 37 years (interquartile range [IQR] = 30.5–47.5) and survivors with a median of 32.5 years of age (IQR = 22.75–41.25). Therefore, there was no significant difference in the age range of both cohorts (Supplementary Figure 1A). However, TCR diversity decreased with age in both groups (Supplementary Figure 1B). This observation was in agreement with the idea that reduced T-cell repertoires due to lifetime infection with persistent and latent viruses may have an affect on T-cell responses to emerging pathogens (Supplementary Figure 3B) [25]. Similarly, a comparison of TCR gene usage (V and J genes) in fatal and nonfatal EVD samples did not reveal any TCR bias that could explain the observed differences in TCR diversity (Supplementary Figure 3C and data not shown).
To further investigate the causes for the low diversity observed in fatal EVD, we determined the kinetics of T-cell clonal expansion over time [26, 27]. In EVD samples from fatal cases, we observed early clonal hyperexpansion, suggesting that in these individuals there is a small number of clonotypes that dominate the response. In survivors, the data indicated the opposite trend, with early polyclonal T-cell activation and clonal hyperexpansion at later time points (Figure 4D). These data strongly suggested that fatal EVD was associated with strong early T-cell activation, but that activation is restricted to a low number of clonotypes that does not result in virus clearance.
DISCUSSION
Recent findings during the West African EVD epidemic have suggested that defects associated with the control of T-cell homeostasis are correlated with poor control of virus replication and therefore are biomarkers of EVD severity [5, 6, 28]. However, due to the limitations of clinical immunology studies in outbreak settings, it is still not clear how T cells contribute to recovery from EVD. In this study, we have used biological material (RNA and genomic DNA) collected during the 2013–2016 EVD epidemic in Guinea. This biological material has several limitations. First, due to the field conditions, it was obtained from peripheral blood cells, not from sorted leukocyte populations. Second, it provides only limited information on disease dynamics, in particular of fatal EVD. With these caveats in mind, we sought to utilize focused transcriptomics and TCR sequencing to gain insight into the immunobiology of human EVD.
The NanoString probe design included genes related to physiological processes known to influence the severity of EBOV infection, namely, T-cell immunity [3, 5, 28], DC function [29–31], apoptosis [32, 33], and infection sensing [34–38]. Of note, only genes related to the DC-T cell interface allowed clustering of samples, which reflected differences between fatal and nonfatal EVD. These findings strongly suggest that the bridge between innate and adaptive immunity is an important barrier to EBOV infection and, perhaps, underscores the importance of T-cell priming in the absence of pre-existing antibody immunity. Our findings are also in line with previous studies which suggested that improper innate immune responses hamper the adaptive immune response to EBOV [37, 39].
In both cross-sectional and longitudinal analyses, samples from fatal EVD cases showed higher abundance of transcripts related to T-cell activation, including effector molecules and transcription factors. However, this observation was correlated with higher levels of expression of T-cell coinhibitory molecules, which suggested an “exhaustion-like” T-cell phenotype resembling other acute inflammatory processes such as malaria infection, Q-fever, and sepsis [40–42]. Despite the high abundance of transcripts corresponding to T-cell effector molecules in fatal EVD, this phenotype did not correlate with virus clearance. However, we acknowledge that our study is limited to transcript analysis and that during inflammation, a discrepancy between mRNA and protein networks may occur [43]. Several previous studies have indicated that high expression of transcript due to inflammation may be compensated homeostatically by preventing protein translation, for example, through regulation of mRNA stability or via 3’-untranslated region-mediated suppression [43, 44]. An alternative explanation could be systemic, cytokine-mediated, T-cell activation. This phenomenon is associated with high inflammation settings such as sepsis, autoimmunity, and cancer and leads to systemic proliferation of T cells with cytotoxic capability [45–48]. Because T-cell homing signatures are imprinted during antigen presentation [49, 50], cytokine-activated T cells usually have homing signatures that are different from those of antigen-specific T cells [45, 46]. In fact, another interesting finding that can be drawn from our data are the differences in the expression of homing factor transcripts in fatal and nonfatal EVD. Lymphocyte homing molecules are expressed in the cell surface and allow recirculation of T cells from the blood and lymphatics to sites of infection [51]. Therefore, arbovirus-specific T cells express skin homing molecules such as cutaneous lymphocyte antigen, whereas rotavirus-specific T cells express high levels of β7-integrin [19, 52]. Albeit with the aforementioned limitations, our data suggest different lymphocyte homing signatures in fatal and nonfatal EVD. In particular, samples from fatalities showed significantly higher abundance of transcripts of mucosal homing factors, which may reflect severity associated with EBOV replication in the respiratory and gastrointestinal tracts [7, 53].
Finally, our data revealed a very different trend in T-cell expansion during EVD in fatal and nonfatal cases. As discussed, these data do not necessarily reflect the kinetics of EBOV-specific T cells, which would have required T cell sorting. This was not possible because all samples were collected in the field. Thus, taking into account that our data reflects the overall T-cell dynamics during EVD, we observed that severe EVD was associated with early expansion of a low number of clones and overall low TCR diversity at early time points. More importantly, expansion of these clones did not correlate with virus clearance. There are several hypotheses that can be drawn from these data. First, neither age-related loss of TCR diversity nor TCR bias seemed to account for the observed differences. Second, we speculate that the early hyperexpansion of clones observed in fatal EVD may be due to homeostatic proliferation due to lymphopenia or inflammation [54, 55]. This phenomenon, which has been described in different inflammatory conditions including persistent infection and cancer, is characterized by the proliferation of T cells with different TCR that divide to compete for sub-threshold interactions with peptide-major histocompatibility complexes [54, 56, 57]. If that is the case, it will be important to elucidate the antigen specificity of these early clones because they may include self-reactive T-cell clones that can cause immunopathology [57]. Finally, these and other possibilities, such as expansion of cross-reactive T-cell clones, loss of thymic output, or human leukocyte antigen allele-dependent immunodominance patterns, need to be further investigated in adequate animal models.
CONCLUSIONS
Our findings underscore the importance of T-cell immune responses for clearance of EBOV infection and recovery, and we provide additional insight into the role of TCR repertoires during infection. Our results also warrant further investigations into the applicability of T cell-directed immunotherapy as a putative postexposure treatment for EVD.
Supplementary Data
Supplementary materials are available at The Journal of Infectious Diseases online. Consisting of data provided by the authors to benefit the reader, the posted materials are not copyedited and are the sole responsibility of the authors, so questions or comments should be addressed to the corresponding author.
Notes
Acknowledgments. We thank all of the partners who contributed to end the 2013–2016 Ebola virus disease epidemic in West Africa. In particular, we thank the World Health Organization (WHO) field teams, the African Union, Médecins Sans Frontières, and the medical teams deployed by the Cuban government in Coyah. We also thank all the volunteers who participated in the activities of the Europan Mobile Laboratory (EMLab) in West Africa. The EMLab is a technical partner of the WHO Emerging and Dangerous Pathogens Laboratory Network and the Global Outbreak Alert and Response Network.
Financial support. This work was funded by grants from the German Research Foundation (DFG-MU 3565/3-0 and DFG-GU 883/5-1) and the German Center for Infection Research (DZIF-TTU01.702; to C. M.-F. and S. G.). E. S. is supported by a National Science Foundation Graduate Research Fellowship under Grant No. DGE-1247312. J. H. C. was supported by R01 AI1096159 and R21 AI121933. J. A. H. was funded by US Food and Drug Administration Grant HHSF223201510104C.
Potential conflicts of interest. All authors: No reported conflicts of interest. All authors have submitted the ICMJE Form for Disclosure of Potential Conflicts of Interest. Conflicts that the editors consider relevant to the content of the manuscript have been disclosed.
References
Author notes
aE. S. and P. R. have contributed equally to this work.

