


Abstract
HIV-1 genetic sequences can be used to infer viral transmission history and dynamics. Throughout the United States, HIV-1 sequences from drug resistance testing are reported to local public health departments.
We investigated whether inferred HIV transmission network dynamics can identify individuals and clusters of individuals most likely to give rise to future HIV cases in a surveillance setting. We used HIV-TRACE, a genetic distance-based clustering tool, to infer molecular transmission clusters from HIV-1 pro/RT sequences from 65736 people in the New York City surveillance registry. Logistic and LASSO regression analyses were used to identify correlates of clustering and cluster growth, respectively. We performed retrospective transmission network analyses to evaluate individual- and cluster-level prioritization schemes for identifying parts of the network most likely to give rise to new cases in the subsequent year.
Individual-level prioritization schemes predicted network growth better than random targeting. Across the 3600 inferred molecular transmission clusters, previous growth dynamics were superior predictors of future transmission cluster growth compared to individual-level prediction schemes. Cluster-level prioritization schemes considering previous cluster growth relative to cluster size further improved network growth predictions.
Prevention efforts based on HIV molecular epidemiology may improve public health outcomes in a US surveillance setting.
Human immunodeficiency virus-1 (HIV-1) genetic sequence data can provide insight into viral transmission dynamics through phylogenetic [1, 2] and molecular transmission network analyses [3]. Studies using these molecular epidemiology approaches have characterized high-risk transmission groups [1, 2, 4–11], rapidly growing clusters of HIV transmission [9, 12], undisclosed transmission risk factors [13], international transmission routes [14–16], and antiretroviral treatment (ART) resistance transmission dynamics [17–19]. Recent work by Poon et al [20] illustrated the potential of HIV-1 molecular transmission network analysis to direct public health resources towards growing transmission clusters in a timely fashion.
The connectivity underlying infectious disease transmission networks can have implications for the design and targeting of interventions. HIV transmission networks resemble scale-free networks [15, 21, 22], in which network structure is governed by a relatively small proportion of highly connected individuals [23].This structure is likely a consequence of the scale-free properties of the sexual and injection drug use contact network along which HIV is propagated [24]. Therefore, intervention and prevention efforts targeted at the parts of the transmission network with the greatest potential for future growth are expected to have disproportionately large effects on preventing onward transmission [23–25]. However, there is reason for concern that the largest clusters in a molecular transmission network represent sampling bias and not growth potential [26, 27]. Furthermore, it remains unclear whether molecular epidemiology approaches can provide superior predictions of future cluster growth, compared to predictions from standard transmission risk factor and demographic data.
New York City (NYC) has the largest HIV burden in the United States, with 121616 people diagnosed, reported, and presumed to be living with HIV/AIDS and 2493 new diagnoses in 2015 [28]. Here, we characterize the NYC Department of Health and Mental Hygiene (DOHMH) molecular transmission network and analyze the growth dynamics of clusters of HIV transmission. Our findings confirm that we can identify clusters with the greatest potential for future growth by interrogating the history of past cluster growth. This finding suggests that cluster growth dynamics can inform the allocation and prioritization of public health resources in a surveillance setting and supports the use of networks in evaluating the effects of these activities.
METHODS
Data Collection
Since 2005, when resistance testing is ordered by a physician in NYC, the resulting HIV pro/RT nucleotide sequence is reported to DOHMH, where it is stored in a surveillance registry along with demographic, geographic, and transmission risk data (see Ethics Statement in Supplementary Material). We queried the surveillance registry on 10 July 2017. Our dataset comprised 65736 individuals (cases) with a reported HIV-1 pro/RT sequence and associated metadata (see Supplementary Material for quality control information).
Transmission Network Construction
We inferred a molecular transmission network using HIV-TRACE (www.hivtrace.org) [29]. Sequences were aligned to HXB2 (positions 2253–3749). Sites associated with drug resistance were included, because HIV-TRACE is not biased by these sites [8, 15, 16, 30]. Genetic distances (TN93 [31]) were calculated among all pairs of sequences, using an ambiguity fraction of 0.015 (ie, genetic distances between ambiguous nucleotides were resolved only when the sequence comprised ≤1.5% ambiguous nucleotides) [29]. We then identified potential transmission partners: pairs whose viral divergence was ≤0.015 substitutions/site [30] and assembled linked partners into clusters. Correlates of clustering were investigated using multivariate and univariate logistic regression (see Supplementary Material).
Characterizing Network Growth
We interrogated the molecular transmission network to find prioritization schemes capable of targeting cases (either individually or by cluster) most likely to give rise to newly added cases in the subsequent 12 months. During each month between January 2007 and January 2015, these schemes were used to identify 500 “targeted” cases. For each individual and cluster targeted through these schemes, we determined the number of new genetically linked cases that arose in the subsequent 12 months. New cases were only considered to represent cluster “growth” if they were diagnosed and had a viral genotype reported to NYC DOHMH in the 12 months subsequent to prioritization. This approach precluded the possibility a delay in resistance testing or genotype reporting would be misconstrued as network growth. Note that many of these newly diagnosed cases are not newly infected since the time of targeting of individuals/clusters. Rather they may represent infected individuals previously unaware of their HIV infection.
LASSO Machine Learning for Individual-Level Targeting Prediction
To identify individual level characteristics associated with network growth, we built a prediction model using LASSO (Least Absolute Shrinkage and Selection Operator) regression machine learning [32]. In every month between January 2007 and January 2015, a LASSO model was trained on all cases diagnosed 12 months prior, with a binary outcome variable indicating the addition of at least 1 new genetically linked partner diagnosed with a reported genotype in the previous 12 months. Cross validation with a lambda penalty coefficient within 1 standard error of the minimum error was used to optimize parameter selection. All covariates from the multivariate logistic regression analysis were included; we also added current age (categorical) and whether the case was diagnosed in the previous 12 months (binary). Geographical data were binned into neighborhoods based on United Hospital Fund codes commonly used by NYC DOHMH [28]. The model was trained and then evaluated month by month across the observation period (see Supplementary Material for example).
Growth for Individual Targeted Nodes
All individual-level prioritization schemes targeted 500 individuals. Determining the number of new genetically linked cases for cases prioritized at the individual level presents a complication, because future new cases can be genetically linked to multiple existing cases, not just the targeted case. Therefore, for the individual-level targeting schemes, we adjusted the weight of new cases by dividing by their degree centrality (ie, number of potential transmission partners linked to the new case). Therefore, if a new case is genetically linked to both a targeted cases and also linked to 3 additional potential transmission partners, we would determine that the targeted case has added 0.25 new genetically linked cases.
Growth for Targeted Clusters
To permit direct comparison of cluster-level to individual-level schemes, clusters were added to the target group, 1 entire cluster at a time, until the total number of prioritized individuals met or exceeded 500. Thus, all schemes could be evaluated on a per-person basis (ie, number of newly added cases per total number of cases in the targeted clusters, even if this total exceeded 500). For example, if a new case is genetically linked to a targeted cluster of size 4, the cluster grows by 1, and each targeted case has added 0.25 new genetically linked cases.
Temporal Trends
Temporal trends in predictive power were assessed using the Jonckheere-Terpstra test [33, 34] using growth outcomes from the first month of the year from 2007 through 2014.
RESULTS
Individual-Level Correlates of Clustering
Higher rates of viral transmission increase the chances that a genetically linked, potential transmission partner will be found in the surveillance database, because less time has elapsed for the genetic distance between viruses in these partners to exceed the 0.015 substitutions/site threshold for identifying these partners (see [27] for discussion of transmission rate versus sampling bias). Of the 65736 genotyped individuals included in our study, 14527 (22.1%) clustered in the NYC surveillance molecular transmission network (Figure 1 and Table 1). Significantly increased odds of clustering were observed in men who have sex with men (MSM), Whites and Asians, people diagnosed with recent or acute HIV infection, people diagnosed between 13 and 29 years of age, and people diagnosed at DOHMH sexually transmitted disease clinics (now designated as Sexual Health Clinics) (multivariate logistic regression; Table 1). Similar results were seen using a univariate logistic regression model (Supplementary Table 1).
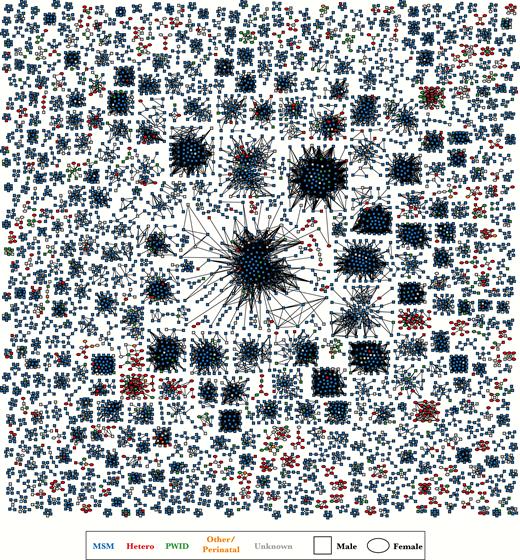
New York City HIV-1 surveillance molecular transmission network. Clusters with ≥5 cases (ie, nodes) are depicted. Links (ie, edges) indicate genetic distance ≤0.015 substitutions/site. Color indicates transmission risk factor and shape indicates birth sex. Abbreviations: Hetero, heterosexual; MSM, men who have sex with men; PWID, persons who use injection drugs.
Factors Associated with Clustering in the NYC Surveillance Genetic Transmission Network in Multivariate Logistic Regression Model
| Attribute | Category | Cases with a Genotype | Clustered in Network, No. (%) | Adjusted Odds Ratio | Odds Ratio 95% CI | P Value |
|---|---|---|---|---|---|---|
| All | … | 65736 | 14527 (22.1) | … | … | … |
| Transmission risk (birth sex) | Hetero (F) | 10595 | 1506 (14.2) | … | … | … |
| Hetero (M) | 3558 | 563 (15.8) | 1.47 | 1.31–1.64 | <.001 | |
| MSM (M) | 25699 | 9398 (36.6) | 2.71 | 2.54–2.90 | <.001 | |
| PWID (F) | 3492 | 283 (8.1) | 0.86 | 0.75–0.99 | .036 | |
| PWID (M) | 7733 | 751 (9.7) | 1.01 | 0.91–1.12 | .829 | |
| Other (F) | 839 | 40 (4.8) | 0.58 | 0.27–1.23 | .158 | |
| Other (M) | 765 | 52 (6.8) | 0.85 | 0.40–1.79 | .661 | |
| Unknown (F) | 3704 | 275 (7.4) | 0.63 | 0.55–0.72 | <.001 | |
| Unknown (M) | 9351 | 1659 (17.7) | 1.56 | 1.44–1.69 | <.001 | |
| Race/ethnicity | Black/AA | 30909 | 5523 (17.9) | … | … | … |
| Hispanic/Latino | 22712 | 5269 (23.2) | 1.40 | 1.33–1.47 | <.001 | |
| White | 10327 | 3150 (30.5) | 1.41 | 1.33–1.50 | <.001 | |
| Asian/PI | 1390 | 474 (34.1) | 1.50 | 1.31–1.71 | <.001 | |
| AI/AN | 179 | 43 (24.0) | 1.34 | 0.91–1.96 | .137 | |
| Other | 219 | 68 (31.1) | 1.34 | 0.97–1.86 | .080 | |
| Status at diagnosis | Long term | 10715 | 3684 (34.4) | … | … | … |
| Recent | 4692 | 2825 (60.2) | 1.96 | 1.82–2.12 | <.001 | |
| Acute | 653 | 442 (67.7) | 2.16 | 1.81–2.59 | <.001 | |
| Unknown | 49676 | 7576 (15.3) | 0.43 | 0.41–0.46 | <.001 | |
| Country of birth | US | 39536 | 8995 (22.8) | … | … | … |
| Foreign | 13415 | 3224 (24.0) | 0.81 | 0.77–0.86 | <.001 | |
| US dependency | 4193 | 642 (15.3) | 0.79 | 0.72–0.88 | <.001 | |
| Unknown | 8592 | 1666 (19.4) | 0.91 | 0.85–0.97 | .005 | |
| Age at diagnosis, years | <13 | 1507 | 86 (5.7) | 0.56 | 0.26–1.17 | .122 |
| 13–19 | 2990 | 1110 (37.1) | 1.42 | 1.30–1.56 | <.001 | |
| 20–29 | 19268 | 5983 (31.1) | … | … | … | |
| 30–39 | 22068 | 4092 (18.5) | 0.65 | 0.62–0.68 | <.001 | |
| 40–49 | 13713 | 2242 (16.3) | 0.55 | 0.51–0.58 | <.001 | |
| 50–59 | 4774 | 827 (17.3) | 0.56 | 0.52–0.62 | <.001 | |
| ≥60 | 1416 | 187 (13.2) | 0.38 | 0.32–0.45 | <.001 | |
| Residency at diagnosis | Bronx | 13551 | 2751 (2.3) | … | … | … |
| Brooklyn | 14866 | 3409 (22.9) | 1.02 | 0.96–1.09 | .517 | |
| Manhattan | 15589 | 4282 (27.5) | 1.05 | 0.99–1.12 | .126 | |
| Queens | 8060 | 2248 (27.9) | 1.11 | 1.04–1.20 | .004 | |
| Staten Island | 1049 | 219 (20.9) | 0.98 | 0.83–1.17 | .835 | |
| Unknown NYC | 6973 | 442 (6.3) | 0.41 | 0.37–0.46 | <.001 | |
| Outside NYC | 5648 | 1176 (20.8) | 0.67 | 0.62–0.73 | <.001 | |
| AIDS status | HIV (Non-AIDS) | 23319 | 8726 (37.4) | … | … | … |
| AIDS | 42417 | 5801 (13.7) | 0.46 | 0.44–0.49 | <.001 | |
| Diagnosis provider | STD clinic | 3041 | 1581 (52.0) | 1.54 | 1.41–1.68 | <.001 |
| Other | 62695 | 12946 (20.6) | … | … | … |
Abbreviations: AI/AN, American Indian/Alaska Native; Asian/PI, Asian/other Pacific Islander; Black/AA, Black/African American; CI, confidence interval; Hetero, heterosexual; MSM, men who have sex with men; NYC, New York City; PWID, persons who use injection drugs; STD, sexually transmitted disease.
Across the 5 boroughs of NYC (ie, Brooklyn, the Bronx, Manhattan, Queens, Staten Island), individuals who resided in Queens or Manhattan at diagnosis were the most likely to cluster, though only cases from Queens had significantly higher odds of clustering in the adjusted model which accounts for transmission risk and race/ethnicity (Table 1). Cases who did not have an address and those residing outside NYC had the lowest odds of clustering. However, despite high numbers of reported diagnoses and genotypes, the clustering frequency for cases residing in the Bronx and Brooklyn were far lower than in Manhattan and Queens (Figure 2). These lower clustering frequencies in the Bronx and Brooklyn may be more reflective of biases in engagement in care, rather than differences in transmission rates (see Discussion).
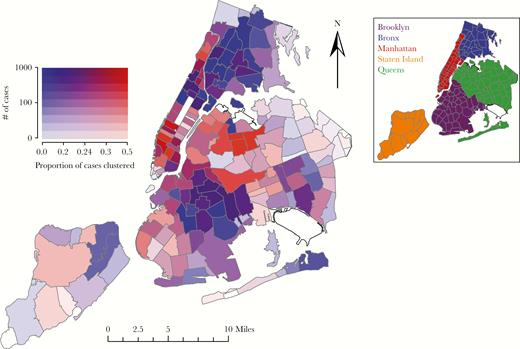
Map of New York City (NYC) depicting the proportion of cases clustered and the number of cases with reported genotypes in each ZIP code. White zones represent parks and ZIP codes with no associated HIV resistance genotypes in the surveillance database. Darker shading indicates increased number of total case with reported genotypes. Cooler blue colors indicate low proportion clustering and hotter red colors indicate higher proportion clustering. The insert identifies the 5 boroughs of NYC: Brooklyn (purple), the Bronx (blue), Manhattan (red), Staten Island (orange), and Queens (green).
NYC Molecular Transmission Network
Of the 3600 inferred clusters in the NYC surveillance molecular transmission network, 2096 (58.2%) were dyads, whereas 652 (18.1%) included at least 5 cases. Among standard network formation models [35], the NYC network was best described by the Waring distribution (preferential attachment with a proportion of randomly formed links), with a characteristic exponent (ρ) of 2.48 (95% profile likelihood confidence interval: 2.47–2.52), consistent with estimates from other HIV molecular networks [15, 21].
Network Growth
Since 2007, a mean of 1553 new cases have been added to the surveillance sequence dataset annually, and 46.5% of these post-2007 cases are clustered in the network (Supplementary Table 2). Over this time period, cluster growth in a given year is correlated with cluster growth in the following year: mean R2 of 0.32. To improve our ability to identify the parts of the network with greatest potential for future growth, we evaluated various individual and cluster-level prioritization schemes.
First, we generated a null expectation for growth from randomly selected individuals and randomly selected clusters. A random selection of HIV cases added, on average, 0.011 (95% upper bound: 0.020) new, genetically linked cases in the subsequent 12 months (Table 2). Randomly selected molecular transmission clusters (size ≥2) gave rise to, on average, 0.076 (95% upper bound: 0.104) new, genetically linked cases per targeted case in the subsequent 12 months (Table 2). By virtue of being in a molecular transmission cluster, clustered cases are 7-fold more likely than a random case (clustered or unclustered) to lead to a new, genetically linked case in the following 12 months. However, as more cases have been added to the surveillance database over time, the yield of future growth due to simply being clustered in the network has decreased significantly (P < .001; Table 2), from 0.130 new cases per prioritized case in 2007, to 0.042 in 2014 (Figure 3).
Evidence for Temporal Trends in Number of New Cases per Prioritized Case Under Growth Prediction Schemes
| Target | Prioritization Scheme | Mean Number of New Linked Cases per Prioritized Case | Direction of Trend | P Value |
|---|---|---|---|---|
| Individual | Random cases | 0.011 | None | .905 |
| Recently diagnosed cases | 0.063 | Increasing | .061 | |
| LASSO prioritized cases | 0.128 | None | .999 | |
| Cluster | Random clusters | 0.076 | Decreasing | <.001 |
| Largest clusters | 0.126 | Decreasing | <.001 | |
| Cluster growth | 0.129 | Decreasing | .031 | |
| Relative cluster growth | 0.136 | None | .999 | |
| Square root relative cluster growth | 0.149 | None | .399 | |
| Combined | LASSO + square root cluster growth | 0.152 | None | .300 |
Abbreviation: LASSO, least absolute shrinkage and selection operator.
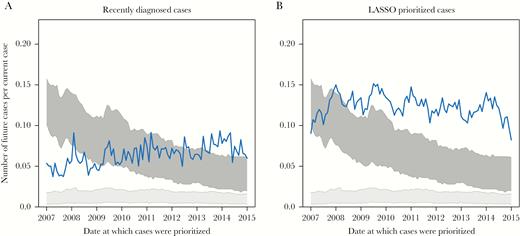
Performance of individual-level growth prediction schemes. Numbers of newly diagnosed and genotyped cases per prioritized cases in the 12 months following prioritization are shown for (A) cases diagnosed in the previous 12 months and (B) cases prioritized by LASSO regression model. The light gray block represents number of newly diagnosed and genotyped cases linked to randomly selected cases, and the dark gray block represents number of newly diagnosed and genotyped cases linked to randomly selected clusters. All schemes prioritized at least 500 cases. Line denotes individual-level prioritization schemes.
Individual-Level Prioritization Schemes
Currently, NYC DOHMH offers HIV services (eg, linkage to care and partner elicitation, notification, and testing) to all newly diagnosed cases. According to our analysis, recently diagnosed cases yield greater than 5-fold as many new cases in the subsequent 12 months compared with randomly selected cases: 0.063 versus 0.011 new genetically linked cases per prioritized case (Table 2 and Figure 3B). By incorporating demographic, transmission risk, and geographic information into a prediction algorithm—using LASSO regression—we further improved our ability to predict future genetically linked cases to 0.128 new genetically linked cases per prioritized case (Table 2). Recently diagnosed cases and LASSO prioritized cases were consistently linked to significantly more cases in the subsequent 12 months than randomly selected cases (Figure 3B). The LASSO model favored young White MSM diagnosed with recent HIV infection (see Supplementary Table 3 for a complete summary of the covariates), similar to what was observed in the multivariate regression framework (Table 1). There was no evidence for a declining temporal trend in the predictive power of random individuals and individuals prioritized using LASSO (Table 2); however, we found weak evidence for an increase in the predictive power over time of prioritizing recently diagnosed cases (P = .061).
Cluster-Level Prioritization Schemes
Previous work on network-based prioritization has identified the largest clusters and those clusters that have recently experienced the most growth (ie, number of new cases recently added to the cluster) as high priority for public health [9, 20]. Prioritizing clusters using both of these approaches performed significantly better than prioritizing random cases at predicting genetically linked cases in the subsequent 12 months (Figure 4Aand 4B). During the early years of molecular HIV surveillance in NYC, these approaches performed better than prioritizing random clusters. However, over time, the predictive power of prioritizing the largest clusters or clusters experiencing the most growth in the past 12 months has significantly decreased (Table 2), even after excluding a large cluster representing the early years of the US HIV epidemic (see Supplementary Material). By mid-2012, prioritizing the largest clusters or those clusters with the greatest growth in the previous 12 months was no longer better than prioritizing random clusters (Figure 4A and 4B), though it was still better than prioritizing random individuals.
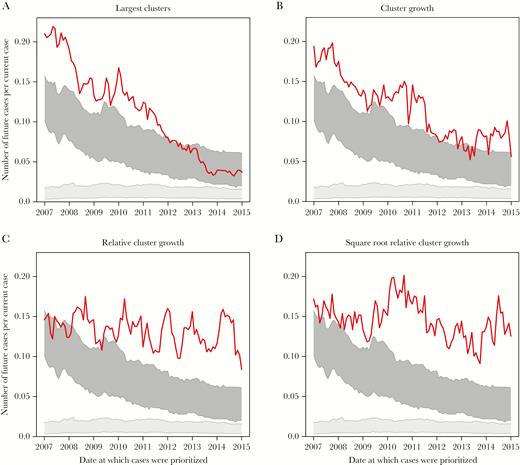
Performance of cluster-level growth prediction schemes. Numbers of newly diagnosed and genotyped cases per prioritized cases in the 12 months following prioritization are shown for (A) cases in the largest clusters, (B) cases in clusters that experienced the greatest growth in the previous 12 months, (C) cases in clusters that experienced the greatest growth in the previous 12 months relative to cluster size at time of prioritization, and (D) cases in clusters that experienced the greatest growth in the previous 12 months relative to the square root of cluster size at time of prioritization. The light gray block represents number of newly diagnosed and genotyped cases linked to randomly selected cases, and the dark gray block represents number of newly diagnosed and genotyped cases linked to randomly selected clusters. All schemes prioritized at least 500 cases. Line denotes cluster-level prioritization schemes.
Considering cluster growth in relation to cluster size improves predictive power. Prioritizing clusters with the greatest growth in the previous 12 months divided by cluster size predicts, on average, 0.136 new cases per prioritized case (Figure 4C). However, a cluster with 5 cases that then doubles in size is likely of greater importance than a cluster with 2 cases that doubles in size, because the doubling of a large cluster is less likely to represent stochasticity in network growth. To down-weight growth in small clusters, we consider previous growth divided by the square root of cluster size, which further improves our ability to predict new, genetically linked cases: 0.149 new cases per prioritized case (Figure 4D). Dividing growth by the log10 of cluster size performed similarly. These relative growth strategies consistently perform better than random clusters (and random individuals), and there is no evidence of a decrease in their predictive power over time (Table 2).
Combining Individual- and Cluster-Level Attributes into LASSO Model
To explore the impact of a combined individual- and cluster-level approach, we constructed a series of LASSO models that incorporated past cluster growth divided by the square root of cluster size for each node. As before, this model was trained on the addition of a single genetically liked case in the previous year and used to prioritize cases in the network. Cases targeted by this combined LASSO model led to a mean 0.152 new genetically linked cases per prioritized case, the best performance of all prioritization schemes explored here (Table 2). The combined LASSO model identified similar predictors to the original LASSO model, though strongly favored inclusion of the square root relative cluster growth metric (Supplementary Table 3). The combined LASSO model predicted more new genetically linked cases than the original LASSO model 92% of the time (Figure 5); the combined LASSO model was better than using only growth divided by the square root of cluster size only 57% of the time.
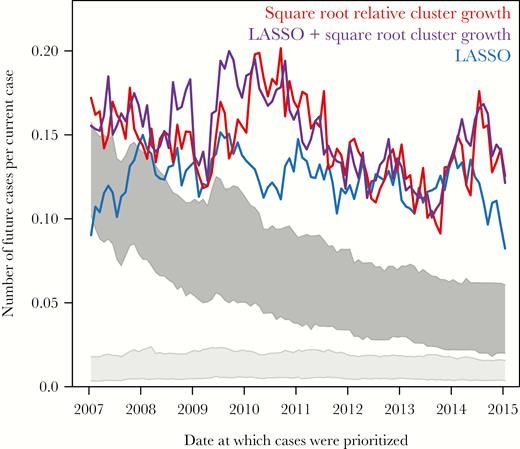
Performance of combined individual- and cluster-level growth prediction schemes. Numbers of newly diagnosed and genotyped cases per prioritized cases in the 12 months following prioritization are shown for cases prioritized by the LASSO regression model (blue), cases in clusters that experienced the greatest growth in the previous 12 months relative to the square root of cluster size at time of prioritization (red), and cases prioritized by a LASSO regression model that includes the square root relative growth metric (purple). The light gray block represents number of newly diagnosed and genotyped cases linked to randomly selected cases, and the dark gray block represents number of newly diagnosed and genotyped cases linked to randomly selected clusters. All schemes prioritized at least 500 cases.
Sensitivity Analysis
Sensitivity analyses performed by selecting 250 or 1000 target cases provided qualitatively similar results, and increasing the number of targeted cases increased precision (Supplementary Figure 1).
DISCUSSION
In the NYC HIV-1 molecular transmission network, past cluster growth predicts future cluster growth. This finding supports the use of molecular transmission networks constructed from HIV-1 resistance genotypes in a US surveillance setting to identify individuals and groups of individuals at greatest risk of transmitting HIV or being the source of additional, undiagnosed HIV infections [3].
A machine learning approach that incorporated individual-level data collected as part of HIV surveillance activities in the United States—including time since diagnosis, transmission risk factor, age, and race/ethnicity—was predictive of acquiring new connections in the network. However, network features based on cluster growth dynamics were more effective at predicting network growth than individual-level prioritization schemes. Clusters prioritized based on growth in the previous year divided by the square root of current cluster size were 13-times more likely to give rise to future cases than random targeting, leading to an average of 0.149 new cases in the subsequent 12 months. This prioritization scheme favors cluster growth relative to total cluster size and eschews existing large clusters that are not growing quickly enough to qualify for prioritization. Unlike prioritization schemes that focus only on cluster size or absolute growth, the “square root” prioritization scheme did not exhibit a decline in predictive power over time as the overall network grew larger. It is unlikely, however, that the square root prioritization scheme represents the optimal scheme by which to predict network growth; more sophisticated combination approaches including phylogenetic, demographic, geographic, and transmission risk factor data will likely further improve our ability to predict transmission network growth. However, when we incorporated “square root” prioritization scheme into our machine learning framework, substantial improvements over using only the cluster dynamics were not observed. This finding suggests that, for predicting future cluster growth, past cluster growth is the most important predictor explored in this study. Importantly, none of the prioritization schemes explored here is a true proxy for standard public health services in NYC. Nonetheless, the “square root” prioritization scheme represents a robust, straightforward metric by which we could begin to evaluate the effect of network-based prevention activities in a surveillance population.
Our findings support the hypothesis proposed by Little et al [22] that the molecular transmission network can be used to identify priorities for intervention. Unfortunately, we were unable to assess the relative effectiveness of the Transmission Network Score algorithm (which is based on degree centrality and inferred transmission direction), because surveillance data are typically minimally informative regarding directionality of transmission, unlike data from Little et al’s cohort of individuals with acute and early HIV infection.
It is important to consider the practical public health interventions that could be prioritized based on molecular transmission dynamics. Presumably, priority clusters represent the known HIV-infected population most likely to give rise to new infections and harbor undiagnosed, genetically linked cases; however, some cluster growth represents diagnosis as a result of DOHMH partner notification and testing services. In NYC, all newly diagnosed cases are provided with linkage to care and partner services; however, in jurisdictions where these services are not universal, services could be directed to cases in priority clusters, as well as epidemiologically linked, uninfected individuals (eg, pre-exposure prophylaxis). Furthermore, within priority clusters, people who are out of care or have unsuppressed viremia are potentially attractive targets for prioritization for return to care, ART-management and adherence services, and partner services.
Even though our findings demonstrate that we can predict future HIV cluster growth in a surveillance setting, not all cluster growth is equivalent. There are 2 factors that contribute to the growth of HIV molecular clusters: (1) incident infections representing transmission since the cluster was prioritized; and (2) diagnosis of prevalent cases who were already infected but undiagnosed at the time of cluster prioritization. Both of these scenarios represent actionable information: cases that can be prevented or cases that can be diagnosed, respectively. Preventing incident infections and improving diagnosis rates are both laudable public health goals; however, they can be considered distinct objectives of prevention activities based on molecular HIV surveillance.
A simulation study by Dearlove et al [26] suggested that the largest clusters in an HIV-1 molecular transmission network may be artifacts without current epidemiological importance. Our results support this proposition with respect to identifying recent transmission and prioritizing clusters for intervention, in that the largest clusters in NYC did not lead to the best new case yield. Although the largest clusters did experience the greatest growth on a per-case basis in the earliest years of molecular surveillance, by mid-2012, the largest clusters were no better than random clusters at predicting cluster growth.
Surveillance data are susceptible to biases due to lack of data from groups less likely to engage in care (eg, Blacks/African Americans and heterosexual men [36]). Furthermore, individuals diagnosed with acute/early HIV infection and belonging to younger age cohorts may cluster in the network at greater frequency than their relative risk would predict due to their shorter time for HIV evolution and higher engagement in care [37, 38]. It has been suggested that HIV transmission cluster analysis may be biased by sampling, in which higher diagnosis rates are conflated with higher transmission rates [27]. Our results suggest that HIV-TRACE is, in fact, capable of identifying clusters of active HIV transmission in a surveillance setting. Nonetheless, our geographic analysis indicating low rates of clustering in regions of the Bronx and Brooklyn—despite high levels of HIV prevalence and genotyping—suggests that sampling bias (ie, undiagnosed individuals or cases lacking genotypes in the surveillance registry) may be driving these low clustering frequencies. In that case, public health efforts directed at improving diagnosis rates and resistance genotype reporting in regions with unexpectedly low clustering frequencies may prove useful.
We caution that the ability to predict cluster growth and the ability to act on this foreknowledge are quite different problems. Delays and lack of completeness in reporting diagnoses and genotypes inherent in the current surveillance system in the United States may hinder timely, effective public health action. Between 2007 and 2015 (the most recent year for which diagnosis statistics are available), only 62.6% of newly diagnosed cases in NYC had a genotype. Streamlining genotype reporting to local public health agencies and automating molecular transmission network analysis (as has been recently accomplished in British Columbia [20]) would help to ameliorate this problem. Further evaluation studies are needed to determine whether early genotyping and network-informed intervention efforts can improve public health outcomes.
Supplementary Data
Supplementary materials are available at The Journal of Infectious Diseases online. Consisting of data provided by the authors to benefit the reader, the posted materials are not copyedited and are the sole responsibility of the authors, so questions or comments should be addressed to the corresponding author.
Presented in part: HIV Dynamics and Evolution Conference, Isle of Skye, Scotland, UK, April 2017.
Acknowledgments. We thank Victor de Grutolla and Konrad Scheffler for their helpful conversations formulating this project and Sarah Braunstein, Manon Ragonnet Cronin, and Sasha Murrell for their comments on the manuscript.
Financial support. This work was supported by the Center For AIDS Research Development Award (grant number P30 AI036214 to J. O. W.); National Institutes of Health National (NIH) Institute of Allergy and Infectious Disease (grant numbers K01AI110181 and AI135992 to J. O. W. and K99AI120851/R00AI120851 to B. M.); California HIV/AIDS Research Program (grant number ID15-SD-052 to J. O. W.); NIH-National Institute of Mental Health (grant number MH100974 to S. R. M.); NIH-National Institute on Drug Abuse (grant numbers DA037811 to S. R. M. and DA034978 to D. M. S. ); NIH-National Institute of General Medical Sciences (grant number GM110749 to S. L. K. P.); and the C3 Cancer Consortium (grant to S. R. M.).
Potential conflicts of interest. J. O. W. has received research grant support to his institution from Gilead Sciences, Inc. D. M. S. has received research grant support to his institution from ViiV Pharmaceuticals and consultant fees from Gen-Probe and Testing Talent Services. All other authors report no potential conflicts. All authors have submitted the ICMJE Form for Disclosure of Potential Conflicts of Interest. Conflicts that the editors consider relevant to the content of the manuscript have been disclosed.

