


Abstract
Brain structural abnormalities have been reported in persons living with human immunodeficiency virus (HIV; PLWH) who are receiving suppressive combination antiretroviral therapy (cART), but their pathophysiology remains unclear.
We investigated factors associated with brain tissue volumes and white matter microstructure (fractional anisotropy) in 134 PLWH receiving suppressive cART and 79 comparable HIV-negative controls, aged ≥45 years, from the Comorbidity in Relation to AIDS cohort, using multimodal neuroimaging and cerebrospinal fluid biomarkers.
Compared with controls, PLWH had lower gray matter volumes (−13.7 mL; 95% confidence interval, −25.1 to −2.2) and fractional anisotropy (−0.0073; 95% confidence interval, −.012 to −.0024), with the largest differences observed in those with prior clinical AIDS. Hypertension and the soluble CD14 concentration in cerebrospinal fluid were associated with lower fractional anisotropy. These associations were independent of HIV serostatus (Pinteraction = .32 and Pinteraction = .59, respectively) and did not explain the greater abnormalities in brain structure in relation to HIV infection.
The presence of lower gray matter volumes and more white matter microstructural abnormalities in well-treated PLWH partly reflect a combination of historical effects of AIDS, as well as the more general influence of systemic factors, such as hypertension and ongoing neuroinflammation. Additional mechanisms explaining the accentuation of brain structure abnormalities in treated HIV infection remain to be identified.
Despite the use of combination antiretroviral therapy (cART), widespread brain gray and white matter abnormalities have been reported in persons living with human immunodeficiency virus (HIV; PLWH) [1–3], including those with viral suppression [4, 5]. For example, we have recently shown that PLWH receiving suppressive cART who participated in the Comorbidity in Relation to AIDS (COBRA) study demonstrated lower gray matter volumes and more white matter microstructural abnormalities than HIV-negative controls [4]. The pathophysiology of these abnormalities among well-treated PLWH remains to be fully elucidated and likely reflects a range of factors. Untreated HIV infection, severe immunodeficiency, ill health (such as that manifested by prior AIDS), and ongoing central nervous system (CNS) HIV replication, immune activation, and inflammation despite cART may all contribute [5–8]. Cardiovascular risk factors (eg, hypertension) and lifestyle factors (eg, alcohol or recreational drug use) may also play a role [9–12]. Elucidating which of these factors contribute to gray and white matter abnormalities is important because this may provide future therapeutic targets. Conceptually, brain injury could be ongoing (ie, active) and/or historical (ie, static). Distinguishing between these possibilities is important because they have different management strategies and prognostic implications.
Cerebrospinal fluid (CSF) biomarkers provide additional temporal information about neuroinflammation and neuronal damage and so can inform whether brain injury visible on neuroimaging is active [13, 14]. Various types of CSF biomarkers exist: protein biomarkers commonly identified in neurodegenerative diseases (herein referred to as “neuronal damage biomarkers”) and neuroinflammatory biomarkers. Elevated CSF neurofilament light chain concentrations are linked to active neuronal damage and are highly sensitive biomarkers of HIV-associated neuronal damage [13, 15–17], with the highest concentrations found in those with HIV-associated dementia and the lowest in those receiving suppressive cART [16–18]. Associations with other neuronal damage biomarkers, such as the total tau (t-tau) concentration, are less consistent, but some studies found increased concentrations, especially in PLWH with HIV-associated dementia [18, 19]. CSF phosphorylated-tau (p-tau) and amyloid beta 1–42 fragment (Aβ1–42) concentration reflect Alzheimer-type neurofibrillary tangle pathology and senile plaque pathology, respectively. Most studies suggest that these biomarkers are not associated with HIV-associated CNS disease [18, 19]. Analyses of neuroinflammatory biomarkers have also shown inconsistent results, and their relationship to brain injury in well-treated PLWH is unclear. Soluble CD14 (sCD14), sCD163, and neopterin concentration and the kynurenine to tryptophan (K:T) ratio are all monocyte activation markers. Elevated concentrations of plasma sCD14, plasma sCD163, and CSF neopterin have been observed in PLWH on cART [8, 20–22], but results are inconsistent for CSF sCD14, sCD163 and K:T ratio [20, 23].
The current study aimed to investigate the pathophysiology of the lower gray matter volume and white matter microstructural abnormalities in well-treated PLWH as compared to appropriately matched HIV-negative controls participating in the COBRA study [4]. We investigated a wide range of factors, including demographic characteristics, alcohol and recreational drug use, cardiovascular disease risk factors, plasma/CSF monocyte activation biomarkers, CSF neuronal damage biomarkers, and HIV-related factors.
METHODS
Study Participants
PLWH (n = 134) and HIV-negative controls (n = 79) were recruited at HIV outpatient clinics, at sexual health clinics, and from targeted community groups in Amsterdam (n = 125) and London (n = 88). Inclusion criteria were age ≥45 years (≥50 years in London) and laboratory-confirmed presence or absence of HIV-1 infection, and PLWH were required to have had a plasma HIV RNA load of <50 copies/mL for ≥12 months while receiving cART. Exclusion criteria were past or current confounding neurological diseases, severe head injury (defined as loss of consciousness for ≥30 minutes), infections or tumors involving the CNS (including AIDS-defining illnesses), current major depression (defined as a PHQ-9 questionnaire score of ≥15), self-reported injection drug use in the past 6 months, daily recreational use of drugs (with the exception of cannabis), excess alcohol consumption (defined as >48 units/week), severe psychiatric disorder, insufficient command of the Dutch or English language, and/or contraindication to magnetic resonance imaging (MRI) or lumbar puncture [4, 24]. The primary data for participants included in the current study have been published previously [4].
The study was approved by the local ethics review board of the Academic Medical Center (reference NL 30802.018.09) and a United Kingdom Research Ethics Committee (reference 13/LO/0584 London–Stanmore). All participants provided written informed consent.
Study Visits
Baseline COBRA study visits took place between December 2011 and December 2014 and included neuropsychological assessment, cerebral MRI, and lumbar puncture. CSF data from 2 participants were incomplete (owing to contraindications to lumbar puncture identified after study inclusion). Useable T1 MRI data and complete MRI diffusion data were lacking from 1 and 4 participants, respectively, owing to incomplete acquisition (n = 1) or excessive movement (n = 3).
Blood samples and data regarding age-associated comorbidities, organ dysfunction, and risk factors were collected as described previously [25, 26]. In addition, participants were asked to complete a standardized questionnaire, from which we obtained information regarding demographic characteristics, medication use, medical history, smoking status, and alcohol/recreational drug use. (Historical) data regarding HIV infection and ART were obtained from existing databases [27, 28].
Neuroimaging Data Acquisition and Imaging Processing
High resolution MRI T1-weighted and diffusion-weighted images were acquired at 3 T at both sites along 64 noncollinear directions. In London, images were acquired using a Siemens Verio scanner (Siemens, Erlangen, Germany), and in Amsterdam initially with an Intera scanner (Philips Healthcare, Best, the Netherlands) and, later, owing to scanner replacement, an Ingenia scanner (Philips Healthcare). At both sites, imaging was acquired with comparable acquisition parameters (Supplementary Methods) [4, 24].
Image processing has been described in detail previously [4, 24]. Briefly, 3-dimensional T1-weighted images were bias corrected and segmented using SPM12 software (University College London, United Kingdom), and the total gray matter volume, white matter volume, and intracranial volume were calculated. Diffusion-weighted data were preprocessed and registered to a custom template and standard space, using the Diffusion Tensor Imaging Toolkit, version 2.3.1 [29, 30], to estimate the amount of water diffusion in multiple directions. Fractional anisotropy maps for each participant were then skeletonized, using the Oxford Centre for Functional MRI of the Brain (FMRIB) Software Library, version 5.0.6 (University of Oxford, United Kingdom), and areas with considerable inter-individual variability were excluded using a threshold value (≥0.2) before we performed tract-based spatial statistical analyses, to exclude areas with considerable interindividual variability [31]. Mean fractional anisotropy values over the skeleton were calculated for each participant. Fractional anisotropy describes the degree of directionality of diffusion by water molecules, and it is expressed as a scalar value between 0 (representing an isotropic medium with diffusion occurring equally in all directions) and 1 (representing maximum anisotropy). Hence, a higher fractional anisotropy value represents a more coherent white matter structure [32].
Laboratory Assessments
CSF and serum albumin concentrations, serum lipid concentrations, glycated hemoglobin A1c concentration, glucose concentration, CD4+ and CD8+ T-lymphocyte counts, plasma HIV-1 RNA concentration, and hepatitis B virus (HBV) and hepatitis C virus (HCV) statuses were measured in fresh samples by local clinical laboratories, using routine methods. Other laboratory measurements were performed centrally on cell-free CSF/plasma samples (stored at −80°C).
The CSF to serum albumin ratio (hereafter, the “albumin ratio”) was calculated from paired samples as an indicator of blood-brain barrier integrity [33]. sCD14 and sCD163 concentrations in plasma and CSF were determined by enzyme-linked immunosorbent assays (ELISAs; CD14/CD163 DuoSet ELISAs, R&D Systems, Minneapolis, MN). CSF neopterin was quantified using an ELISA (Brahms Diagnostics, Berlin, Germany) [34]. CSF kynurenine and tryptophan concentration were determined by high-performance liquid chromatography [35]. Kynurenine concentrations below the detection limit of 0.1 μmol/L (n = 89) were set to half of the detection limit (0.05 μmol/L) to calculate the CSF K:T ratio.
CSF neurofilament light chain concentrations were measured by a sandwich ELISA (ie, a neurofilament light chain ELISA kit; UmanDiagnostics, Umeå, Sweden), and upper age-related reference values were calculated [36]. Amyloid β1 fragment 42 (Aβ1-42), p-tau, and t-tau concentrations were measured using Innotest ELISAs (Fujirebio, Ghent, Belgium) [37–39].
CSF HIV-1 RNA concentration was measured by the Abbott RealTime M2000 assay (Abbot, Chicago, IL), with a lower limit of detection of 40 copies/mL.
Statistical Analysis
Stata software (version 12.1; StataCorp, College Station, TX) was used for all statistical analyses except voxelwise analysis (FMRIB Software Library, version 5.0.6). Group comparisons were performed using the Fisher exact or Wilcoxon rank sum tests, as appropriate. Since neuronal damage biomarker concentrations increase with age, multiple linear regression models adjusted for age were used to assess differences between PLWH and HIV-negative participants.
Multiple linear regression models were used to identify factors associated with whole-brain gray matter volume and white matter skeleton fractional anisotropy. All models were adjusted for the following a priori–defined confounders: age, scanner type, and intracranial volume. Scanner type was entered into the model as a 3-concentration factor to remove variance associated with potential scanner differences [1, 40]. All models were adjusted for intracranial volume, as is recommended in volumetric and diffusion tensor imaging analyses [41, 42]. Other factors potentially associated with gray matter volume and fractional anisotropy were analyzed using a stepwise model selection approach. Variables were entered into the model when statistically significant (defined as P value of < .05) in the initial model adjusted for age, scanner type, and intracranial volume. A variable was considered a confounder or mediator if its addition to the model resulted in a change in the coefficient of HIV serostatus of >10%. Continuous variables were log10 transformed to improve normality and/or linearity between independent and dependent variables, if necessary. In addition, clinically plausible interactions between associated factors and HIV serostatus were explored.
The following factors were investigated in all individuals: (1) demographic factors, (2) use of recreational drugs and/or alcohol, (3) cardiovascular disease risk factors, (4) biomarkers of monocyte activation in plasma and CSF, (5) albumin ratio, (6) chronic HBV infection (defined as detectable HBV surface antigen) or HCV infection (defined as detectable HCV RNA), and (7) neuronal damage biomarkers. In addition, we explored the following associations with HIV-specific factors among PLWH only: (8) prior immunodeficiency (based on the nadir CD4+ T-lymphocyte count), (9) current CD4+ T-lymphocyte count and ratio of CD4+ to CD8+ T cells, and (10) CSF HIV RNA load. Last, we classified participants into 3 groups on the basis of their HIV serostatus and prior history of diagnosis of an AIDS-defining illness: HIV-negative, PLWH without prior AIDS and PLWH with prior AIDS, since trends toward lower gray matter volume and greater white matter microstructural abnormalities in those with prior AIDS were found in previous work [4]. PLWH were classified as having experienced prior AIDS when a category C event, as defined by the Centers for Disease Control and Prevention’s classification system for HIV infection, was reported, regardless of their CD4+ T-lymphocyte count.
Factors identified by linear regression analysis as independently associated with whole-brain structural imaging measures were carried forward to perform a voxelwise regression, to obtain additional spatial information (using tract-based spatial statistics for fractional anisotropy and voxel-based morphometry for gray matter volume). These localized associations were calculated using nonparametric permutation testing with 10 000 replications [43], adjusting for age, intracranial volume, and scanner type. Threshold-free cluster enhancement was used to account for spatial dependency of the tests, and only corrected P values of < .05 were considered statistically significant [44].
RESULTS
Cohort Characteristics
PLWH and HIV-negative participants were comparable with regard to age (median, 57 years; interquartile range, 51–63 years) and male sex proportion (93%), and they had similar cardiovascular disease risk factors and recreational drug use histories (Table 1). More PLWH were of African descent. All PLWH had a plasma HIV RNA load of <50 copies/mL while receiving cART, the median CD4+ T-lymphocyte count was 618 cells/μL, and 31% had a prior clinical AIDS diagnosis. The CSF HIV RNA load was <50 copies/mL in all participants but 2, in whom loads were 59 and 1043 copies/mL.
Baseline Characteristics of Persons Living With Human Immunodeficiency Virus (HIV; PLWH) and HIV-Negative Individuals Participating in the Comorbidity in Relation to AIDS Study
| Variable | PLWH (n = 134) | HIV-Negative Group(n = 79) | Pa |
|---|---|---|---|
| Demographic characteristic | |||
| Age, y | 55 (51–62) | 57 (52–64) | .24 |
| Male sex | 125 (93) | 73 (92) | .79b |
| African descent | 16 (12) | 2 (3) | .02b |
| MSM | 114 (85) | 62 (78) | .26b |
| Substance use history | |||
| Current alcohol consumption, U/wkc | 2 (0–8) | 6 (2–15) | .02 |
| Use of recreational drugs in past 6 mo | 44 (33) | 18 (23) | .16b |
| Smoking status | .26b | ||
| Never | 36 (27) | 30 (38) | |
| Former | 58 (43) | 29 (37) | |
| Current | 40 (30) | 20 (25) | |
| Cardiovascular disease risk factor | |||
| Hypertensiond | 56 (42) | 30 (38) | .67b |
| Blood pressure, mm Hge | |||
| Systolic | 131 (124–140) | 130 (123–142) | .63 |
| Diastolic | 85 (78–93) | 84 (77–91) | .55 |
| Total cholesterol/HDL cholesterol ratio | 4.1 (3.4–5.1) | 4.0 (3.5–4.8) | .63 |
| BMIf | 24.6 (22.6–27.4) | 24.6 (23.2–28.4) | .29 |
| Coinfection | |||
| Chronic HBV infectiong | 7 (6) | 0 | .05b |
| Chronic HCV infectionh | 5 (4) | 0 | .16b |
| HIV-specific characteristic | |||
| Time since HIV infection diagnosis, y | 15 (9–20) | … | |
| Duration of antiretroviral therapy, y | 13 (7–17) | … | |
| Plasma HIV RNA load <200 copies/mL | 134 (100) | … | |
| History of clinical AIDS | 42 (31) | … | |
| CD4+ T-cell count, cells/μL | |||
| Nadir | 180 (90–250) | … | |
| Current | 618 (472–806) | … | |
| Current CD4+ to CD8+ T-cell ratio | 0.84 (0.60–1.12) | … | |
Data are median value (interquartile range) or no. (%) of participants.
Abbreviation: MSM, men who have sex with men.
aBy the Wilcoxon rank sum test, unless otherwise indicated.
bBy the Fisher exact test.
cOne unit (U) of alcohol equals 1 glass of beer (200–250 mL), a small glass of wine (100–125 mL), or a small glass of spirit (25 mL).
dDefined as use of antihypertensive drugs, a systolic blood pressure of ≥140 mm Hg at all available measurements, and/or a diastolic blood pressure of ≥90 mm Hg at all available measurements.
eMeasured 3 times; the reported systolic and diastolic blood pressure measurements represent the calculated mean of available measurements.
fBody mass index (BMI) is calculated as the weight in kilograms divided by the height in meters squared.
gDefined as a detectable hepatitis B virus (HBV) surface antigen.
hDefined as detectable hepatitis C virus (HCV) RNA.
Plasma and CSF Biomarkers
PLWH had higher concentrations of plasma sCD14 and plasma sCD163 concentration (Figure 1A and 1B, respectively), a higher CSF neopterin concentration (Figure 2C), and a higher CSF K:T ratio (Figure 2D) as compared to controls. No group differences were observed for the albumin ratio (Figure 1C) and CSF sCD14 and CSF sCD163 concentrations (Figure 2A and 2B, respectively).
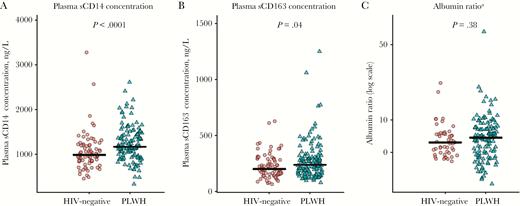
Jitterplots of plasma monocyte activation biomarkers (A and B), and albumin ratios (calculated as the ratio of the CSF concentration in albumin to that in serum; C) in persons living with human immunodeficiency virus (PLWH) and HIV-negative participants. The black lines denote medians, the red circles represent HIV-negative participants, and the green triangles represent PLWH. A color version of this figure is available online. P values were calculated using Wilcoxon rank sum test. sCD14, soluble CD14; sCD163, soluble CD163. aData were missing among 30 HIV-negative controls and 5 PLWH. CSF albumin concentrations were not measured in HIV-negative individuals at the study sites in London.
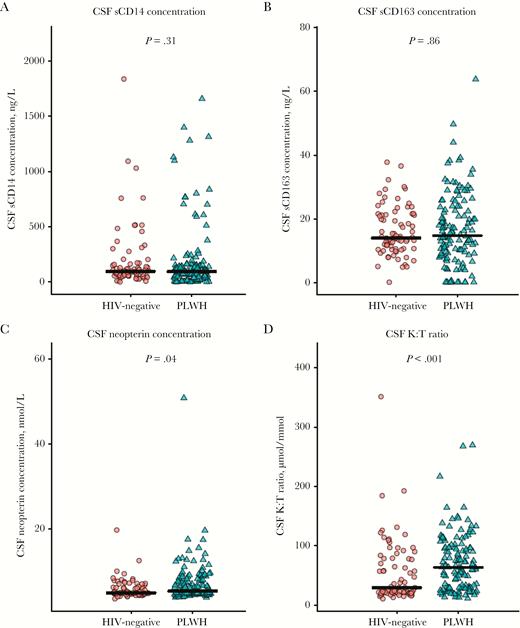
Jitterplots of cerebrospinal fluid (CSF) monocyte activation biomarkers in persons living with human immunodeficiency virus (PLWH) and HIV-negative participants. The black lines denote medians, the red circles represent HIV-negative participants, and the green triangles represent PLWH. P values were calculated using Wilcoxon rank sum test. A color version of this figure is available online. K:T ratio, kynurenine to tryptophan ratio; sCD14, soluble CD14; sCD163, soluble CD163.
CSF neurofilament light chain concentrations were comparable in the HIV-positive and HIV-negative groups (Figure 3A), but there was a trend toward slightly higher concentrations (by 10% [95% confidence interval {CI}, −1%–23%]; P = .07) among PLWH, after adjustment for age (Supplementary Figure 1). No group differences were found in the prevalence of CSF neurofilament light chain concentrations above age-related reference values (3% among PLWH vs 4% among HIV-negative participants) or in Aβ1–42 concentration (Figure 3D). T-tau and p-tau CSF concentrations were lower among PLWH (Figure 3C and 3D, respectively), even after adjustment for age.
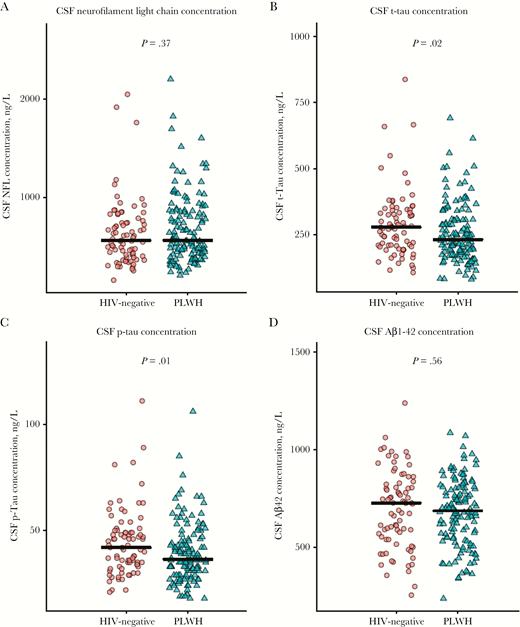
Jitterplots of cerebrospinal fluid (CSF) neuronal damage biomarkers in persons living with human immunodeficiency virus (PLWH) and HIV-negative participants. The black lines denote medians, the red circles represent HIV-negative participants, and the green triangles represent PLWH. P values were calculated using Wilcoxon rank sum test. A color version of this figure is available online. Aβ1–42, amyloid β1 fragment 42; NFL, neurofilament protein; p-tau, phosphorylated tau; t-tau, total tau.
Factors Associated With Gray Matter Volume
As previously described [4], PLWH had lower total gray matter volume than HIV-negative controls (Table 2, model 1). Classification by HIV serostatus and prior AIDS demonstrated that gray matter volume was only significantly lower in PLWH with prior AIDS (Table 2, model 2). compared with controls.
Linear Regression Models of the Associations Between Human Immunodeficiency Virus (HIV) Positivity and Clinical AIDS Status, Hypertension, and Soluble CD14 (sCD14) Concentration and Both Gray Matter Volume and Fractional Anisotropy
| Model | Gray Matter Volume in mL (n = 212) | Fractional Anisotropy (n = 208) | ||
|---|---|---|---|---|
| Coefficient (95% CI) | P | Coefficient (95% CI) | P | |
| Model 1 | ||||
| HIV positivea | −13.7 (−25.1 to −2.2) | .02 | −0.0073 (−.012 to −0.0024) | .004 |
| Model 2 | ||||
| HIV positive, no prior clinical AIDSa | −9.6 (−21.7 to –2.5) | .12 | −0.0056 (−.011 to −.0004) | .04 |
| HIV positive, prior clinical AIDSa | −23.4 (−38.7 to −8.1) | .003 | −0.011 (−.018 to −.0047) | .001 |
| Model 3b | ||||
| HIV positive, no prior AIDSa | … | … | −0.0058 (−.011 to −.0006) | .03 |
| HIV positive, prior AIDSa | … | … | −0.011 (−.017 to −.0041) | .002 |
| Hypertension | … | … | −0.0054 (−.010 to −.0005) | .03 |
| sCD14 CSF concentration (per 10% increase) | … | … | −0.0002 (−.0004 to −.00004) | .01 |
Multiple linear regression models were constructed to identify factors associated with whole brain gray matter volume and white matter skeleton mean fractional anisotropy. All models were adjusted for the following a priori–defined confounders: age, scanner type, and intracranial volume. Other factors potentially associated with gray matter volume and fractional anisotropy were analyzed using a stepwise model selection approach. Associations with HIV-specific factors were explored only among people living with HIV.
Abbreviations: CI, confidence interval; CSF, cerebrospinal fluid.
aThe reference group consists of HIV-negative controls.
bModel 3 included 205 individuals, owing to missing CSF sCD14 data. The log10-transformed CSF sCD163 concentration was also negatively associated with fractional anisotropy, but it was not included in the model because of collinearity.
Across the entire study population, an independent association was found between the total gray matter volume and the t-tau concentration (1.4 mL increase [95% CI, .01–2.8] per 10% increase in t-tau concentration; P = .05). There were no associations observed between gray matter volume and other factors (P > .1 for all comparisons), and no factors significantly mediated the association between HIV infection and gray matter volume. In linear regression analysis among PLWH only, nadir CD4+ T-lymphocyte count, current CD4+ T lymphocyte count, ratio of CD4+ to CD8+ T cells, and CSF HIV RNA load were not associated with gray matter volume (P > .1 for all comparisons).
PLWH with prior AIDS had significantly lower gray matter volume than HIV-negative individuals in various locations, including but not limited to the postcentral gyrus, paracingulate gyrus, and Heschl gyrus (Figure 4A).
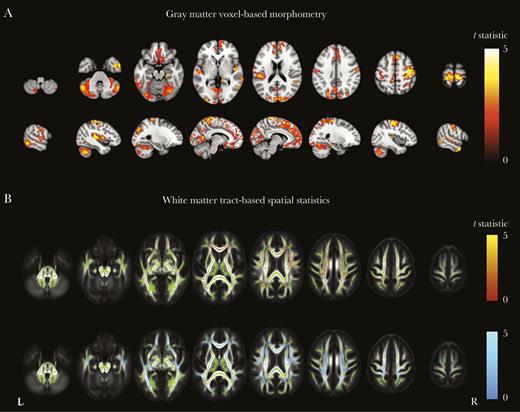
Gray matter voxel-based morphometry and white matter tract-based spatial statistics among persons living with human immunodeficiency virus (PLWH), with or without prior AIDS, as compared to HIV-negative individuals. A, Regions where gray matter volume was significantly lower among PLWH with prior clinical AIDS (reference group, HIV-negative individuals). B, Areas where fractional anisotropy was significantly lower among PLWH without prior clinical AIDS (red; top row) and those with prior clinical AIDS (blue; bottom row), compared with HIV-negative individuals. Areas are colored by the t statistic, corrected for multiple comparisons and adjusted for age, scanner type, and intracranial volume. Significant differences (P < .05) are overlaid on the gray matter or the mean fractional anisotropy image (gray scale) and the white matter skeleton (green).
Factors Associated With Microstructural White Matter Abnormalities
PLWH also had lower fractional anisotropy than HIV-negative controls (Table 2, model 1), as previously described [4]. Classification by HIV serostatus and prior AIDS demonstrated that both subgroups of PLWH (ie, those with and those without prior AIDS) had white matter microstructural abnormalities, which were greatest among those with prior AIDS (Table 2, model 2).
Across the entire study sample, fractional anisotropy was independently and negatively associated with the presence of hypertension and higher CSF sCD14 concentrations, although these factors did not influence the strength of the association between HIV serostatus and fractional anisotropy (Table 2, model 3). There were no interactions between HIV serostatus and either hypertension (P = .32) or CSF sCD14 concentration (P = .59). No association was found between fractional anisotropy and concentrations of CSF neurofilament light chain or other biomarkers (all P > .1), and the biomarkers did not mediate HIV-related differences in fractional anisotropy. In linear regression analysis among PLWH only, nadir CD4+ T-lymphocyte count, current CD4+ T-lymphocyte count, ratio of CD4+ to CD8+ T cells, and CSF HIV RNA load were not associated with fractional anisotropy (P > .1 for all comparisons).
Regardless of the presence or absence of a prior AIDS diagnosis, PLWH had lower fractional anisotropy than HIV-negative individuals in many white matter tracts, including but not limited to the corpus callosum and corona radiata. Differences were more pronounced for the group with prior AIDS (Figure 4B). Both hypertension and the sCD14 concentration were negatively associated with fractional anisotropy in various locations (Figure 5). For the CSF sCD14 concentration, these locations included the corpus callosum, superior fronto-occipital fasciculi, and corona radiata; for hypertension, locations included the anterior corona radiata and external capsule.
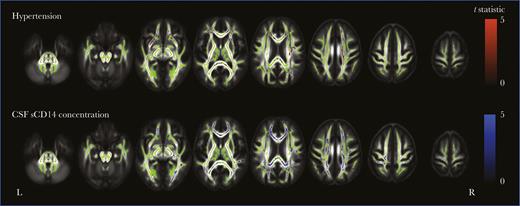
White matter tract-based spatial statistics of hypertension and cerebrospinal fluid (CSF) soluble CD14 (sCD14) concentration in all participants. Shown are regions where fractional anisotropy negatively correlates with hypertension (top row) and CSF sCD14 concentration (bottom row) for all participants (P < .05). Areas are colored red (hypertension) or blue (CSF sCD14 concentration), based on the t statistic, corrected for multiple comparisons and adjusted for age, scanner type, intracranial volume, and human immunodeficiency virus (HIV) serostatus. Significant differences are overlaid on the white matter skeleton (green) and the mean fractional anisotropy image (gray scale).
DISCUSSION
Despite effective cART, PLWH had lower gray matter volume, widespread white matter microstructural abnormalities, and persistent systemic immune activation. The most-severe abnormalities were found in subjects with prior clinical AIDS. In addition, white matter microstructural abnormalities were associated with hypertension and higher concentrations of CSF monocyte activation biomarkers. Our findings suggest that abnormalities in brain structure in PLWH with viral suppression are likely to reflect the historical effects of prolonged untreated infection, rather than ongoing injury, and the influence of systemic factors, such as hypertension and ongoing neuroinflammation independent of HIV infection.
Several findings in our study suggest a legacy effect of prolonged untreated HIV infection, with the risk of further HIV-associated brain injury likely being mitigated by effective cART. First, PLWH with prior AIDS had the most-severe structural abnormalities. Gray matter volume was reduced in PLWH but only significantly so among those with prior AIDS, suggesting that gray matter loss may be predominantly associated with prolonged untreated infection. This gray matter volume loss for PLWH in general was more modest than in previous studies [1], perhaps because all PLWH in this study had suppressed plasma HIV replication. However, these gray matter changes, which were most pronounced in PLWH with prior AIDS, may have cognitive sequelae similar to other neurodegenerative diseases if sufficient in magnitude. White matter microstructural abnormalities were present in all PLWH but were most pronounced in those with prior AIDS, suggesting that white matter microstructural abnormalities occur earlier in the course of infection than gray matter volume loss. Second, the CSF neurofilament light chain concentration was not significantly elevated among PLWH, with virtually all measurements below upper age-related reference values. Since CSF neurofilament light chain provides information regarding the presence of active brain injury, this suggests a lack of substantial ongoing HIV-associated neuronal damage. Third, CSF neuronal damage biomarkers were not associated with imaging measures of brain structure nor were they mediators of the observed HIV-related differences in brain structure, which again suggests static rather than active brain injury. This conclusion is supported by previous work reporting greater structural abnormalities in PLWH with longer known duration of HIV infection (and, hence, probably longer duration of untreated HIV infection) [7, 45, 46] and immunodeficiency [5] and by studies in neuroasymptomatic untreated PLWH reporting substantially higher CSF neurofilament light chain concentrations, mainly among those with low CD4+ T-lymphocyte counts [16–18]. Our results reinforce current recommendations of early cART initiation, as this is likely to limit structural brain damage from progressing.
Our results suggest that systemic factors such as hypertension also contribute to observed white matter microstructural abnormalities. Across all our study participants, hypertension was independently associated with fractional anisotropy. This is unsurprising, as hypertension is a well-known cause of white matter abnormalities [47]. For example, patients with uncontrolled hypertension show more white matter microstructural abnormalities than those with controlled hypertension [9]. This relationship emphasizes the importance of treating hypertension, especially in PLWH, and future studies should address the effect of antihypertensive treatment on neuroimaging abnormalities in PLWH.
CSF sCD14 concentrations were negatively associated with fractional anisotropy. This relationship was independent of HIV serostatus and did not explain HIV-related reductions in white matter integrity. Across the whole group, this relationship was seen across large parts of the white matter, suggesting a potentially important link between concentration of monocyte activation and white matter integrity. Underlying mechanisms of this correlation are unclear but could reflect either neurotoxic or neurotrophic effects of microglial or macrophage activation within the brain [48]. Spillover of plasma monocyte activation biomarkers into the CSF is less likely because CSF sCD14 concentrations were not significantly correlated with the albumin ratio or plasma sCD14 concentration (data not shown). In the future, more-specific biomarkers might be able to further elucidate the mechanisms through which immune activation within the CNS affects white matter structure and its implications for preserving brain health.
We found evidence for persistent systemic immune activation (ie, higher plasma sCD14 and sCD163 concentrations) in PLWH. Concentrations of these specific monocyte activation markers were not elevated in the CSF. Since values of other CSF monocyte activation biomarkers (ie, the neopterin concentration and the K:T ratio) were elevated among PLWH but were not associated with neuroimaging abnormalities, the precise nature of the intrathecal immune activation remains unclear. The observed discrepancy in CSF biomarker concentrations might indicate activation of a specific interferon γ–induced pathway in PLWH, which induces neopterin and indolamine-2,3-dioxygenase expression (which, in turn, results in elevated K:T ratios) but does not per se result in increased shedding of CSF sCD14 and sCD163 [49, 50].
Our study is representative of most PLWH in developed healthcare systems. We only recruited PLWH on suppressive cART for ≥12 months, removing potentially confounding effects of ongoing untreated HIV infection. Another major strength was our recruitment of well-matched HIV-negative controls from sexual health clinics and targeted community groups. The control group is critical to the interpretation of our results, because HIV-specific effects can only be identified by comparison of PLWH to controls with similar lifestyles and demographic characteristics. Our control group did not reflect the general population but was instead highly comparable to the HIV-positive group with regard to demographic characteristics, sexual and other risk behavior, and cardiovascular disease risk factors. Last, the robust statistical analyses are a strength of the study. Through linear regression analyses in all PLWH and HIV-negative participants jointly, we were able to investigate associations between structural imaging measures and a wide range of factors, study interactions with HIV serostatus, and identify potential confounders or mediators. In addition, voxelwise analyses allowed us to investigate focal associations with brain structure.
Despite its strengths, this study has several limitations. First, as a cross-sectional analysis this work can merely report associations. Longitudinal data are needed to elucidate whether the observed structural abnormalities are progressive. Second, CSF albumin concentrations were not measured among HIV-negative participants recruited in London, resulting in 14% of the cohort having no data on albumin ratio. Multiple imputation did not significantly change the associations between albumin ratio and imaging measures (not reported). Third, the current work was exploratory, and multiple statistical tests were performed, which might have resulted in type I errors. Fourth, cognitive function was not included in the current analysis. However, previously we found that white matter microstructural injury in affected tracts was associated was poorer cognitive function [4]. Last, owing to the study’s large proportion of white men who have sex with men, it is unclear whether our results are generalizable to other populations with greater proportions of PLWH of other races and ethnicities, HIV-infected women, and/or PLWH with incomplete cART use.
In conclusion, the presence of lower gray matter volume and widespread white matter microstructural abnormalities in PLWH receiving suppressive cART partly reflect a combination of historical injury that occurred during untreated HIV infection, as well as the more general influence of systemic factors, such as hypertension and ongoing neuroinflammation. Appropriate blood pressure management and early cART initiation may therefore both contribute to safeguarding brain health and cognitive function in PLWH.
Supplementary Data
Supplementary materials are available at The Journal of Infectious Diseases online. Consisting of data provided by the authors to benefit the reader, the posted materials are not copyedited and are the sole responsibility of the authors, so questions or comments should be addressed to the corresponding author.
Notes
Acknowledgments. We thank all study participants, for their time and effort, and the POPPY and AGEhIV study teams at their respective sites.
Financial support. This work was supported by the European Union Seventh Framework Programme (grant FP-7-HEALTH 305522 to the Comorbidity in Relation to AIDS project); the National Institute for Health Research (NIHR; professorship NIHR-RP-011-048 to D. J. S.); the NIHR Imperial Biomedical Research Center; The Netherlands Organization for Health Research and Development (ZonMW, grant 300020007); AIDS Fonds (grant 2009063); the Nuts-Ohra Foundation (grant 1003–026 to C. M.’s institution); Sahlgrenska University Hospital (ALFGBG-430271); ViiV Healthcare, Gilead Sciences, Janssen Pharmaceutica N.V., Bristol-Myers Squibb (BMS), and Merck & Co (unrestricted scientific grants from all to the AGEhIV cohort study); BMS, Gilead Sciences, Janssen, Merck, and ViiV Healthcare (investigator-initiated grants from all to the POPPY cohort study) the Swedish and European Research Councils (grant to H. Z.) the Knut and Alice Wallenberg Foundation (grant to H. Z.); Frimurarestiftelsen (grant to H. Z.); and Swedish State Support for Clinical Research.
Potential conflicts of interest. R. Z. has received travel grants from Gilead Sciences and was a speaker at an event sponsored by Gilead Sciences for which her institution received remuneration. C. S. has received funding from Gilead Sciences, ViiV Healthcare, and Janssen-Cilag for membership on data safety and monitoring boards, advisory boards, speaker panels and for the development of educational materials. F. W. has received travel grants from Gilead Sciences, ViiV Healthcare, Boehringer Ingelheim, Abbvie, and Bristol-Myers Squibb. C. M.’s institution received funds from Stryker for consultations by C. M. H. Z. is cofounder of Brain Biomarker Solutions (Gothenburg, Sweden), a GU Ventures–based platform company at the University of Gothenburg. A. W. has received honoraria or research grants from or has been a consultant or investigator in clinical trials sponsored by Abbott, Boehringer Ingelheim, Bristol-Myers Squibb, Gilead Sciences, GlaxoSmithKline, Janssen-Cilag, Roche, Pfizer, and ViiV Healthcare. M. G. has received grants from Gilead Sciences and honoraria for advisory board participation or lectures from Gilead Sciences, Janssen Pharmaceutica, Bristol Myers Squibb, Merck, and ViiV Healthcare. P. R. through his institution has received independent scientific grant support from Gilead Sciences, Janssen Pharmaceuticals Inc., Merck & Co, Bristol-Myers Squibb and ViiV Healthcare; he has served on scientific advisory board for Gilead Sciences; he serves on data safety monitoring committee for Janssen Pharmaceuticals Inc.; chaired a scientific symposium by ViiV Healthcare, for which his institution has received remuneration. All other authors report no potential conflicts. All authors have submitted the ICMJE Form for Disclosure of Potential Conflicts of Interest. Conflicts that the editors consider relevant to the content of the manuscript have been disclosed.
References
STUDY GROUP MEMBERS
The COBRA Steering Committee: P. Reiss (chair), A. Winston, F. W. Wit, M. Prins, M. F. Schim van der Loeff, J. Schouten, B. Schmand, G. J. Geurtsen, D. J. Sharp, M. W.A. Caan, C. Majoie, J. Villaudy, B. Berkhout, N. A. Kootstra, M. Gisslén, A. Pasternak, C. A. Sabin, G. Guaraldi, A. Bürkle, C. Libert, C. Franceschi, A. Kalsbeek, E. Fliers, J. Hoeijmakers, J. Pothof, M. van der Valk, P. H. Bisschop, P. Portegies, S. Zaheri, and D. Burger.
The COBRA Project Management Board: P. Reiss, A. Winston, F. W. Wit, J.H. Cole, M. W. A. Caan, J. Villaudy, N. A. Kootstra, M. F. Schim van der Loeff, M. Gisslén, C. A. Sabin, A. Bürkle, and W. Zikkenheiner.
The Management Team: P. Reiss, W. Zikkenheiner, F. W. Wit, and F. R. Janssen.
The Clinical Cohort Team: A. Winston, F. W. Wit, J. Underwood, J. Schouten, K. W. Kooij, R. A. van Zoest, N. Doyle, M. Prins, M. Schim van der Loeff, P. Portegies, B. A. Schmand, G. J. Geurtsen, E. Verheij, S. O. Verboeket, B. C. Elsenga, M. van der Valk, S. Zaheri, M. M. J. Hillebregt, Y. M. C. Ruijs, D. P. Benschop, L. Tembo, L. McDonald, M. Stott, K. Legg, A. Lovell, O. Erlwein, C. Kingsley, P. Norsworthy, S. Mullaney, T. Kruijer, L. del Grande, V. Olthof, G.R. Visser, L. May, F. Verbraak, N. Demirkaya, I. Visser, and G. Guaraldi.
The Neuroimaging Team: D. J. Sharp, M. W. A. Caan, J. H. Cole, C. B. L. M. Majoie, T. Su, R. Leech, and J. Huguet.
The HIS Mouse Study Team: J. Villaudy, E. Frankin, A. Pasternak, B. Berkhout, A. van der Kuyl, K. Weijer, and E. Siteur-Van Rijnstra.
The Biomarker Team: N. A. Kootstra, M. Gisslén, A. M. Harskamp-Holwerda, I. Maurer, M. M. Mangas Ruiz, A. F. Girigorie, B. Boeser-Nunnink, A. Kalsbeek, P. H. L. T. Bisschop, D. Burger, M. de Graaff-Teulen, J. Hoeijmakers, J. Pothof, C. Libert, S. Dewaele, C. Franceschi, P. Garagnani, C. Pirazzini, M. Capri, F. Dall’Olio, M. Chiricolo, S. Salvioli, D. Fuchs, H. Zetterberg, D. Weber, T. Grune, and E. H. J. M. Jansen.
The Data Management and Analysis Team: C. A. Sabin, D. De Francesco, and F. W. Wit.
The Dissemination Team: A. Bürkle, T. Sindlinger, S. Oehlke, W. Zikkenheiner, and R. A. van Zoest.
Author notes
R. A. v. Z. and J. U. contributed equally to this work and share first authorship.
M. G. and P. R. contributed equally to this work and share last authorship.

